
Sample Category Title
Risk-On Wave Sweeps Markets, Bessent Continues Aggressive Fed Cut Call, Stimulus Boost
A strong wave of risk appetite is sweeping through global markets, with equities gaining ground across the board. Major European indexes are firmly higher, Japan’s Nikkei marked its second straight record close, and US futures are pointing to another day of record highs for S&P 500 and NASDAQ. Investors are finding comfort in a mix of supportive policy narratives.
In the US, Treasury Secretary Scott Bessent again pressed for an outsized move from the Fed at its September meeting. In a Bloomberg interview today, he argued that poor-quality US jobs data earlier this year delayed necessary rate cuts and suggested that, had the data been more accurate, easing could have begun months ago. He placed the odds of a 50 basis point cut at “very good”.
Bessent further said the Fed could embark on a “series” of cuts starting next month, and eventually rates should be lowered by as much as 150-175 basis points in total. That makes his stance far more aggressive than current market expectations. Futures markets still overwhelmingly price a 25 basis point move next month, with little shift toward the larger cut Bessent is advocating.
From Asia, China unveiled a new program to stimulate consumption by offering interest subsidies on loans to households and businesses. Vice Finance Minister Liao Min said the policy aims to strengthen domestic demand as a key driver of growth, targeting both consumer sectors and service industries. The move comes as Beijing looks to bolster the economy without putting undue pressure on bank profitability.
The scheme will provide a one percentage point annual interest subsidy on eligible loans in eight consumer service sectors and for personal borrowing. Crucially, the government—not the banks—will bear the subsidy cost, in contrast to prior measures that forced lenders to lower rates directly. This approach should preserve bank margins while encouraging greater credit uptake.
On the FX side, Dollar is bearing the brunt of today’s risk-on tone, sliding to the bottom of the performance table alongside Loonie and Yen. Kiwi is out front, with Sterling and Swiss Franc also firm. Euro and Australian Dollar are trading in the middle.
In Europe, at the time of writing, FTSE is up 0.21%. DAX is up 0.80%. CAC is up 0.57%. UK 10-year yield is down -0.013 at 4.616. Germany 10-year yield is down -0.041 at 2.706. Earlier in Asia, Nikkei rose 1.30%. Hong Kong HSI rose 2.58%. China Shanghai SSE rose 0.48%. Singapore Strait Times rose 1.23%. 10-year JGB yield rose 0.021 to 1.521.
EUR/USD clears 1.17, Trump’s lawsuit threat against Powell adds to Dollar’s woe
Dollar’s selloff gathered pace in European trading, with EUR/USD breaking above the 1.17 mark and appearing ready to retest 1.1829 short-term top. Momentum in the pair reflects broad pressure on the greenback, though Fed rate expectations have shifted only modestly.
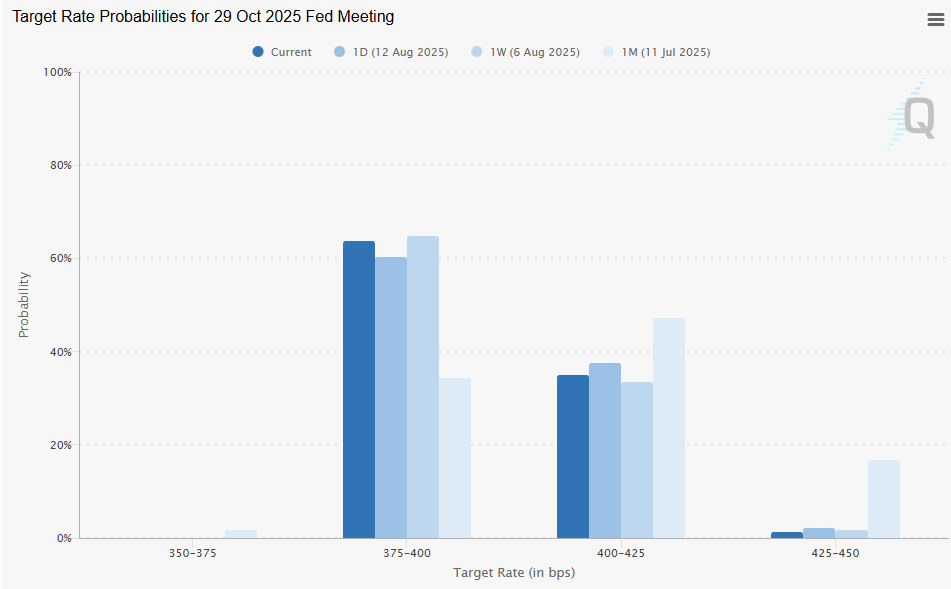
Markets now assign a 96.22% probability to a 25bps cut at the September FOMC, up slightly from 94.59% a week ago. Odds of a follow-up move to 3.75–4.00% stand at 63.77%, even slightly lower than last week’s 64.71%. This muted change suggests that neither US President Donald Trump’s political pressure nor Treasury Secretary Scott Bessent’s call for a 50bps cut have meaningfully shifted rate expectations.
Instead, Dollar weakness may be more closely tied to concerns over Fed’s institutional credibility. White House press secretary Karoline Leavitt confirmed Tuesday that Trump is “considering a lawsuit” against Fed Chair Jerome Powell. The president also attacked Powell on social media, blaming him for being “Too Late” in policy decisions and criticizing what he claimed was a USD 3B overspend on Fed building renovations.
The political rhetoric raises questions about perceived threats to the Fed’s independence, a factor that could be weighing on the currency even more than rate speculation. The potential legal action, while unprecedented, may be seen as part of a broader effort to influence monetary policy direction ahead of upcoming meetings.
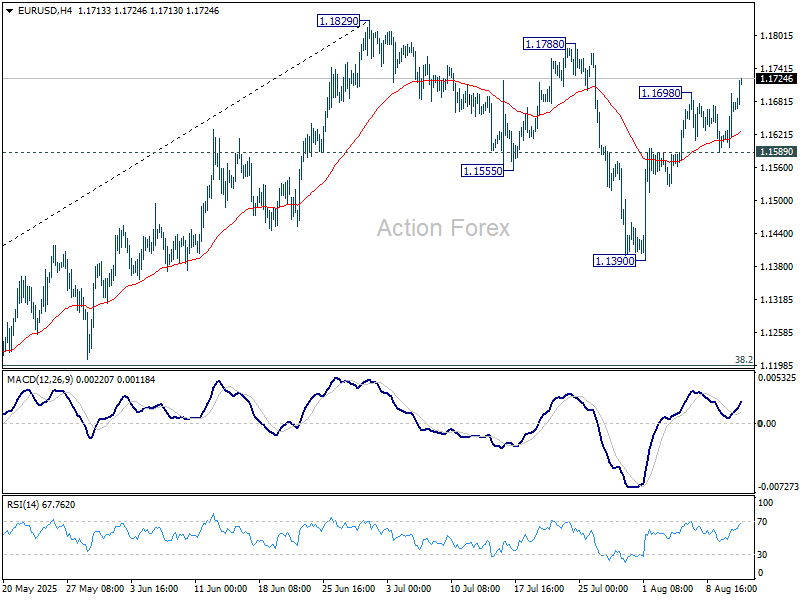
Technically, EUR/USD’s rally from 1.1390 has resumed with a break above 1.1698. The next target is a retest of the 1.1829 resistance,. Decisive break there would resume the medium-term uptrend.
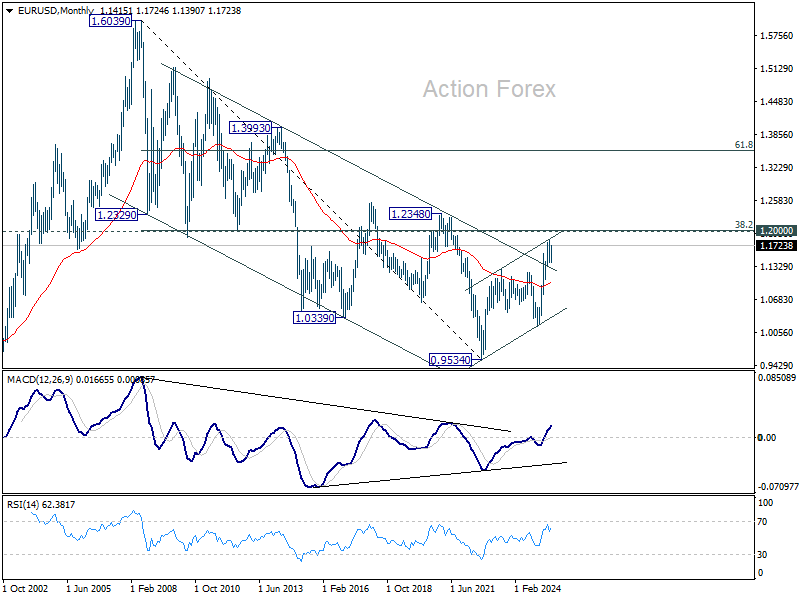
More importantly, the next leg higher would bring the pair to face a long-term resistance zone around 1.20. This includes the 38.2% retracement of the 1.6039 (2008 high) to 0.9534 (2022 low) at 1.2019. Sustained break would strengthen the case that the rise from 0.9534 is the start of a long-term uptrend reversing more than 14 years of prior decline.
ECB Vice President Luis de Guindos remarked in early July that an exchange rate of 1.17–1.20 is “perfectly acceptable” but suggested that moves beyond $1.20 could pose complications, particularly in terms of deflationary pressures. This makes 1.20 a critical line to watch — both technically and from a policy perspective — in the weeks ahead.
GBP/USD Mid-Day Outlook
Daily Pivots: (S1) 1.3438; (P) 1.3481; (R1) 1.3543; More...
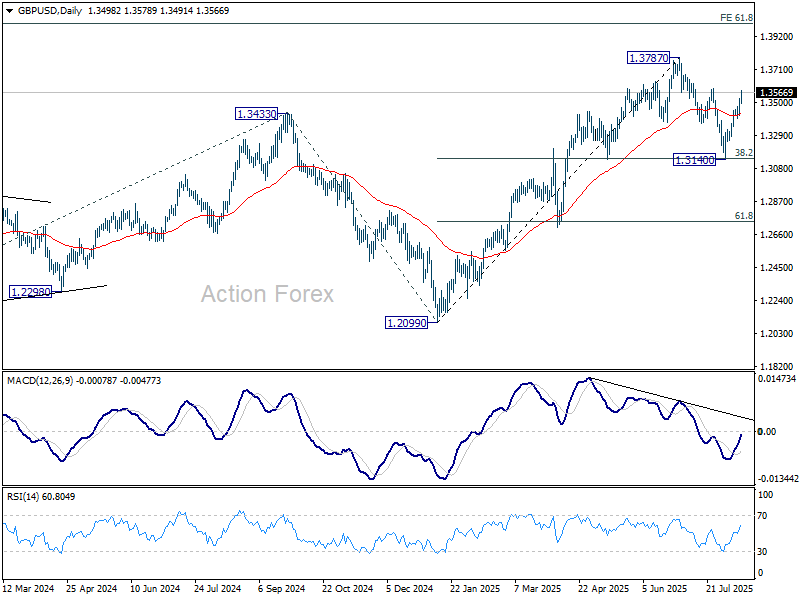
GBP/USD's rally from 1.3140 re-accelerates higher today and intraday bias stays on the upside. Correction from 1.3787 should have completed with three waves down to 1.3140. Firm break of 1.3587 will bring retest of 1.3787 high. On the downside, below 1.3476 minor support will turn intraday bias neutral and bring consolidations first, before staging another rally.
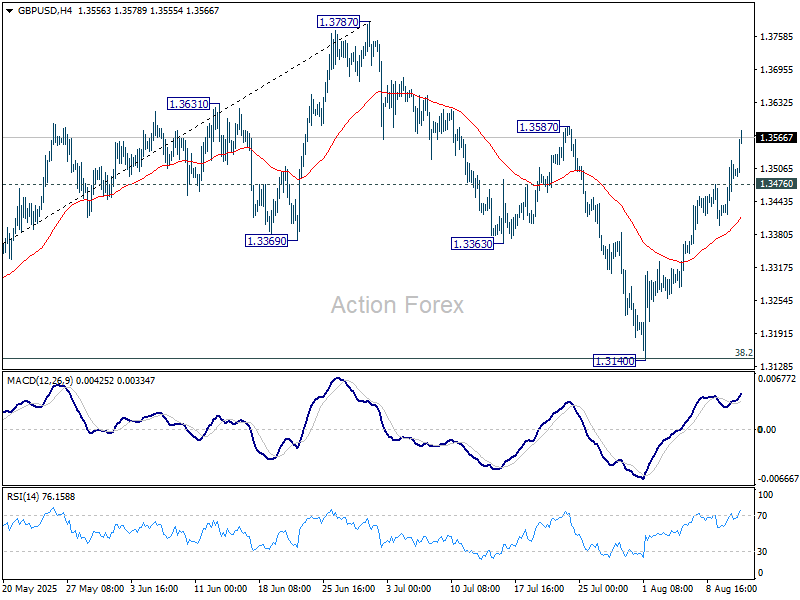
In the bigger picture, up trend from 1.3051 (2022 low) is in progress. Next medium term target is 61.8% projection of 1.0351 to 1.3433 from 1.2099 at 1.4004. Outlook will now stay bullish as long as 55 W EMA (now at 1.3068) holds, even in case of deep pullback.
GBP/USD: Bulls Accelerate for the Second Straight Day and Approach Strong Barriers
Cable continues to trend higher and nears key near-term barriers at 1.3588 (July 24 high) and 1.3618 (daily Ichimoku cloud top).
Weaker dollar on fresh signals of Fed rate cuts (the first cut to be expected in September) and latest data from UK labor sector, which do not urge BoE for immediate rate cuts, provided good support for sterling in last two sessions.
Break above psychological 1.3500 barrier (reinforced by 55DMA) and 1.3541 (Fibo 61.8% of 1.3788/1.3141) generated fresh bullish signal (to be confirmed on close above the latter).
Technical picture turned bullish on daily chart (north-heading 14-d momentum broke into positive territory / MA’s in full bullish setup, with formation of 10/100 DMA bull-cross) and support the action.
Bulls approach significant resistances (1.3588/1.3618) where increased headwinds cannot be ruled out, as Stochastic is strongly overbought.
Limited dips (ideally to be contained by 1.3500 zone ( to mark a healthy correction before bulls regain traction for final push through 1.3588/1.3618 triggers.
Firm break here to unmask key target at 1.3788 (2025 high, the highest since Oct 2021).
Res: 1.3588; 1.3618; 1.3635; 1.3700.
Sup: 1.3541; 1.3500; 1.3464; 1.3419.
Nasdaq 100 Heads for 30,000, Nikkei 225 for 50,000
The S&P500 and Nasdaq100 indices hit new all-time highs on Tuesday and are continuing to grow, fuelled by increasing confidence that the Fed will cut interest rates.
According to the latest estimates, the probability of a cut in September has risen to 96% from a low of 38% immediately after hawkish comments following the last FOMC meeting. The growing expectation that this will not be a one-off cut appears to be fuelling longer-term stock growth. Markets are pricing in a 53% chance of three cuts and a 93% chance of two cuts by the end of the year, compared to 8% and 40% on 31 July. The increased likelihood of three cuts by the end of the year is likely to remain a fundamental driver of the broader stock market.
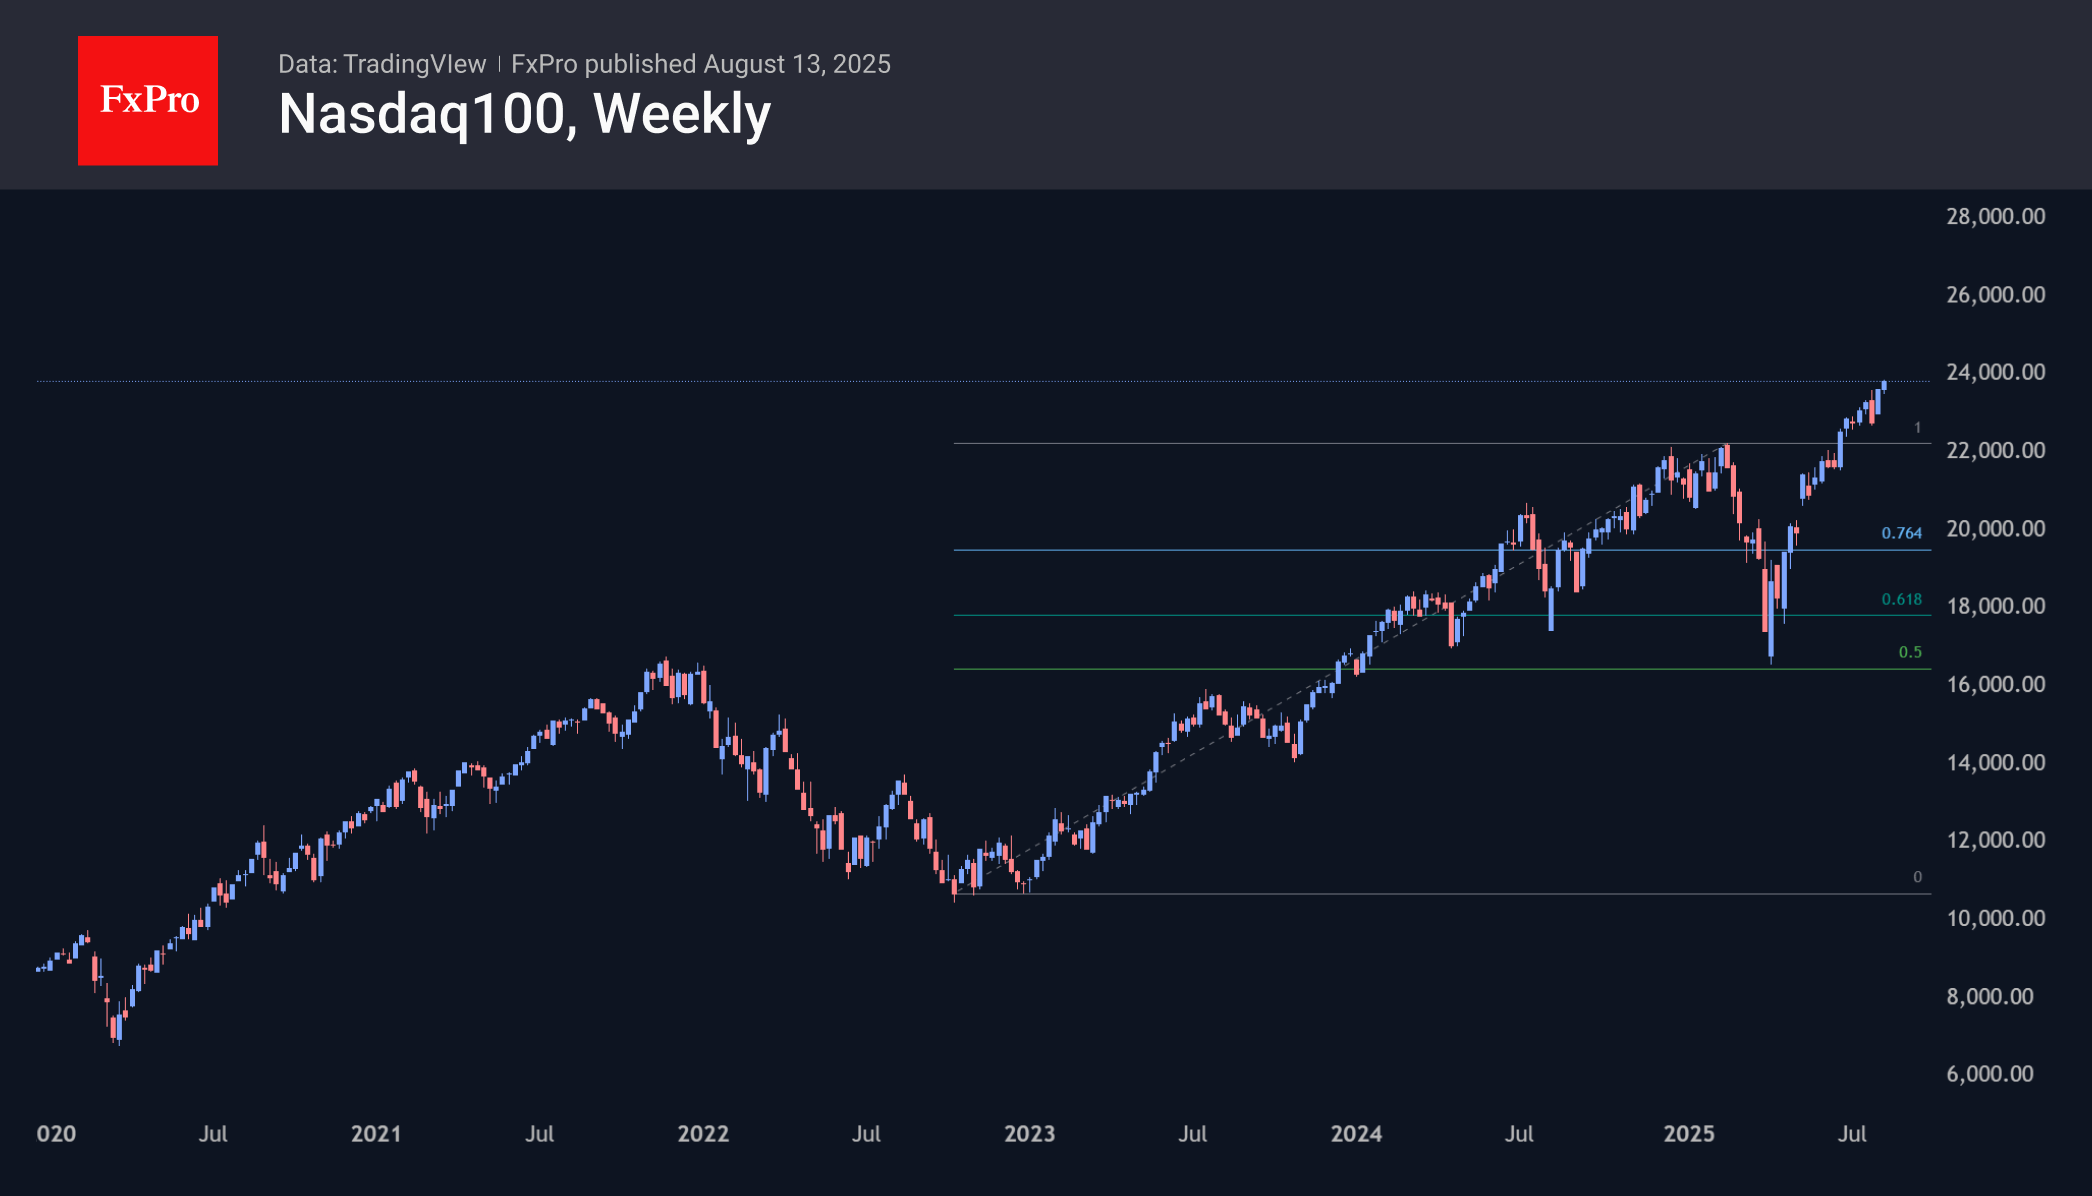
The Nasdaq100 is approaching 24,000, but thanks to the dip in early August, it is far from overbought. The long-term outlook is also quite ambitious, as the 26% sell-off in February-April was a 50% correction of the rise from the lows in October 2022. According to the Fibonacci extension, the long-term target for this momentum now looks to be the 30,000 area.
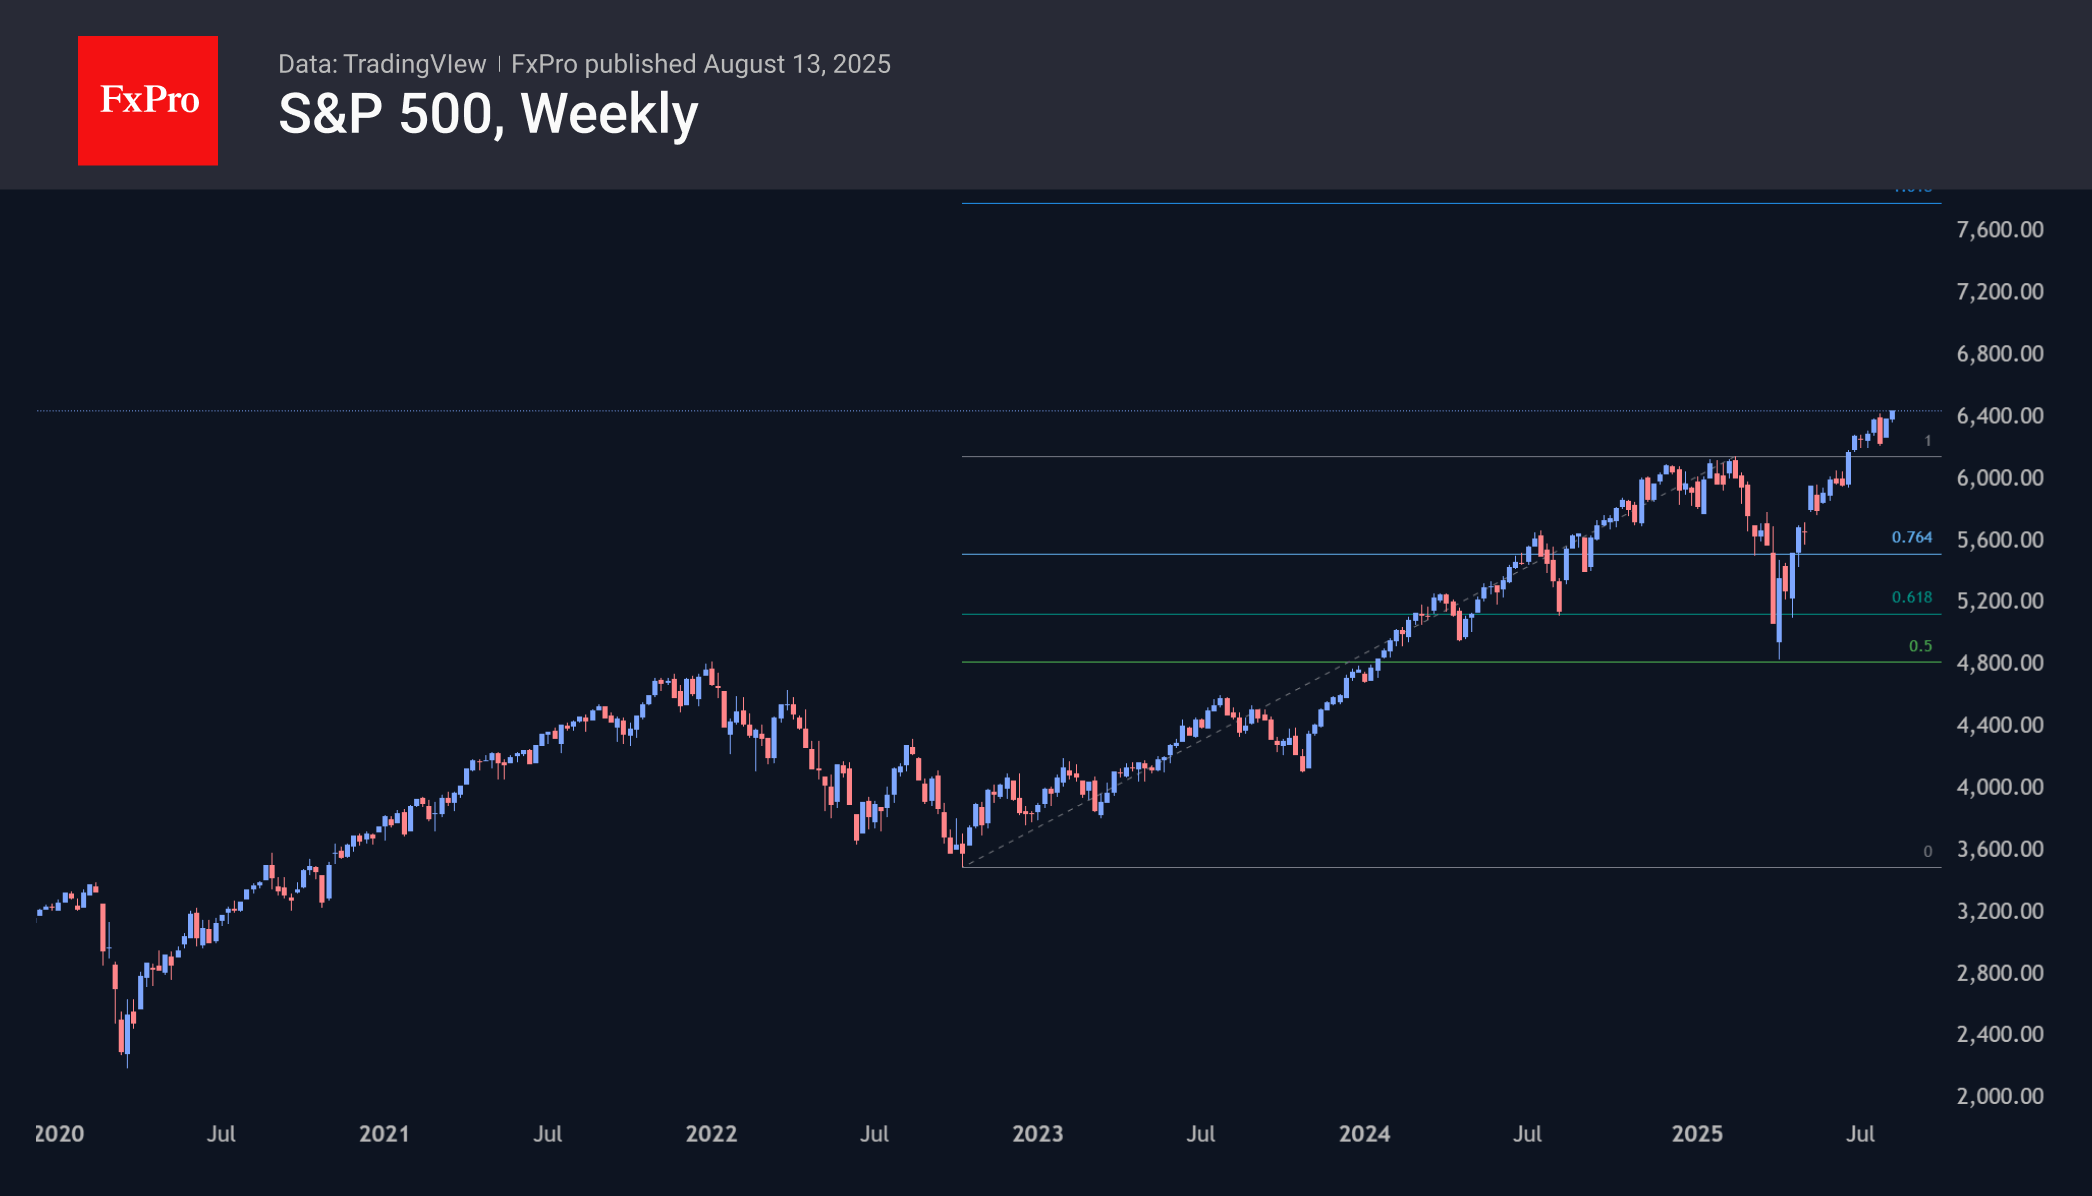
The S&P 500 has a similar long-term technical picture, where the April lows were a 50% retracement of the October 2022-February 2025 rally. The ultimate target for the current momentum looks to be the 7800 area, which the market could reach in 3-4 quarters from the current 6460.
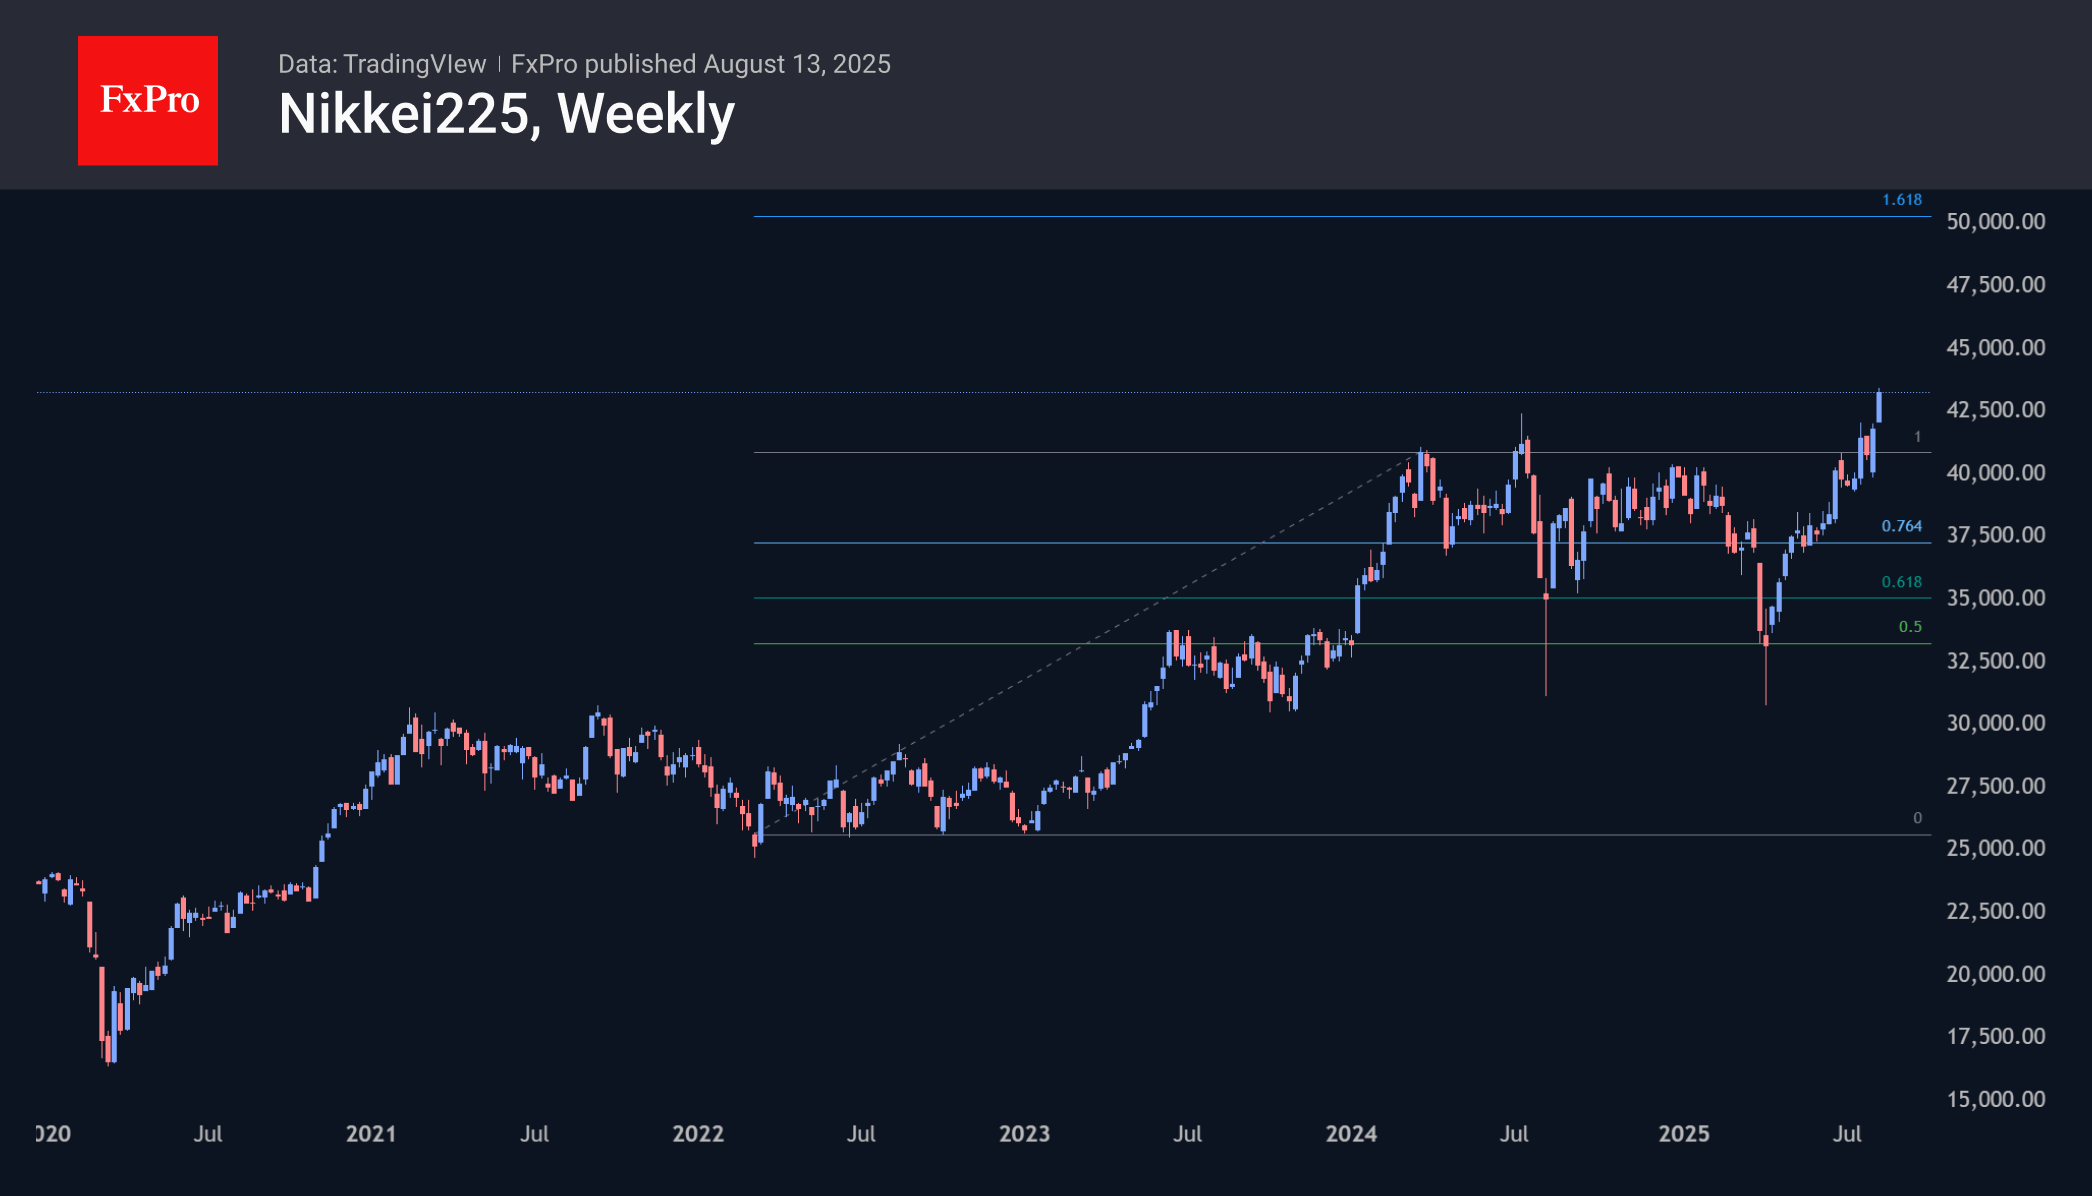
It is also worth mentioning the remarkable dynamics of the Japanese market, where the Nikkei 225 has gained more than 9.5% since last Monday. The Japanese market is reflecting both the change in sentiment on the American markets and the growing expectations that the Bank of Japan’s rate hike keeps getting kicked down the road. The third pillar of growth is the falling prices for commodities and energy, which the Land of the Rising Sun imports in abundance.
Against this background, the Nikkei225 has updated the historical highs set just over a year ago, potentially heading towards 50,000 from the current 43,300.
USD/JPY Gains Ground as Market Favouring Risk Appetite
The USD/JPY pair climbed to 148.00 on Wednesday, with the yen relinquishing its earlier gains as a rally in global risk assets dampened demand for the safe-haven currency.
The move followed the release of US inflation data, which bolstered expectations of a Federal Reserve rate cut next month.
In Japan, manufacturing sentiment improved for the second consecutive month in August, supported by a trade agreement with Washington. The US reduced tariffs on Japanese cars and other goods to 15% in exchange for a $550 billion investment package from Tokyo.
Meanwhile, producer price growth slowed to an 11-month low in July, reflecting pressure on domestic firms from higher US tariffs.
Monetary policy uncertainty persists, with Bank of Japan (BoJ) policymakers divided on the timing and pace of future rate hikes. Some officials advocate maintaining an accommodative stance, citing risks to the central bank’s economic forecasts.
Currently, capital markets show little appetite for safe-haven assets, traditionally a role filled by the yen. Doubts over the BoJ’s policy direction further undermine the currency’s appeal.
Technical Analysis: USD/JPY
H4 Chart:
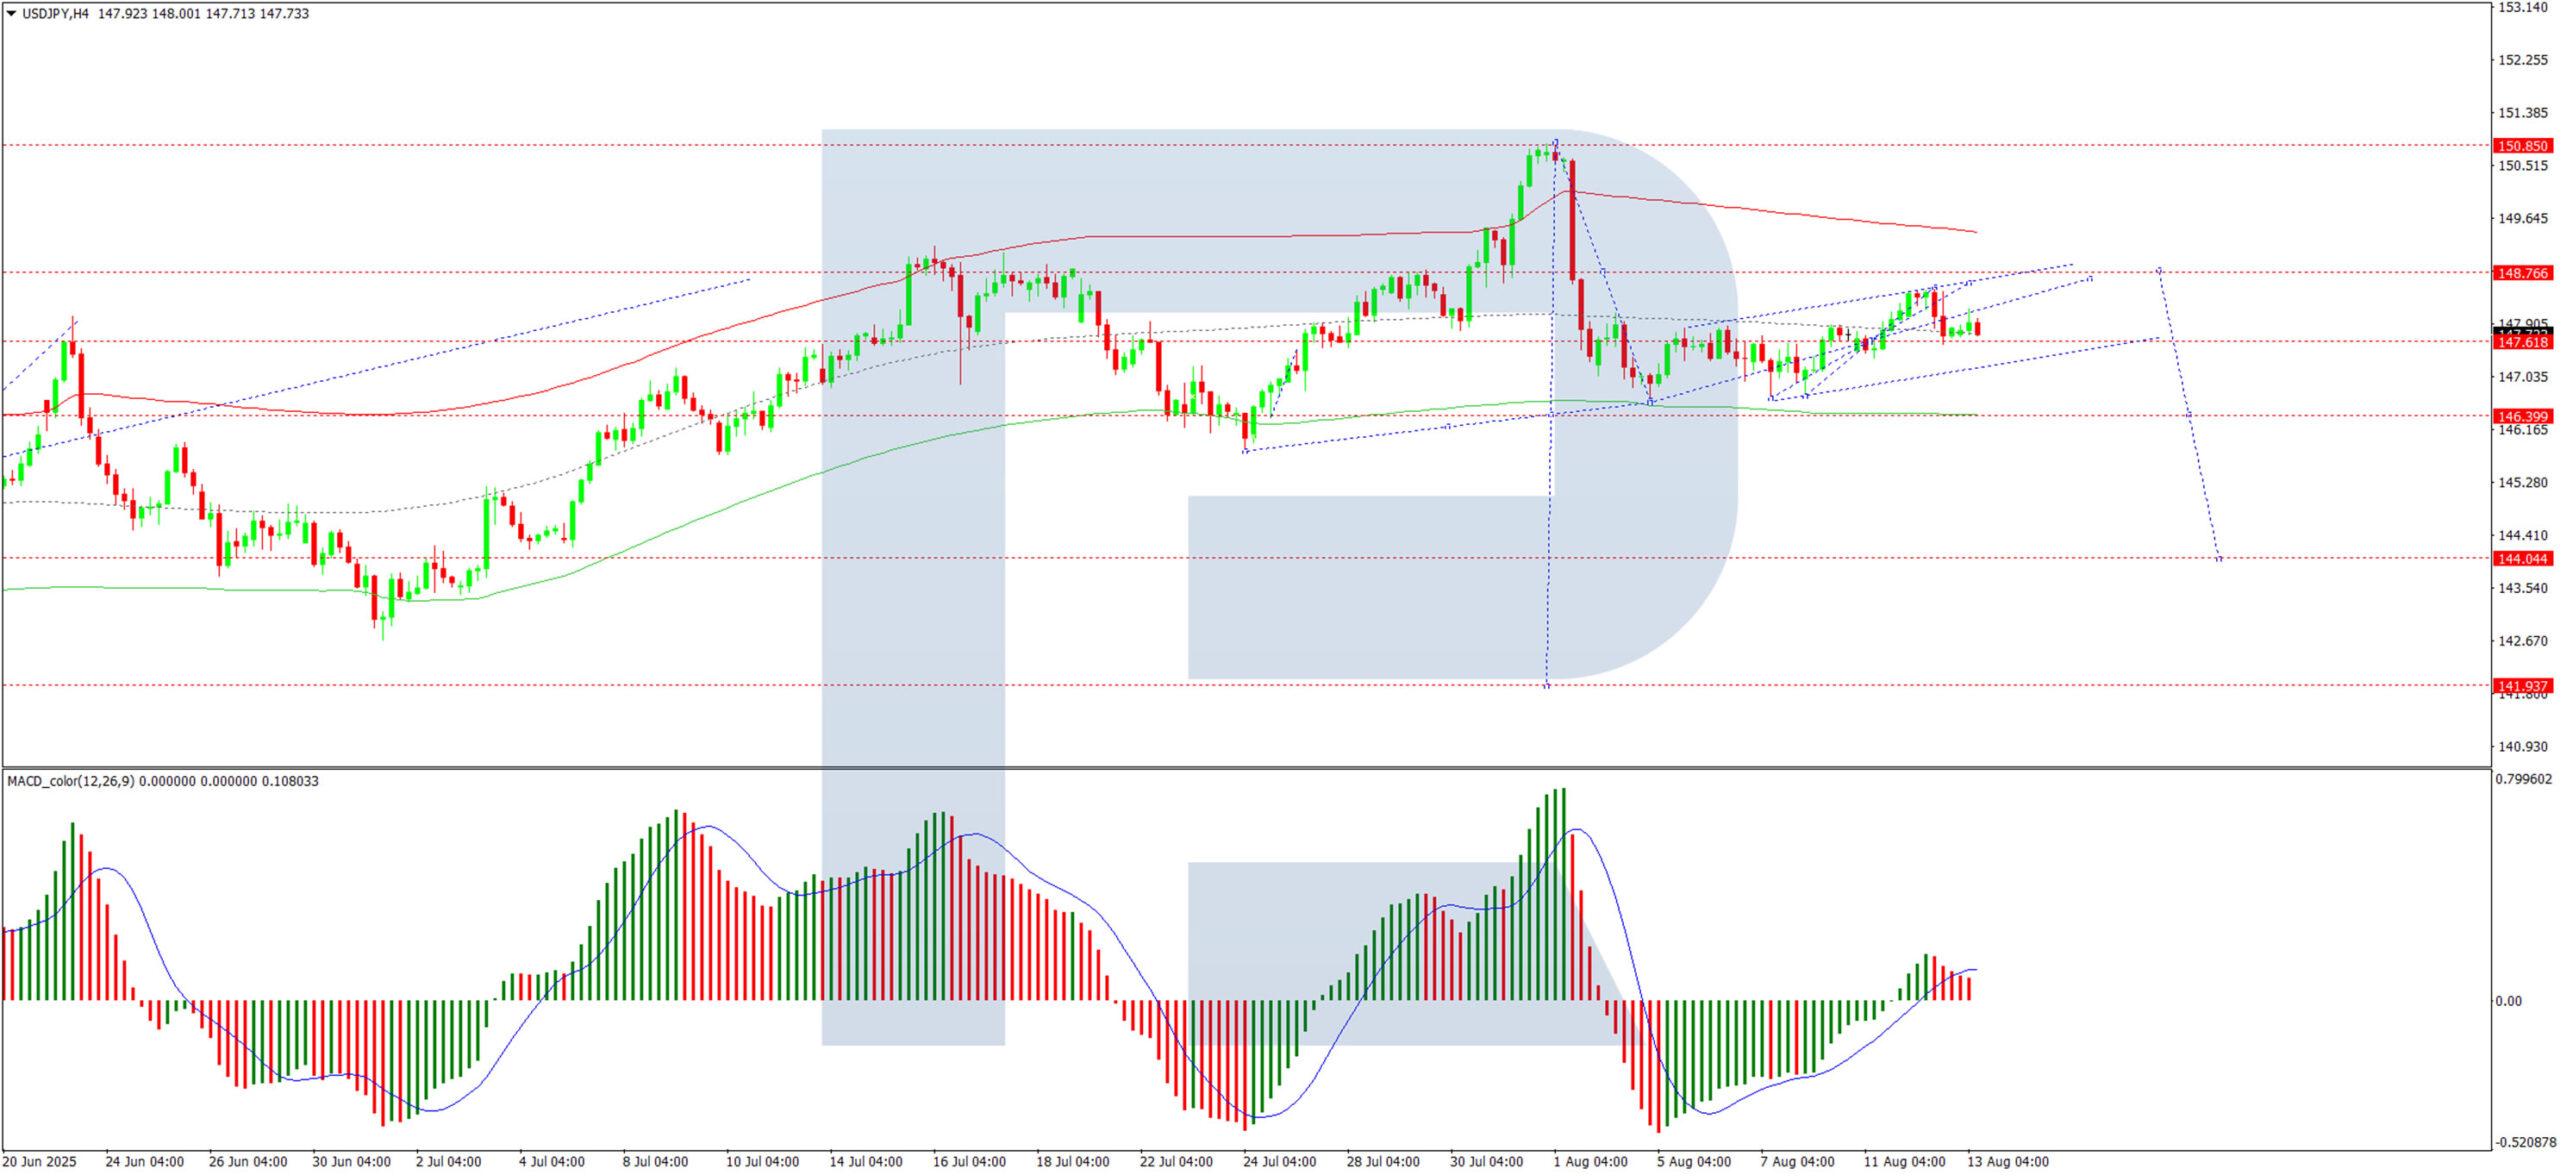
The USD/JPY pair continues its corrective wave towards 148.60. A pullback to 147.52 is expected today, after which another upswing to 148.60 may materialise. Once this wave exhausts, a decline towards 146.40 is anticipated. This scenario is technically validated by the MACD indicator, with its signal line above zero and trending upwards.
H1 Chart:
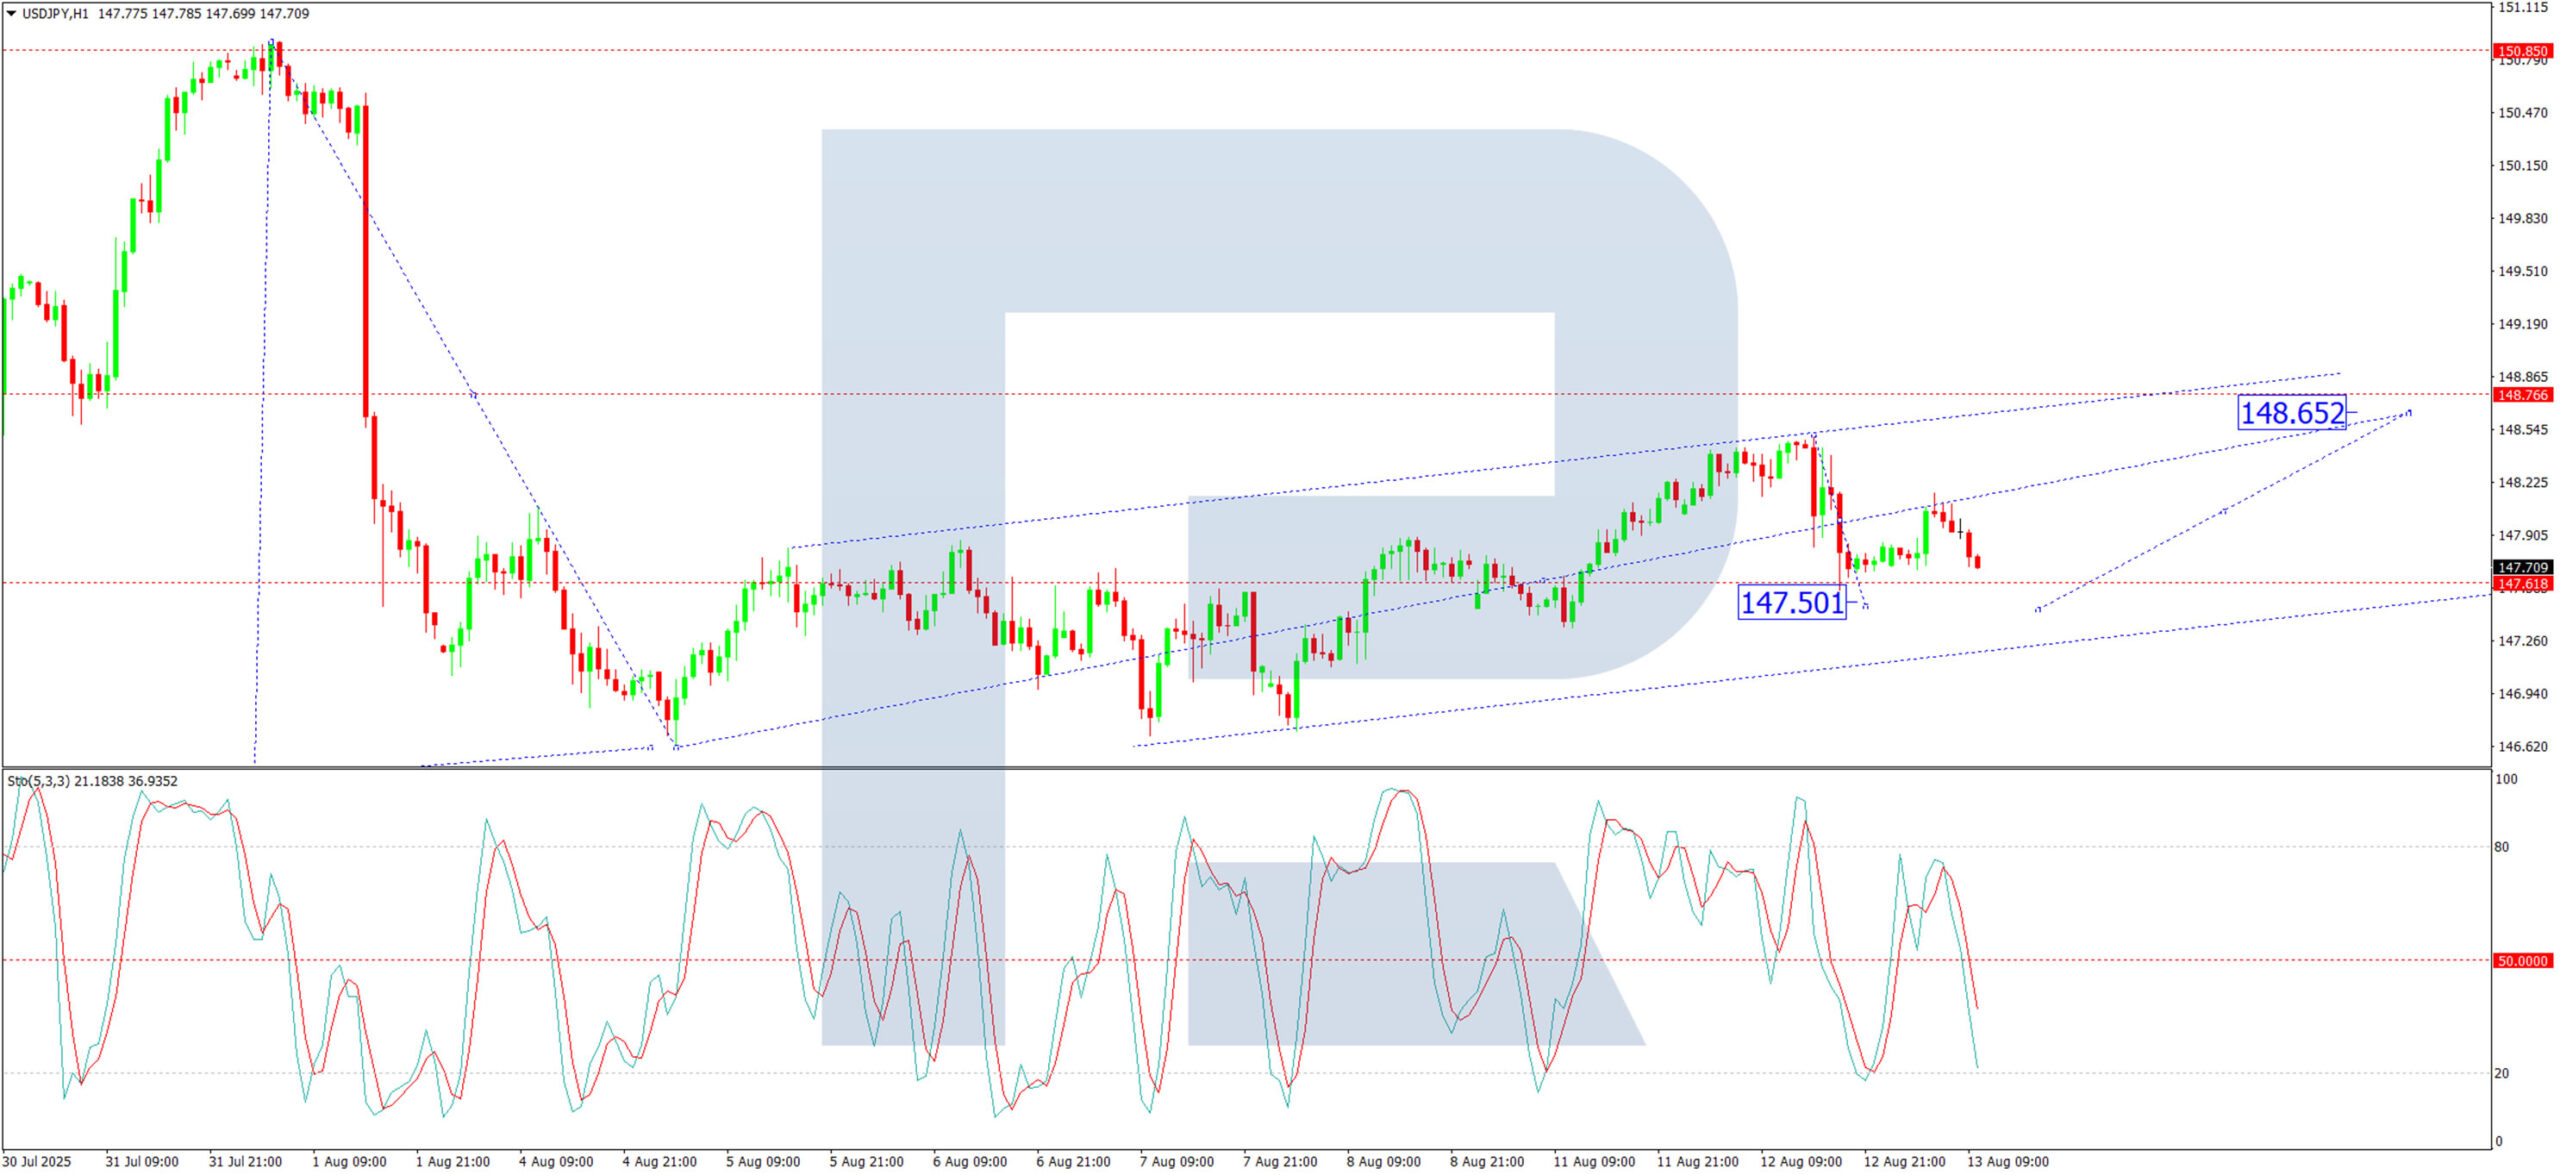
The pair has entered a consolidation phase around 148.00. A dip to 147.50 is likely today, potentially followed by an extension towards 148.65. The Stochastic oscillator supports this view, with its signal line below 50 and pointing downward.
Conclusion
The USD/JPY remains buoyed by risk-on sentiment, though technical indicators suggest near-term volatility is likely. Traders will monitor BoJ policy signals and US economic data for further direction.
EUR/USD clears 1.17, Trump’s lawsuit threat against Powell adds to Dollar’s woe
Dollar’s selloff gathered pace in European trading, with EUR/USD breaking above the 1.17 mark and appearing ready to retest 1.1829 short-term top. Momentum in the pair reflects broad pressure on the greenback, though Fed rate expectations have shifted only modestly.
Markets now assign a 96.22% probability to a 25bps cut at the September FOMC, up slightly from 94.59% a week ago. Odds of a follow-up move to 3.75–4.00% stand at 63.77%, even slightly lower than last week’s 64.71%. This muted change suggests that neither US President Donald Trump’s political pressure nor Treasury Secretary Scott Bessent’s call for a 50bps cut have meaningfully shifted rate expectations.
Instead, Dollar weakness may be more closely tied to concerns over Fed’s institutional credibility. White House press secretary Karoline Leavitt confirmed Tuesday that Trump is “considering a lawsuit” against Fed Chair Jerome Powell. The president also attacked Powell on social media, blaming him for being “Too Late” in policy decisions and criticizing what he claimed was a USD 3B overspend on Fed building renovations.
The political rhetoric raises questions about perceived threats to the Fed’s independence, a factor that could be weighing on the currency even more than rate speculation. The potential legal action, while unprecedented, may be seen as part of a broader effort to influence monetary policy direction ahead of upcoming meetings.
Technically, EUR/USD’s rally from 1.1390 has resumed with a break above 1.1698. The next target is a retest of the 1.1829 resistance,. Decisive break there would resume the medium-term uptrend.
More importantly, the next leg higher would bring the pair to face a long-term resistance zone around 1.20. This includes the 38.2% retracement of the 1.6039 (2008 high) to 0.9534 (2022 low) at 1.2019. Sustained break would strengthen the case that the rise from 0.9534 is the start of a long-term uptrend reversing more than 14 years of prior decline.
ECB Vice President Luis de Guindos remarked in early July that an exchange rate of 1.17–1.20 is “perfectly acceptable” but suggested that moves beyond $1.20 could pose complications, particularly in terms of deflationary pressures. This makes 1.20 a critical line to watch — both technically and from a policy perspective — in the weeks ahead.
Gold Pulls Back While WTI Crude Oil Struggles In Red
Gold price started a fresh decline below $3,380. WTI Crude oil is also down and remains at risk of more losses below $62.00.
Important Takeaways for Gold and WTI Crude Oil Price Analysis Today
- Gold price climbed higher toward the $3,410 zone before there was a sharp decline against the US Dollar.
- A key bearish trend line is forming with resistance near $3,355 on the hourly chart of gold at FXOpen.
- WTI Crude oil prices extended losses below the $65.00 support zone.
- A major bearish trend line is formed with resistance at $63.05 on the hourly chart of XTI/USD at FXOpen.
Gold Price Technical Analysis
On the hourly chart of Gold at FXOpen, the price climbed above the $3,380 resistance. The price even spiked above $3,400 before the bears appeared.
A high was formed near $3,409 before there was a fresh decline. There was a move below the $3,380 pivot level. The bears even pushed the price below the $3,350 support and the 50-hour simple moving average.
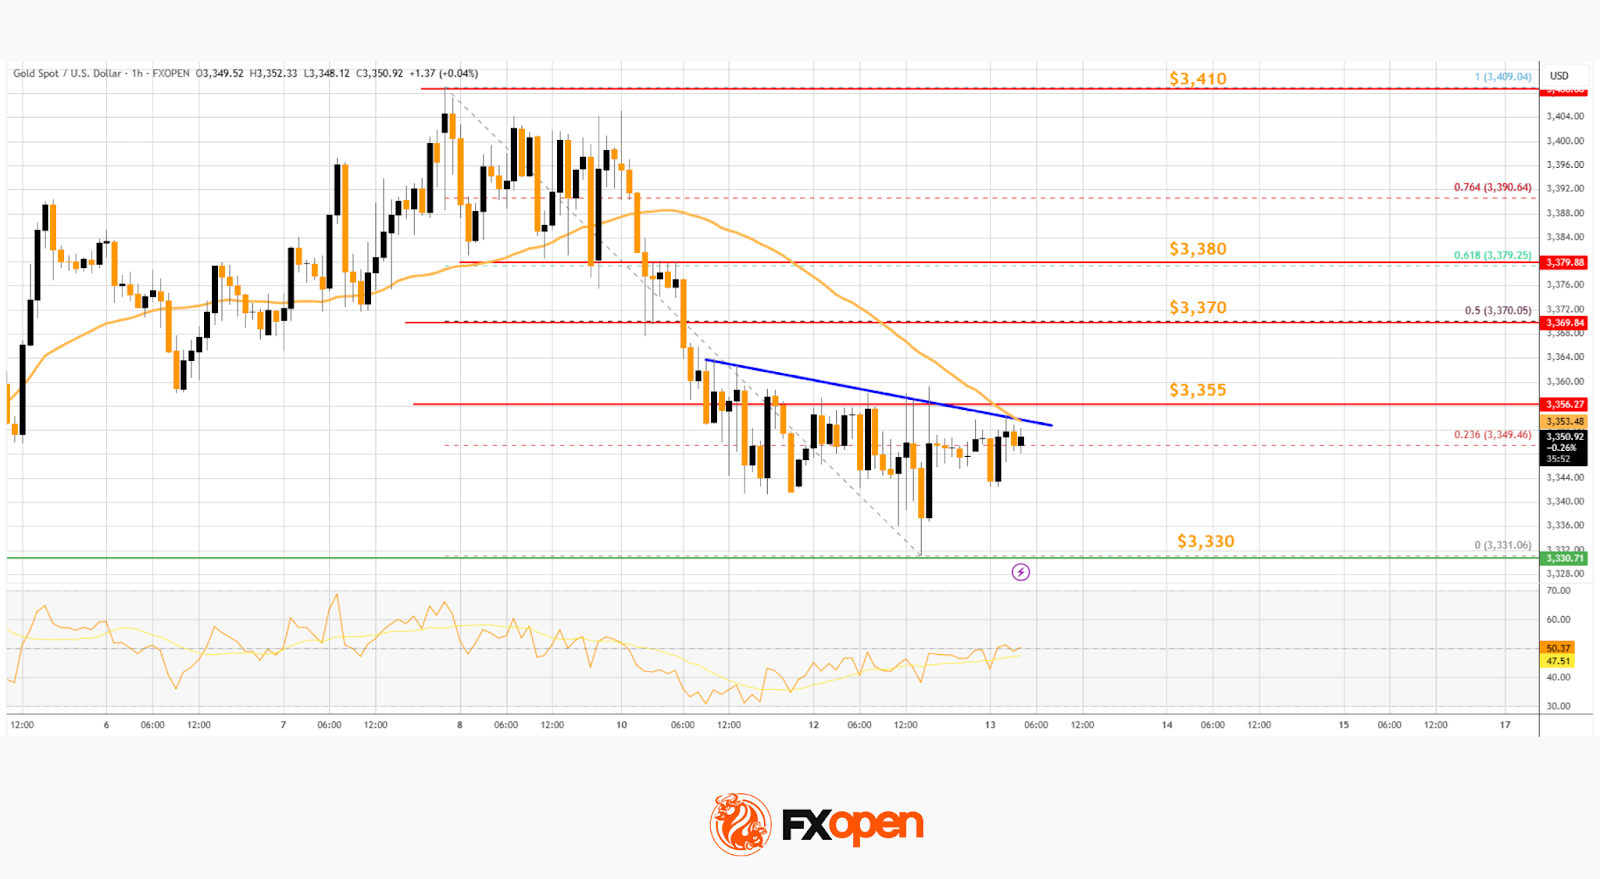
It tested the $3,330 zone. A low has formed near $3,331 and the price is now consolidating losses near the 23.6% Fib retracement level of the downward move from the $3,409 swing high to the $3,331 low.
Immediate resistance on the upside is near a bearish trend line at $3,355 and the 50-hour simple moving average. The next major hurdle is near the 50% Fib retracement level.
The main barrier for the bulls could be near the $3,380 level, above which the price could test the $3,400 zone. Any more gains might call for a move toward $3,410. An upside break above $3,410 could send Gold price toward $3,425.
Initial support on the downside is near $3,330. The next key level is $3,320. If there is a downside break below $3,320, the price might decline further. In the stated case, the price might drop toward the $3,300 zone.
WTI Crude Oil Price Technical Analysis
On the hourly chart of WTI Crude Oil at FXOpen, the price struggled to continue higher above $66.00 against the US Dollar. The price formed a short-term top and started a fresh decline below $65.00.
There was a steady decline below the $64.50 pivot level. The bears even pushed the price below $63.50 and the 50-hour simple moving average. Finally, the price tested the $62.15 zone, and the price is now consolidating losses.
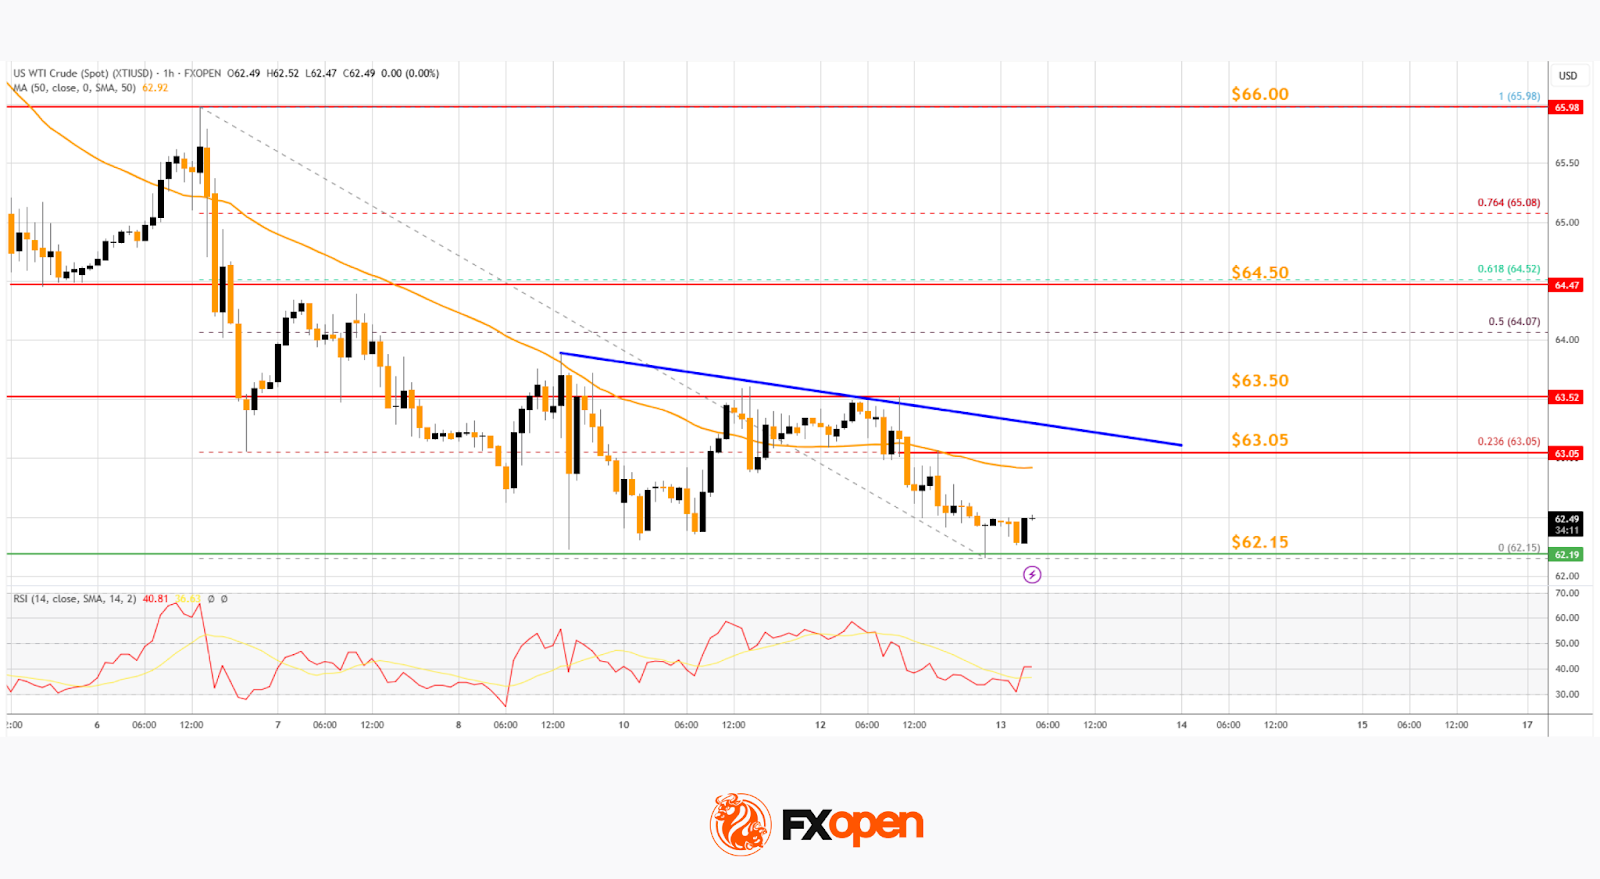
On the upside, immediate resistance is near the 23.6% Fib retracement level of the downward move from the $65.98 swing high to the $62.15 low at $63.05. There is also a major bearish trend line at $63.05 and the 50-hour simple moving average.
The main hurdle is $63.50. A clear move above the $63.50 zone could send the price toward the 61.8% Fib retracement level at $64.50.
The next key resistance is near $66.00. If the price climbs further higher, it could face sellers near $68.00. Any more gains might send the price toward the $70.00 level.
Immediate support is near the $62.15 level. The next major level on the WTI crude oil chart is near $61.20. If there is a downside break, the price might decline toward $60.00. Any more losses may perhaps open the doors for a move toward the $55.00 zone.
Trade over 50 forex markets 24 hours a day with FXOpen. Take advantage of low commissions, deep liquidity, and spreads from 0.0 pips. Open your FXOpen account now or learn more about trading forex with FXOpen.
This article represents the opinion of the Companies operating under the FXOpen brand only. It is not to be construed as an offer, solicitation, or recommendation with respect to products and services provided by the Companies operating under the FXOpen brand, nor is it to be considered financial advice.
BTC Cannot Keep Up With Altcoins
Market Overview
The crypto market has returned to its historical highs, with a cap of nearly $4.05 trillion, reaching a peak of $4.8 trillion. Major altcoins led by Ethereum (+7.5%), Solana (+12%), Cardano (+8.5%), and Chainlink (+9.3%) contributed to the total growth of 2.3% over the past 24 hours.
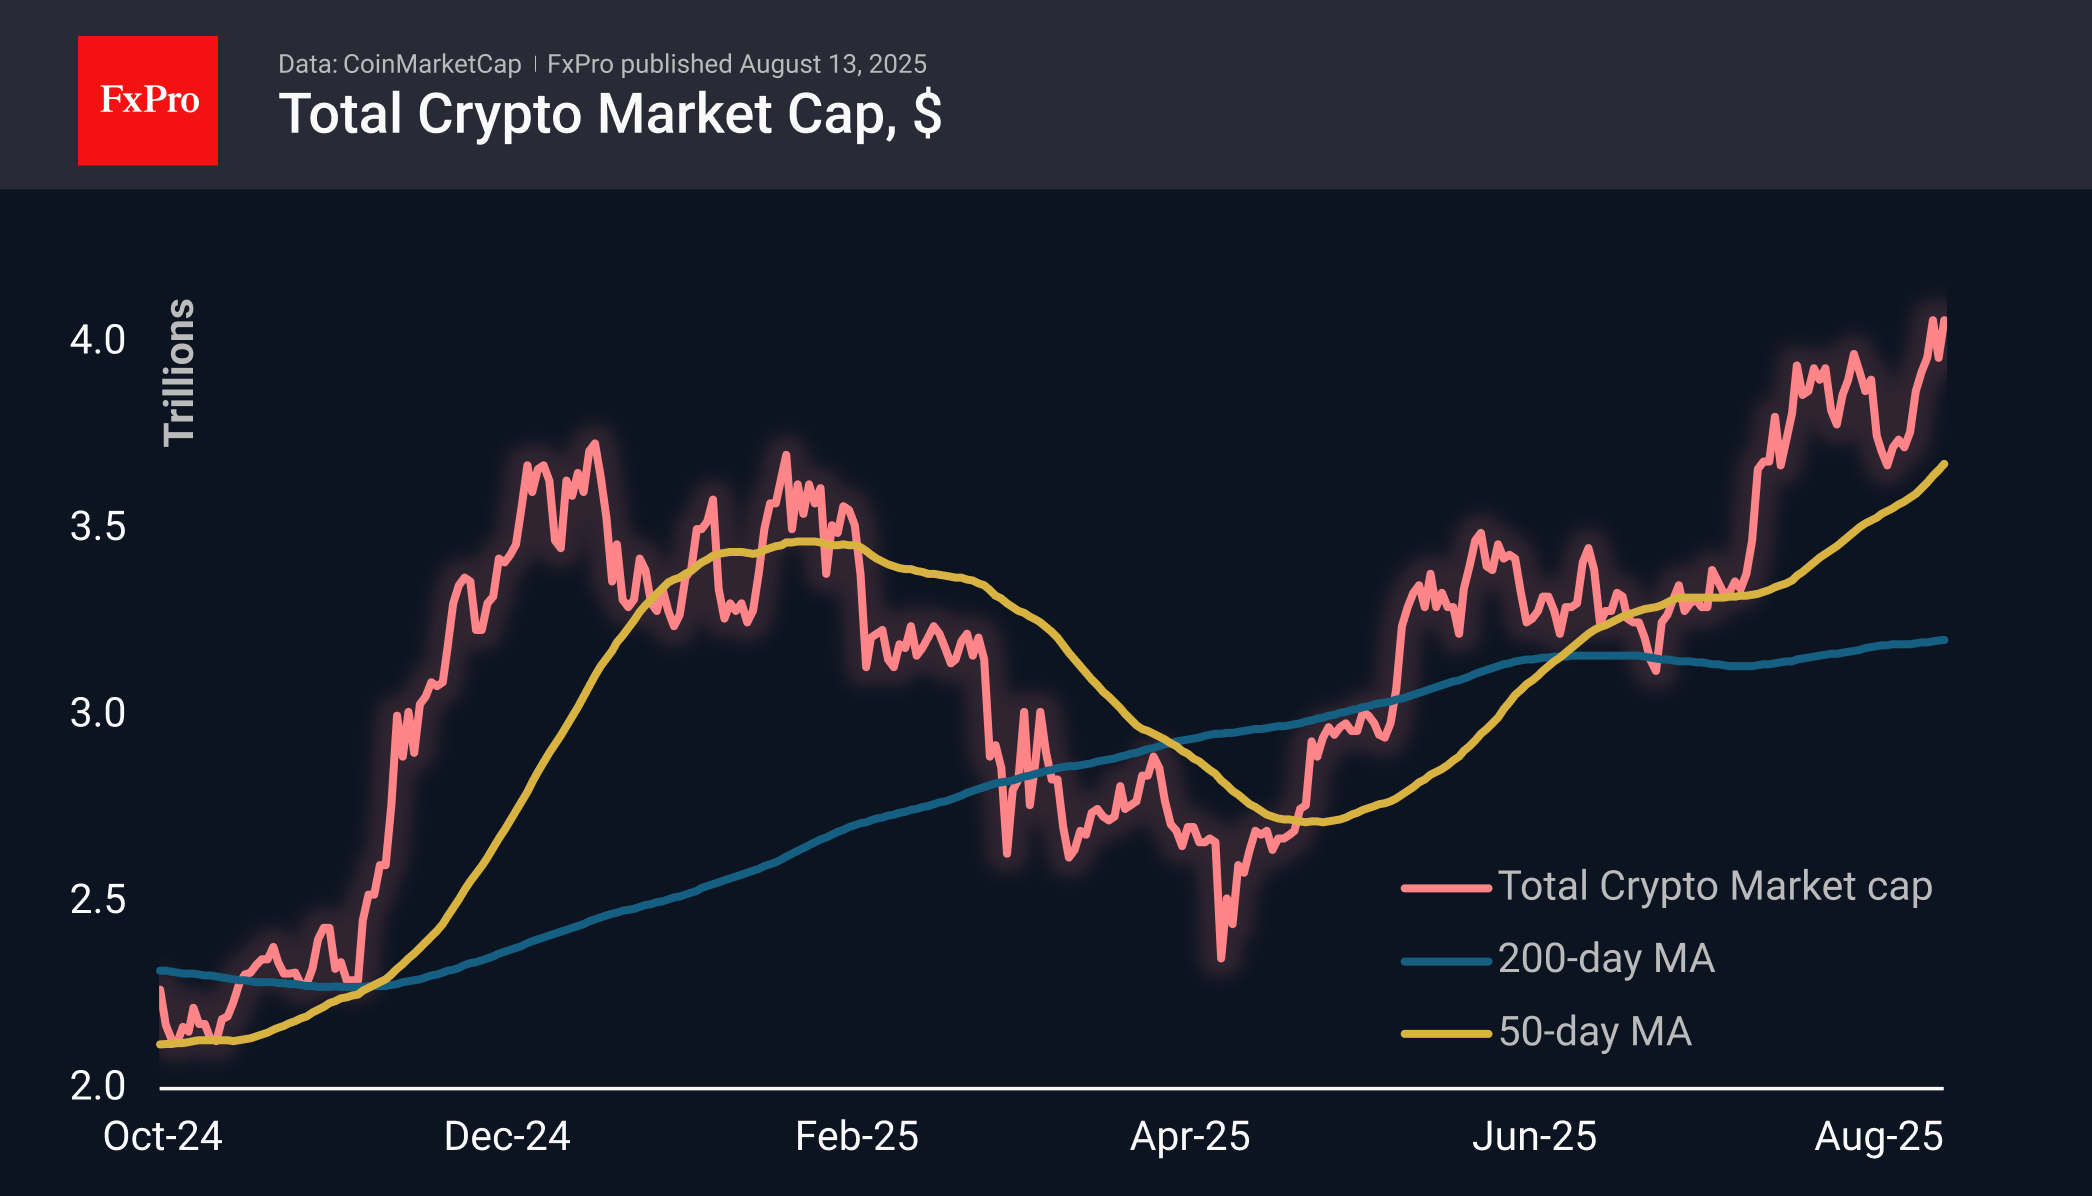
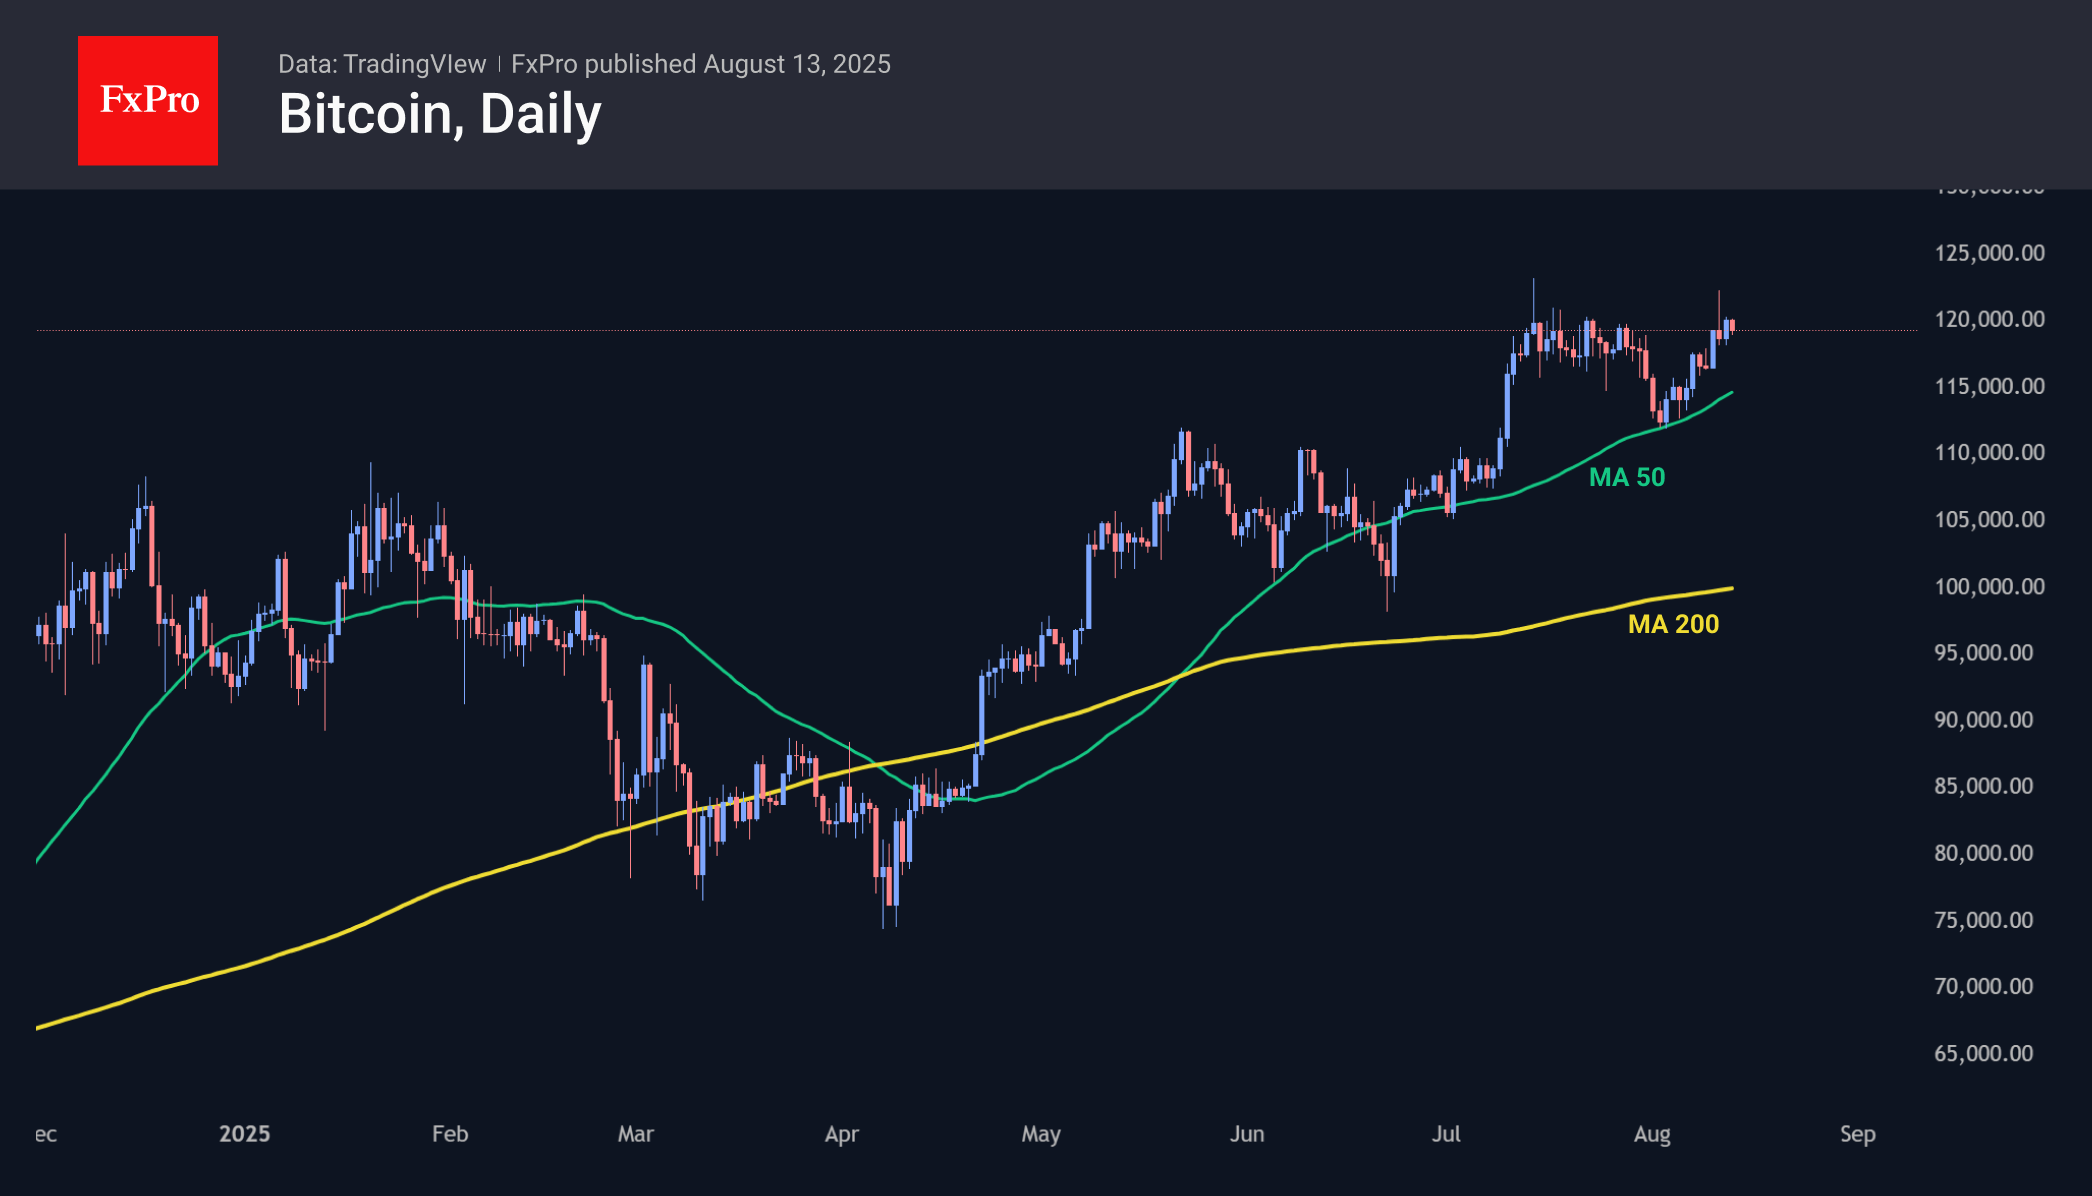
Bitcoin rose by a modest 0.4% during the day and remains 2% below the levels of 30 days ago — clear evidence of the market’s switch to altcoin-mode. We suspect that investors are selling the first cryptocurrency to finance purchases of altcoins. And it is hardly reasonable to talk about a reversal in sentiment, given the rally in altcoins and the historic highs of the S&P500 and Nikkei225.
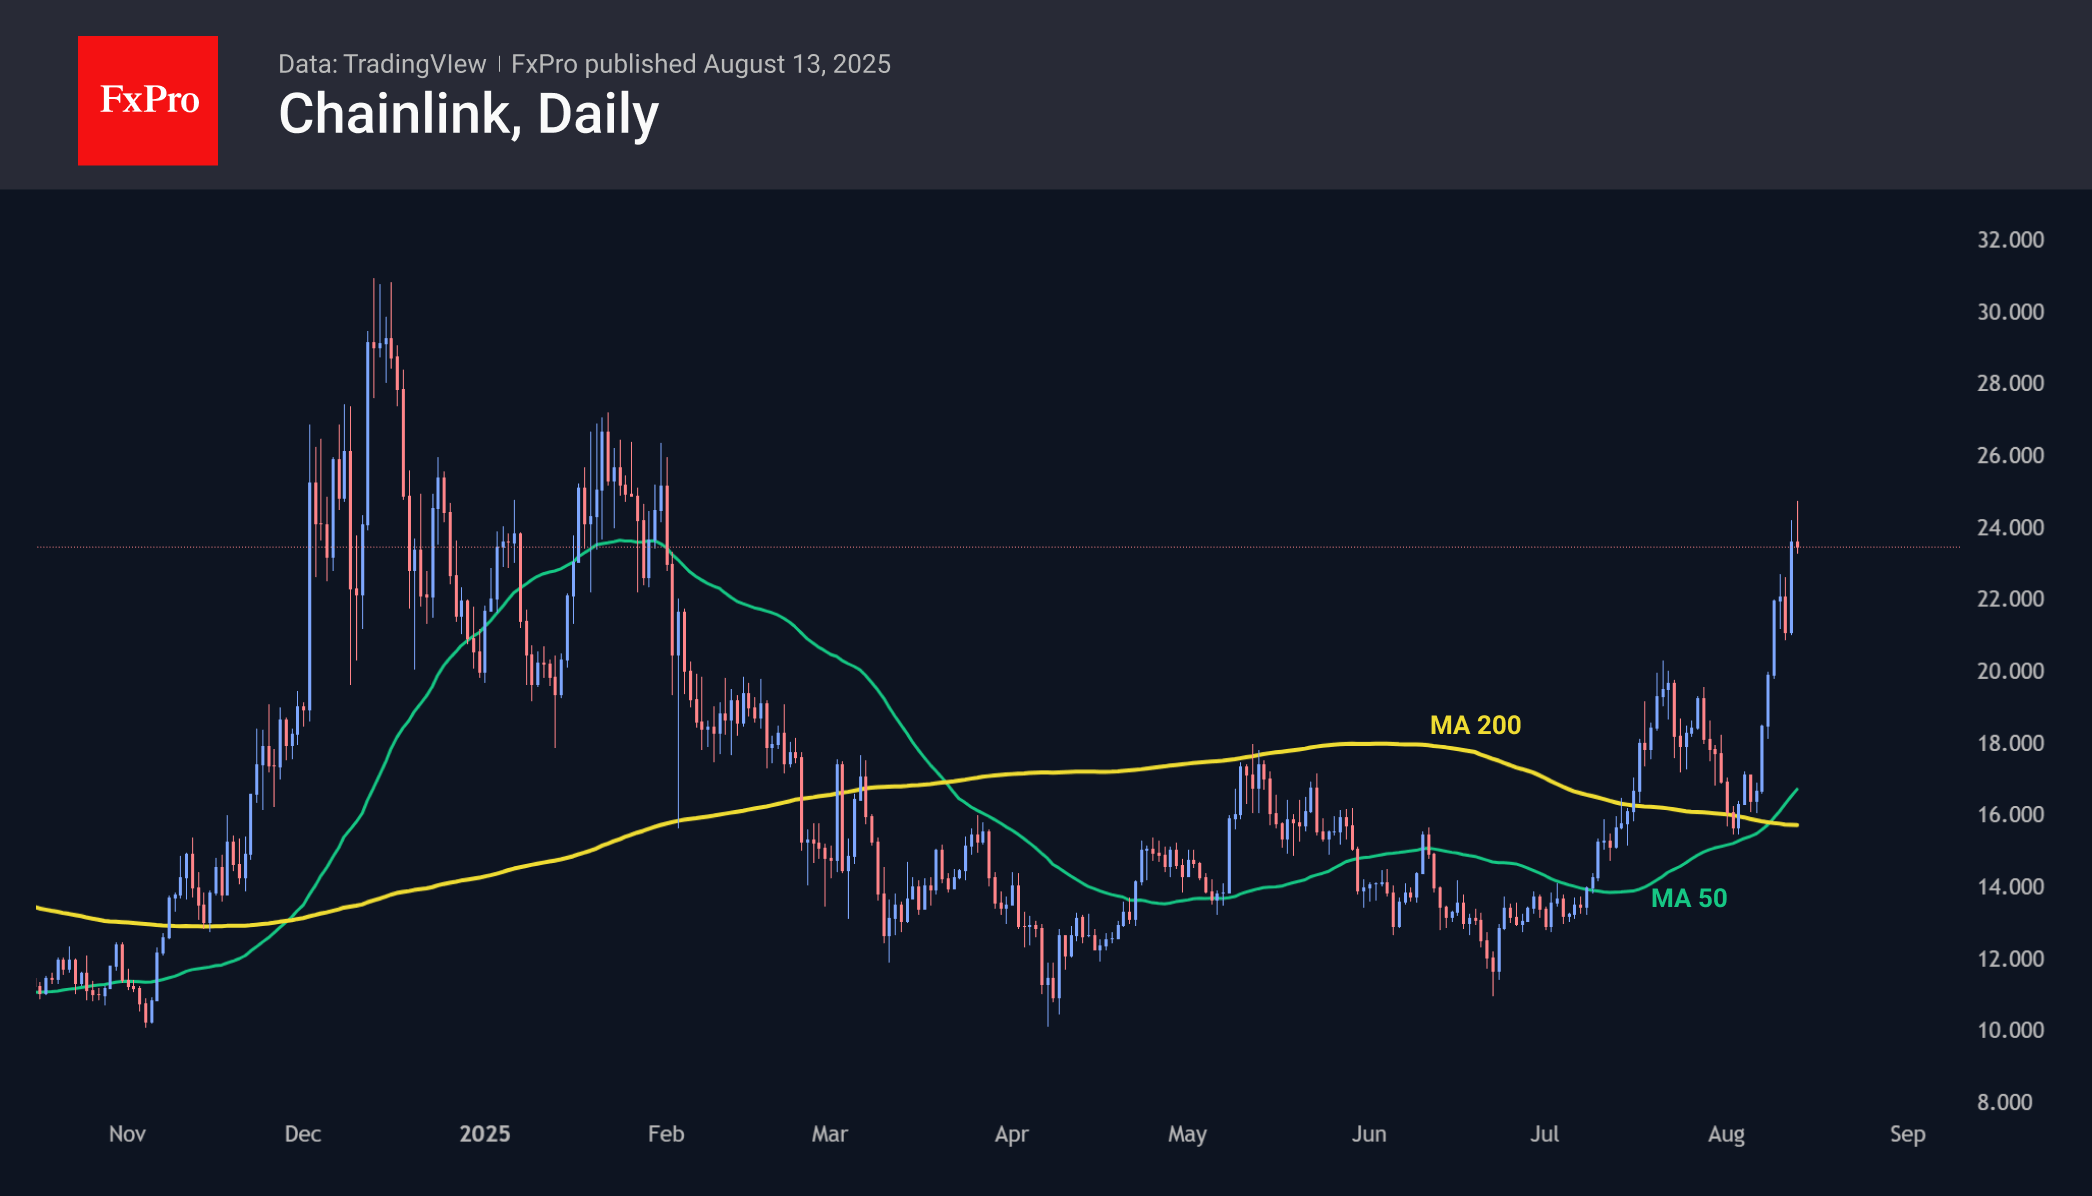
Chainlink, the 11th largest coin by market capitalisation, has shown impressive growth recently, gaining about 50% over the past seven days and more than doubling in price from its lows at the end of June. In terms of dynamics over the past few weeks, it is quite competitive with Ethereum. From current levels near $23.3, the bulls’ immediate targets appear to be the 2025 highs around $25, but it will take more than a doubling of the price to break through the historic highs of 2021.
According to SoSoValue, net inflows into BTC ETFs slowed to $178.2 million on 11 August. Total inflows since the approval of Bitcoin ETFs in January 2024 have reached $54.60 billion.
Inflows into spot Ethereum ETFs in the US jumped to a record $1.02 billion on 11 August. Total net inflows since the ETF’s launch in July 2024 have grown to $10.83 billion. The total assets under management by ETH ETFs rose to $25.71 billion, or 4.77% of Ethereum’s supply.
Mining company BitMine Immersion Technologies (BMNR) announced that it had raised an additional $20 billion to purchase Ethereum. BitMine was the first public company to accumulate more than 1 million ETH.
USDC issuer Circle announced the launch of its own first-level network, Arc, focused on stablecoins. The blockchain will be focused on financial transactions: payments, currency exchange, and capital markets.
Australian Dollar Extends Gains After Solid Wage Growth
The Australian dollar has extended its gains on Wednesday. In the European session, AUD/USD is trading at 0.6551, up 0.33% on the day. The Aussie is trading at its highest levels since July 28, as the US dollar is showing signs of weakness against the major crurrencies.
Australian wage growth steady at 3.4%
Australia's wage growth rose 3.4% y/y in the second quarter, unchanged from Q1 and just above the market estimate of 3.3%. Wages accelerated in both the public and private sectors, which accounted for the better-than-expected growth.
The labor market has been softening but wage growth still remains solid. The Reserve Bank of Australia is keeping an especially close eye on employment data, now that inflation is under control.
The RBA lowered rates on Tuesday in a widely expected decision. The central bank is sounding cautious about further rate cuts but a further deterioration in the labor market would likely force the RBA to change its tune and respond with a rate cut before the end of the year.
US CPI steady but core CPI rises
US inflation for July came in at 2.7% y/y, matching the June figure. However, core CPI surprised on the upside with a gain of 3.1%, up from 2.9% and above the market estimate of 3.0%.
A sharp drop in gasoline prices kept headline CPI in check but this was not a factor in core CPI, which excludes food and energy prices. The spike in core CPI was likely due to the effect of US tariffs, which are filtering through the economy and have raised the prices on goods imported to the US.
The inflation report has raised market expectations of a Fed rate cut in September. The markets have priced in a 96% probability of a cut, up from 84% just prior to Tuesday's inflation report.
AUD/USD Technical
- AUD/USD has pushed above resistance at 0.6528 and 0.6542 and is testing 0.6556. Above, there is resistance at 0.6596
- 0.6514 and 0.6500 are the next support levels
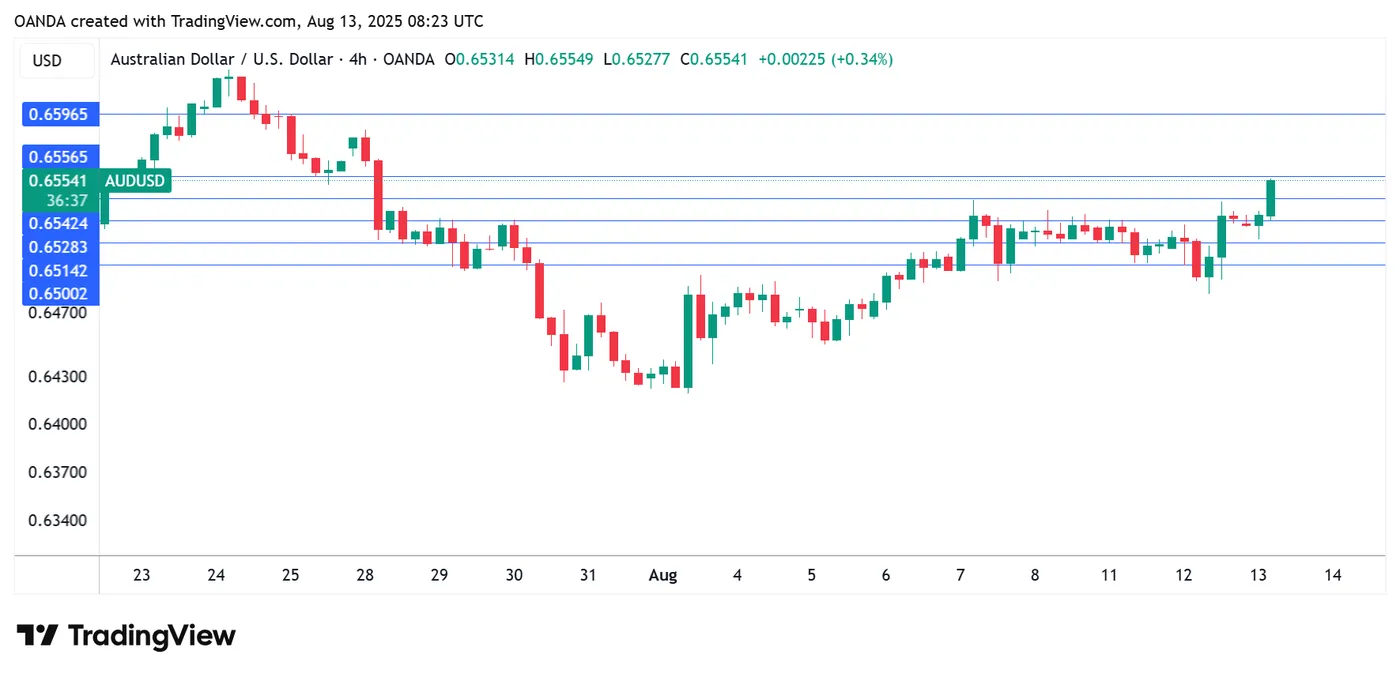
AUDUSD 1-Day Chart, Aug. 13, 2025
Elliott Wave Forecast: S&P 500 (SPX) Targets 6639 in Final Wave (5)
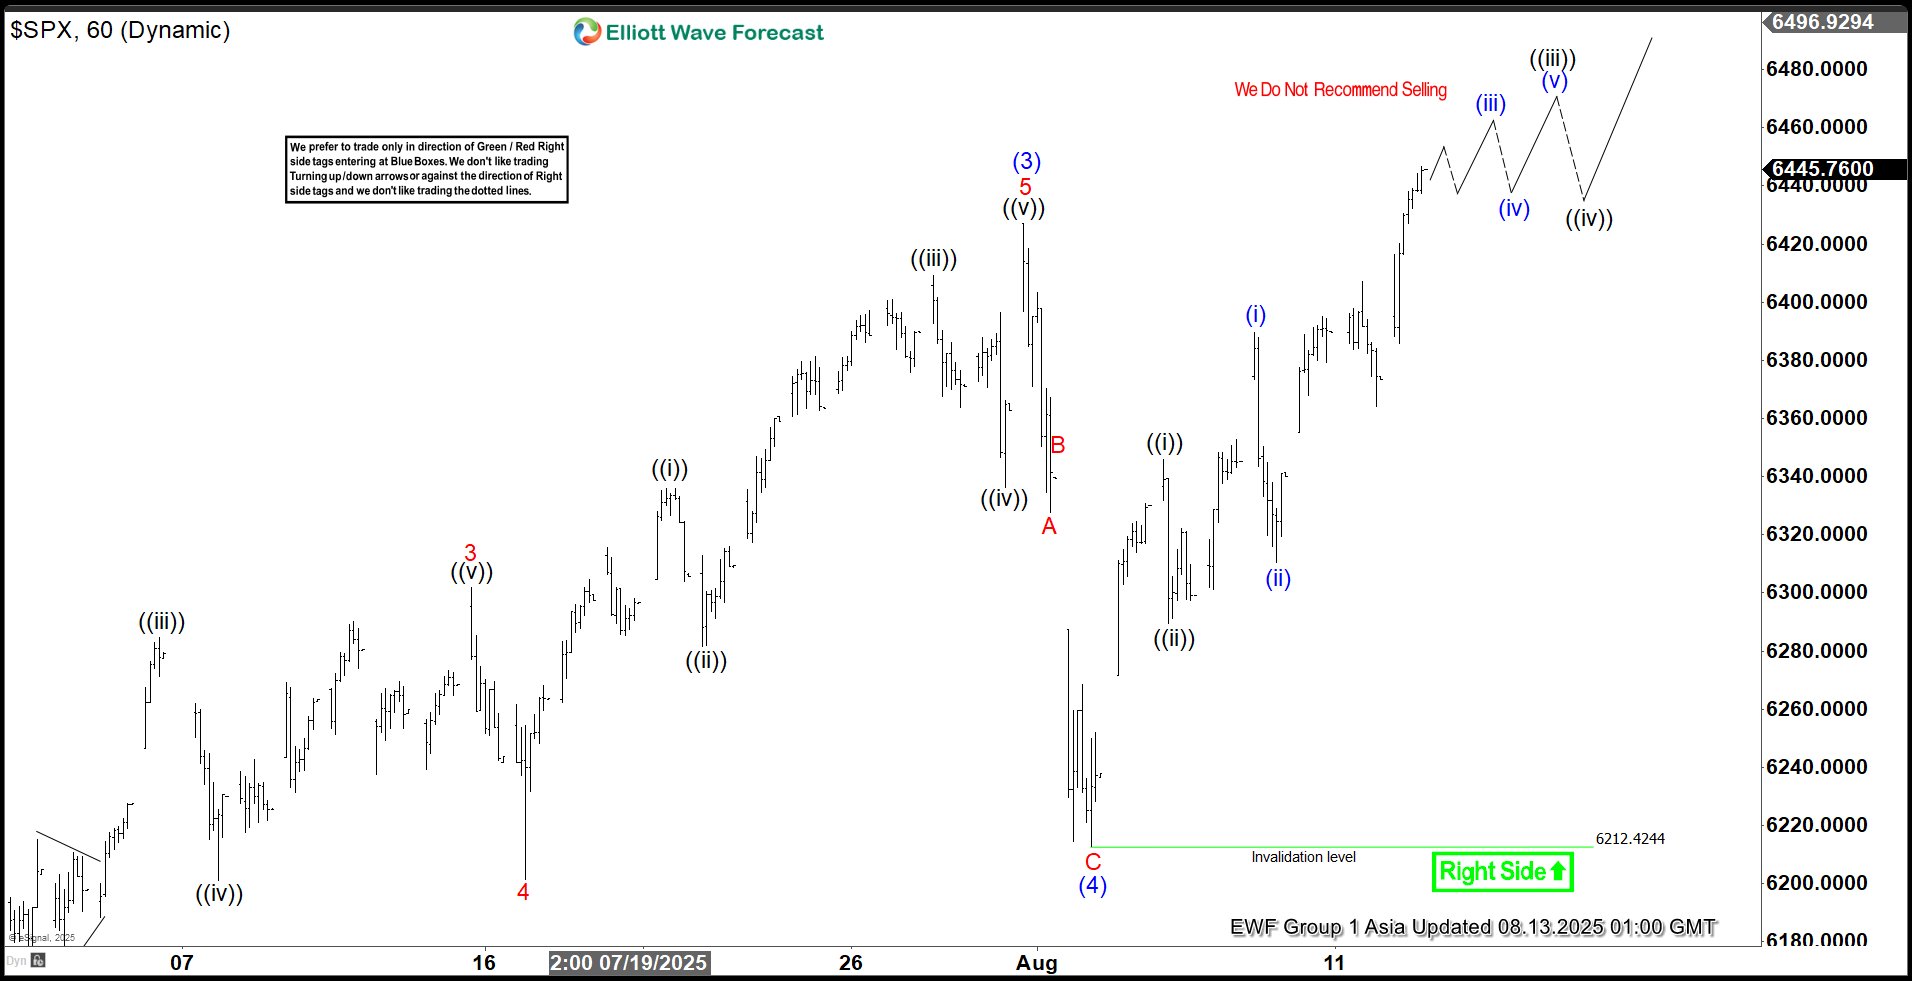
The Elliott Wave cycle, initiated at the April 7, 2025 low, is progressing as an impulse structure, driving the Index upward. Wave (1) reached a high of 5267.47, followed by a wave (2) pullback to 4910.42. The Index then surged in wave (3) to 6427.02, as depicted in the one-hour chart. A corrective wave (4) concluded at 6212.42, structured as a zigzag. Within this correction, wave A dropped to 6327.6, wave B climbed to 6339.89, and wave C finalized the decline at 6212.4, completing wave (4) in the higher degree.
The Index has since advanced in wave (5), breaking above the wave (3) peak of 6427.02, confirming the next upward move. This wave (5) is unfolding as a lower-degree impulse. From the wave (4) low, wave 1 hit 6346, and wave 2 corrected to 6289.37. The Index then nested higher, with wave ((i)) reaching 6389.7 and wave ((ii)) retracing to 6310.32. In the short term, anticipate a few more highs to complete wave 1 of (5). A pullback should follow to adjust the cycle from the August 2, 2025 low. As long as the 6212.4 pivot remains intact, the Index should continue climbing.
S&P 500 (SPX) – 60 Minute Elliott Wave Technical Chart:
SPX – Elliott Wave Technical Video:
https://www.youtube.com/watch?v=FvolcSX1aCo
Silver (XAG/USD) Technical: Medium-Term Up Trend Remains Intact, Start of New Bullish Impulsive Leg
Silver (XAG/USD) has staged the expected rally of 7.1% from 18 June 2025 to hit the predefined resistance of US$39.08 (printed a 14-year high of US$39.53 on 23 July) before it staged a corrective decline of -8.39% to hit an intraday low of US$36.21 on 31 July 2025.
Let’s now examine its latest medium-term multi-week directional bias from a technical analysis perspective.
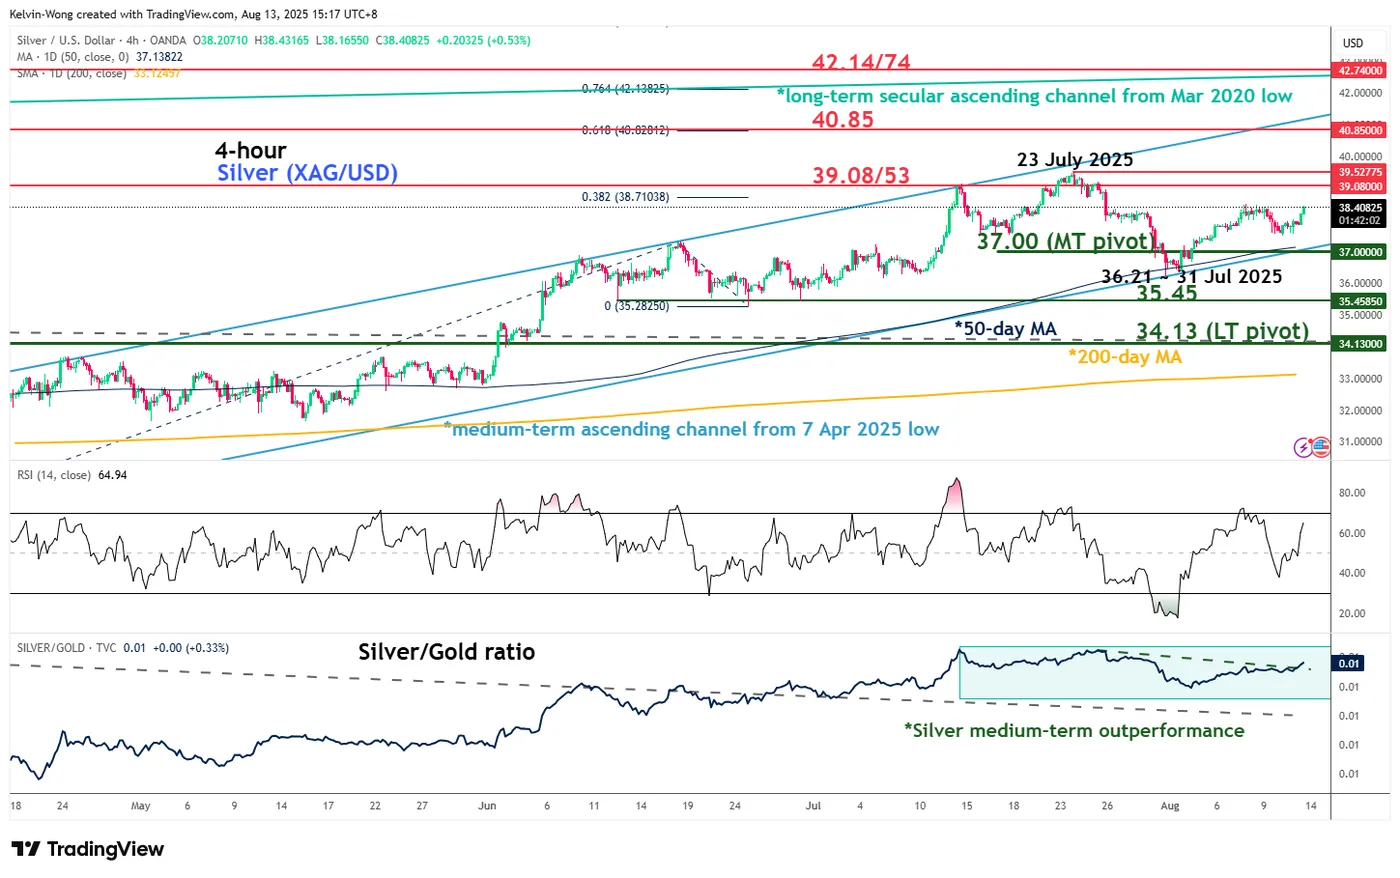
Fig. 1: Silver (XAG/USD) medium-term trend as of 13 Aug 2025 (Source: TradingView)
Preferred trend bias (1-3 weeks)
The minor corrective decline from the 23 July 2025 high is likely to have ended, and Silver (XAG/USD) is likely in the process of shaping a potential new bullish impulsive upmove sequence within its medium-term and major uptrend phases.
Bullish bias with key medium-term pivotal support at US$37.00 and a clearance above US$39.53 sees the next medium-term resistances coming in at US$40.85 (Fibonacci extension and upper boundary of medium-term ascending channel from 7 April 2025 low) and US$42.14/42.74 (Fibonacci extension and upper boundary of long-term secular ascending channel from March 2020 low)
Key elements
- The 31 July 2025 low of US$36.21 confluences with the 50-day moving average and the lower boundary of the medium-term ascending channel from the 7 April 2025 low.
- The 4-hour RSI momentum indicator has continued to exhibit a bullish momentum condition and has not reached its overbought region (above 70 level).
- The relative strength chart of the Silver/Gold ratio has continued to trend steadily upwards since 4 August 2025, which suggests further medium-term outperformance of Silver against Gold.
Alternative trend bias (1 to 3 weeks)
A break below the US$37.00 key support invalidates the bullish scenario to kickstart another corrective decline sequence to expose the next medium-term support at US$35.45, and below it triggers a deeper slide to test the US$34.13 long-term pivotal support.