Sample Category Title
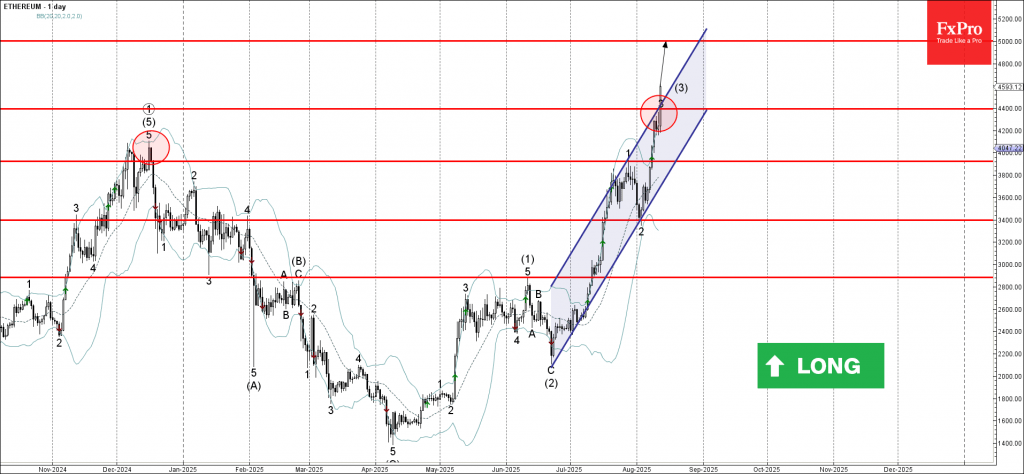
Ethereum Wave Analysis
Ethereum: ⬆️ Buy
- Ethereum rising inside impulse wave (3)
- Likely to rise to resistance level 5000.00
Ethereum continues to rise inside the sharp upward impulse wave (3), which previously broke the resistance zone between the resistance level 4400.00 and the resistance trendline of the daily up channel from June.
The breakout of this resistance zone strengthened the bullish pressure on Ethereum – accelerating the active impulse wave (3).
Ethereum can be expected to rise further to the next round resistance level 5000.00, target price for the completion of the active impulse wave (3).
Fed’s Schmid: Holding rates steady is deliberate, not passive wait-and-see
Kansas City Fed President Jeffrey Schmid said in a speech today that with the economy still showing momentum, business optimism rising, and inflation remaining above Fed’s 2% goal, it is appropriate to keep monetary policy “modestly restrictive” for now.
Schmid noted that while higher tariffs appear to have had only a limited effect on inflation so far, he sees this as a reason to maintain the current policy stance rather than an opportunity to ease.
He stressed that his view is not a “wait-and-see” approach but rather a data-backed assessment of the need to stay restrictive. In conversations with business contacts, Schmid said growth remains solid and inflation “too high,” reinforcing his position that policy should not be loosened yet.
Fed’s Barkin sees risks for inflation and jobless rate to climb simultaneously
Speaking today, Richmond Fed President Thomas Barkin said recent policy developments — including a major tax bill, immigration changes, and the completion of key tariff and trade negotiations — have lifted much of the “fog” around the economic outlook. What happens next, he said, will hinge on how households respond to potential price increases from tariffs.
Barkin pointed to evidence that consumers are front-loading purchases of goods while cutting back on services, a pattern that, if sustained, could limit tariff-driven inflation. "If we see this kind of demand destruction more broadly, the inflationary impact of tariffs would be less than many anticipate," Barkin said.
If such shifts in spending occur more broadly, however, he said, "businesses will see volumes drop and margins squeezed. They will look for costs to cut. Employment could take a hit as a result".
"We may well see pressure on inflation, and we may also see pressure on unemployment, but the balance between the two is still unclear," he said. "As the visibility continues to improve, we are well positioned to adjust our policy stance as needed."
Sunset Market Commentary
Markets
So far it’s a slow burn, rather than a big bang when it comes to the feared inflationary impact from US President Trump’s trade policy. Monthly headline and core US CPI inflation printed bang in line with expectations at respectively +0.2% M/M and +0.3% M/M. Annual reading showed a stabilization on the overall level (2.7% Y/Y) and an increase from 2.9% Y/Y to 3.1% Y/Y for the core gauge (matching highest level since January 2025). Core goods prices excluding new vehicles and used cars and trucks rose by 0.22% M/M, less than half the 0.55% M/M pace in June (highest since early 2022) which worried some about the potential tariff-impact. Categories like household furnishing (0.7% M/M), video and audio products (0.8% M/M) or apparel (0.1% M/M) all in all showed less than feared price increases. With two out of “three critical Summer CPI reports” (dixit Fed Chair Powell) out of the way, markets become more confident that the Fed will pull the policy normalization card when it meets next in September. First as the feared inflationary impact from tariffs remains modest. Second as activity and labour market data point to growing downside risks to the Fed’s maximum employment mandate. For the record, we must add that the supercore services gauge – stripping out energy, food, goods and housing-related costs; hyped throughout and in the aftermath of the pandemic – rose by 0.48% M/M (second highest in 16 months), lifting the Y/Y-measure to 3.21%. US Treasuries initially rallied with the front end of the curve outperforming. Daily changes on the US curve currently vary between -2.7 bps (2-yr) and +1.8 bps (30-yr). EUR/USD spiked from the 1.16 area to 1.1650, before pulling back to 1.1625. US stock markets opened 0.50% higher. A September 25 bps Fed rate cut is now nearly fully discounted. If activity data continue to disappoint in coming weeks, we err on the side of money markets starting to contemplate the possibility of the Fed pulling a 50 bps rate cut like they did in September of last year.
We didn’t see any specific trigger, but notice an underperformance of very long German Bunds and UK gilts (both curves bear steepening) in the aftermath of the CPI release. The German 30-yr yield adds 6 bps, taking out the 2023 & 2025 highs at 3.26% to trade at the highest level since 2011. The UK 30-yr yield goes 8.2 bps higher (5.47% vs YTD top around 5.60%).
News & Views
German ZEW investor sentiment (expectations) decreased markedly in August (34.7 from 52.7 vs 39.5 expected). The assessment of the current economic situation deteriorated as well, falling from -59.5 to -68.6 (vs -67 consensus). ZEW President Wambach said that financial market experts are disappointed about the announced EU-US trade deal. The German economy’s poor performance in the second quarter of the year played a role as well. The outlook worsened in particular for the chemical and pharmaceutical industries. Mechanical engineering, metal sectors as well as the automotive industry are also severely affected. Although initial growth estimates for the eurozone were better than those for Germany in the second quarter of 2025, these expectations have also been revised downwards for the monetary union (25.1 from 36.1).
Indian inflation (0.93% M/M) fell below the lower bound of the 2 percentage points interval around the 4% inflation target for the first time in 8 years. A continued decline in food prices which make up half of the CPI basket was responsible for the 1.55% Y/Y headline print (down from 2.1% in June). Food prices rose by 2.03% on a monthly basis, but fell by 1.76% compared with a year ago. Core inflation slowed from 4.7% Y/Y to 4.4% Y/Y and supports the case for a rate cut by the Reserve Bank of India when it meets on October 1st. Last week, the RBI held its policy rate unchanged at 5.5%, referring to a marginal rise in core inflation as part of the rationale. The central bank voted unanimously to keep its neutral policy stance while trimming the inflation forecast for fiscal 2026 3.1% from 3.7% while retaining the growth outlook at 6.5%. The Indian rupee trades near weakest levels on record (USD/INR) with stacked tariffs (direct from the US & linked to Russian oil imports) hurting sentiment.
US: Core Inflation Gathers Further Momentum in July
The Consumer Price Index (CPI) rose 0.2% in July, in line with the consensus forecast in Bloomberg and a tick lower than June. On a twelve-month basis, CPI was up 2.7% (unchanged from the month prior).
- Energy costs (-1.1% m/m) more than reversed June's gain, while food prices were flat on the month as a gain in 'food away from home' (+0.3% m/m) was offset by a decline in 'food at home' (-0.1% m/m). On a year-ago basis, food prices were up 2.9%.
Excluding food and energy, core inflation rose 0.3% m/m – also in line with consensus forecast – and a tick faster than the month prior. The twelve-month change edged higher to 3.1% (from 2.9% in June).
- Services prices rose 0.4% m/m, up from June's 0.3% m/m. Primary shelter costs rose 0.3% m/m, while price growth for non-housing services were up 0.5% m/m – its strongest monthly gain since January.
There was considerable breadth underpinning the uptick in non-housing services. Travel costs (+0.7% m/m) turned higher after five consecutive months of declines. This was due to a sharp rebound in airfares (+4.0% m/m) which more than offset declines in car rentals (-2.9% m/m) and a further pullback in hotel costs (-1.0% m/m). Meanwhile, price growth for recreational (+0.4% m/m), medical (+0.8% m/m) and other personal services (+0.6% m/m) also heated up.
Core goods prices rose 0.2% m/m, led by continued strength in home furnishings (+0.7% m/m), while most other goods categories saw more mild gains.
Key Implications
Core inflation gathered further momentum in July, rising by its fastest monthly pace since January and pushing the year-on-year measure back above 3%. Tariff passthrough continued to pressure goods prices higher with the breadth of categories now seeing price gains over the last three-months rising to 64% or the highest level since April 2023. But unlike prior months, firming goods prices were not offset by cooling services. This trend is likely to continue through year-end, keeping sustained upward pressure on core measures of inflation.
Policymakers will face some tough choices over the coming months. While inflationary pressures are heating up, the labor market has shown clear signs of weakening. With the policy rate still well in restrictive territory and inflation expectations remaining well anchored, the prudent move for the Fed is to prioritize the employment side of its dual mandate and provide some rate relief in the months ahead. We see three quarter-point cuts by year-end, bringing the policy rate down to 3.75%.
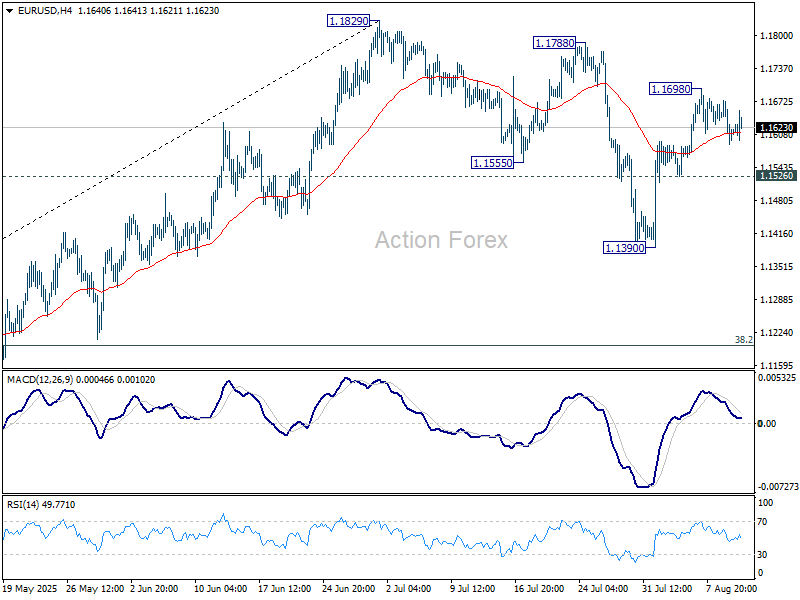
EUR/USD Mid-Day Outlook
Daily Pivots: (S1) 1.1578; (P) 1.1628; (R1) 1.1665; More...
Intraday bias in EUR/USD remains neutral as range trading continues below 1.1698. Outlook is unchanged that correction from 1.1829 should have completed with three waves down to 1.1390. Above 1.1698 will bring retest of 1.1829. However, break of 1.1526 support will dampen this bullish view and bring deeper fall back to 1.1390 instead.
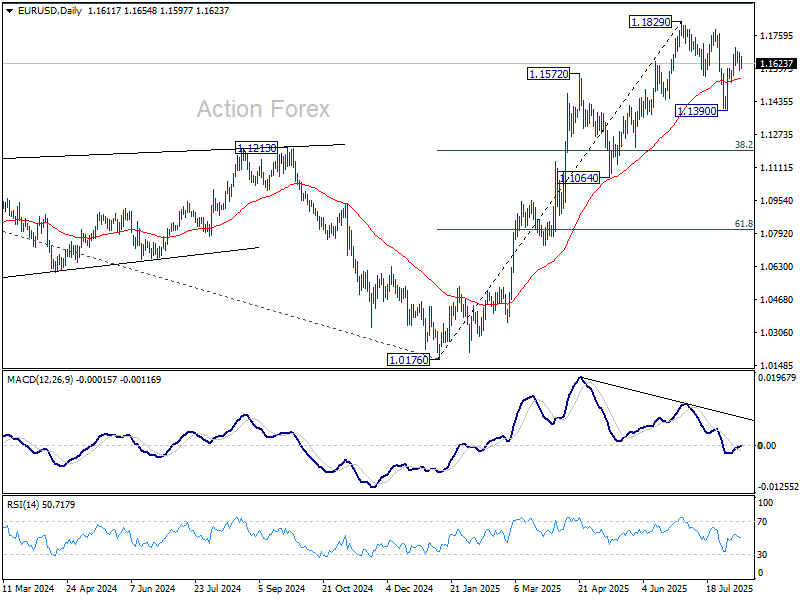
In the bigger picture, rise from 0.9534 long term bottom could be correcting the multi-decade downtrend or the start of a long term up trend. In either case, further rise should be seen to 100% projection of 0.9534 to 1.1274 from 1.0176 at 1.1916. This will remain the favored case as long as 1.1604 support holds.
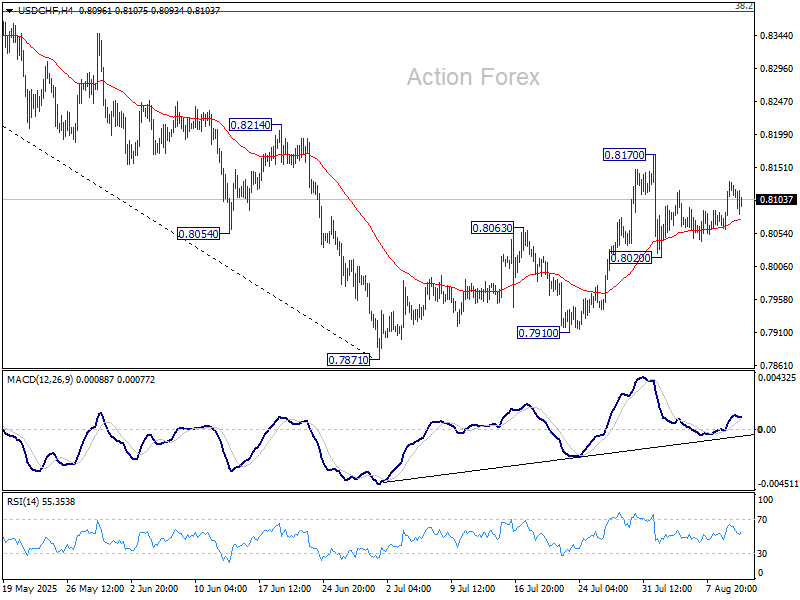
USD/CHF Mid-Day Outlook
Daily Pivots: (S1) 0.8079; (P) 0.8106; (R1) 0.8150; More….
Intraday bias in USD/CHF remains neutral for the moment. On the upside, firm break of 0.8710 will resume the corrective from 0.7871. Intraday bias will be back on the upside for 38.2% retracement of 0.9200 to 0.7871 at 0.8379. On the downside, though, break of 0.8020 will revive that case that the corrective pattern has completed, and target a retest on 0.7871 low.
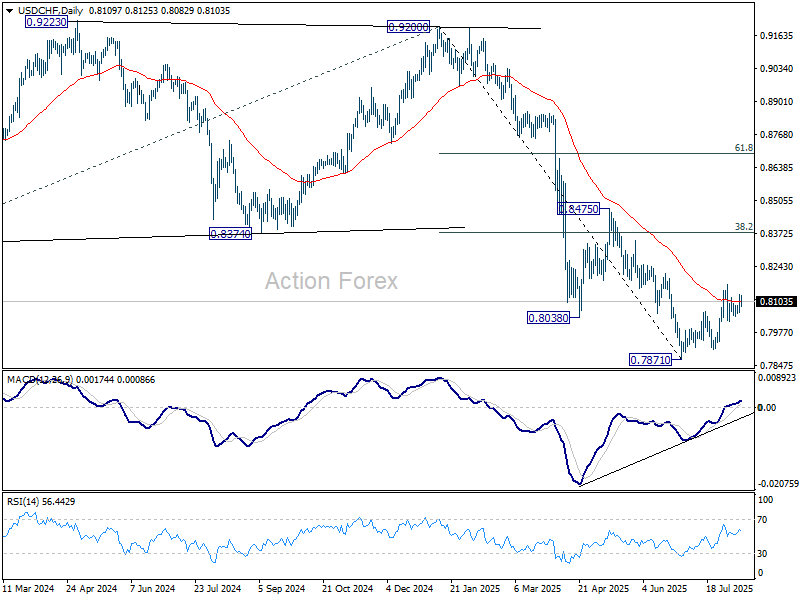
In the bigger picture, long term down trend from 1.0342 (2017 high) is still in progress. Next target is 100% projection of 1.0146 (2022 high) to 0.8332 from 0.9200 at 0.7382. In any case, outlook will stay bearish as long as 0.8475 resistance holds.
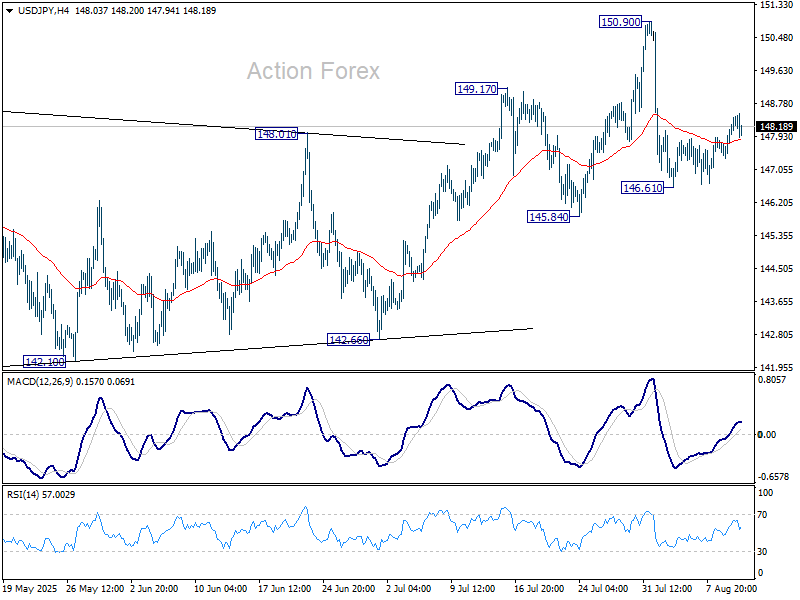
USD/JPY Mid-Day Outlook
Daily Pivots: (S1) 147.58; (P) 147.91; (R1) 148.48; More...
Intraday bias in USD/JPY stays mildly on the upside for the moment. Pullback from 150.90 could have completed at 146.61 already. Further rise would be seen to retest 150.90. Firm break there will resume the whole rally from 139.87 to 151.22 fibonacci level. For now, risk will stay on the upside as long as 146.61 support holds, in case of retreat.
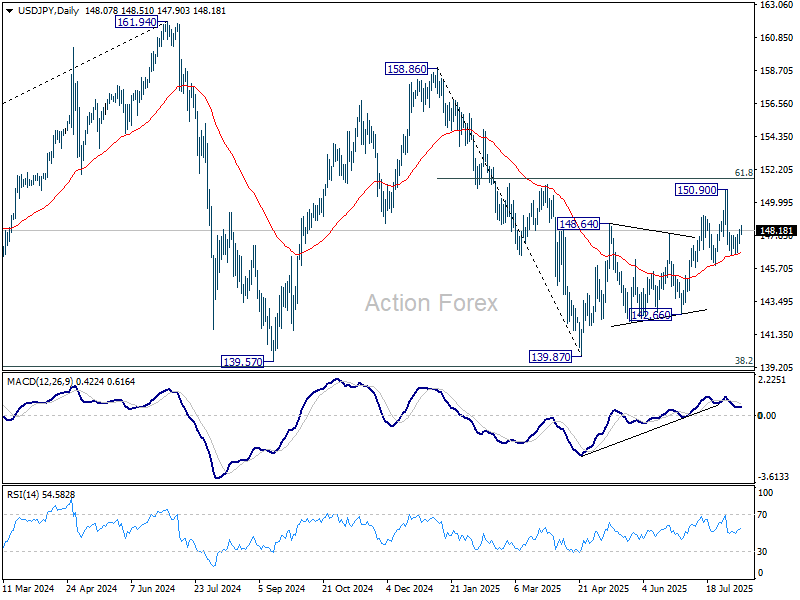
In the bigger picture, price actions from 161.94 (2024 high) are seen as a corrective pattern to rise from 102.58 (2021 low). Decisive break of 61.8% retracement of 158.86 to 139.87 at 151.22 will argue that it has already completed with three waves at 139.87. Larger up trend might then be ready to resume through 161.94 high. In case the corrective pattern extends with another fall, strong support is expected from 38.2% retracement of 102.58 to 161.94 at 139.26 to bring rebound.
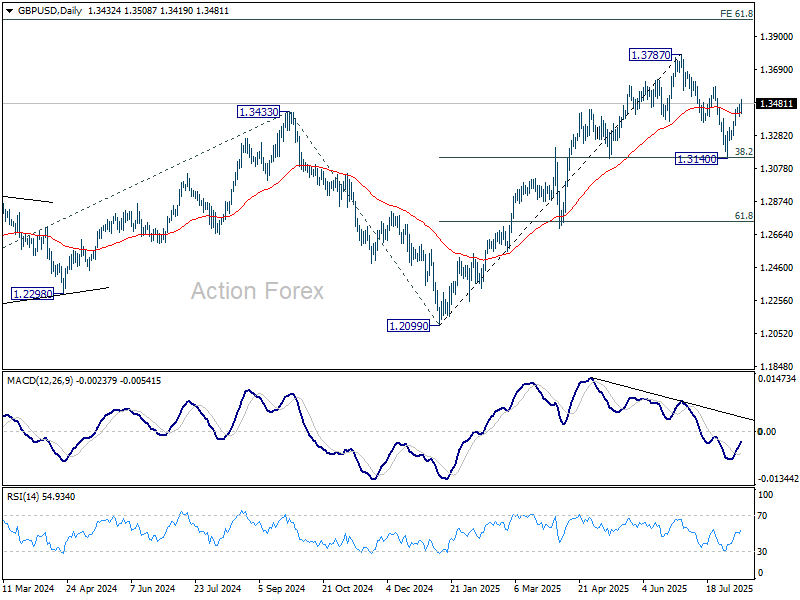
GBP/USD Mid-Day Outlook
Daily Pivots: (S1) 1.3396; (P) 1.3436; (R1) 1.3473; More...
GBP/USD's rise from 1.3140 resumed after brief retreat and intraday bias is back on the upside for 1.3587 resistance. Correction from 1.3787 should have completed with three waves down to 1.3140. Firm break of 1.3587 will bring retest of 1.3787 high. On the downside, below 1.3398 minor support will turn intraday bias neutral and dampen the bullish case.
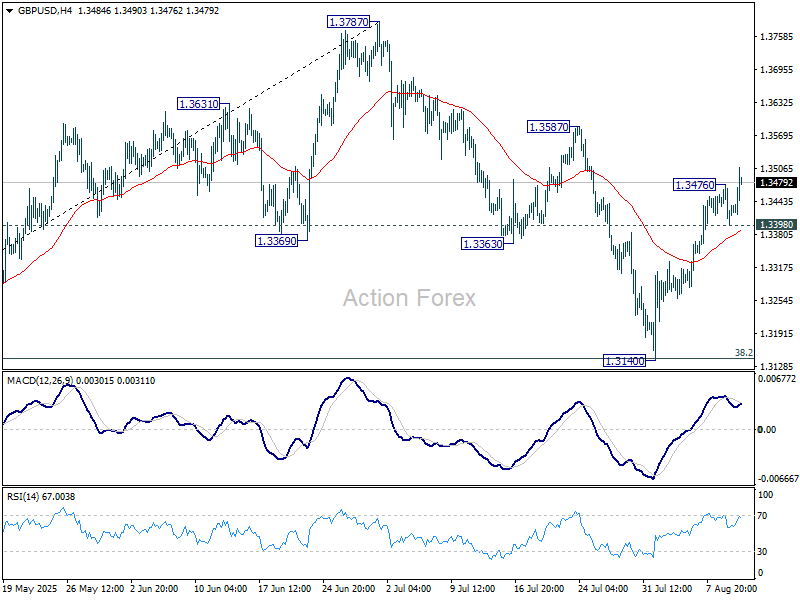
In the bigger picture, up trend from 1.3051 (2022 low) is in progress. Next medium term target is 61.8% projection of 1.0351 to 1.3433 from 1.2099 at 1.4004. Outlook will now stay bullish as long as 55 W EMA (now at 1.3068) holds, even in case of deep pullback.