Sample Category Title
EUR/JPY Daily Outlook
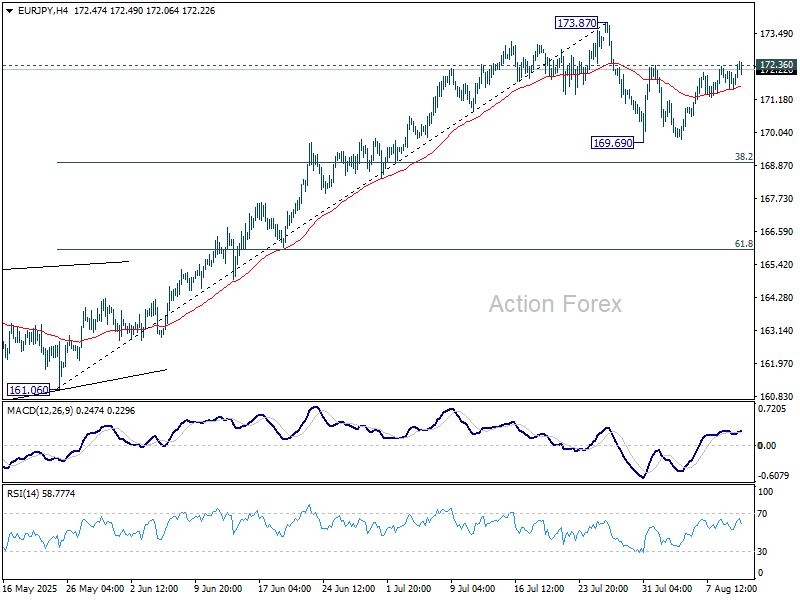
Daily Pivots: (S1) 171.68; (P) 171.94; (R1) 172.34; More...
Intraday bias in EUR/JPY remains neutral with focus on 172.36 resistance. Sustained trading above there will bring retest of 173.87 first. Firm break there will resume larger rally from 154.77 to retest 175.41 high. While corrective pattern from 173.87 might extend lower, downside should be contained by 38.2% retracement of 161.06 to 173.87 at 168.97 to bring rebound.
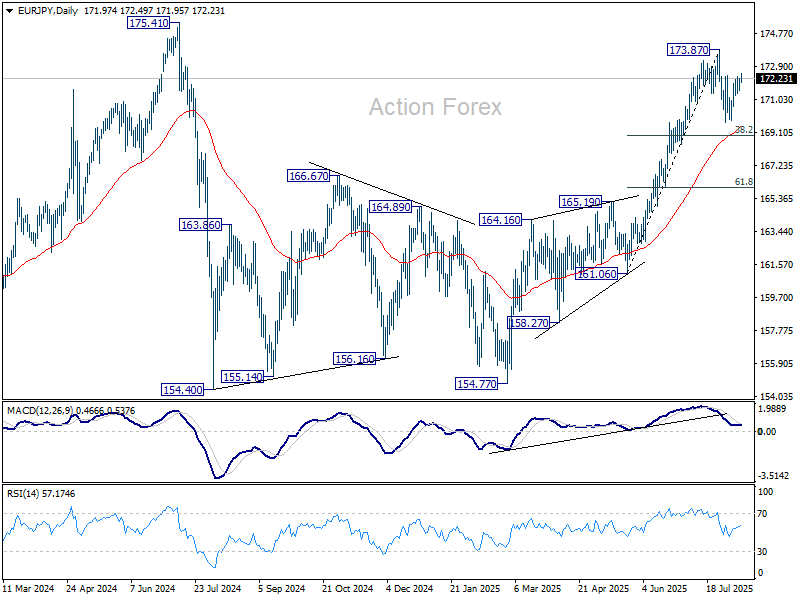
In the bigger picture, considering current strong momentum as seen in the rally from 154.77, corrective pattern from 175.41 could have already completed. Decisive break of 154.77 will confirm long term up trend resumption. Next target is 61.8% projection of 124.37 to 175.41 from 154.77 at 186.31. However, rejection by 175.41, followed by firm break of 55 D EMA (now at 169.27) will delay this bullish case.
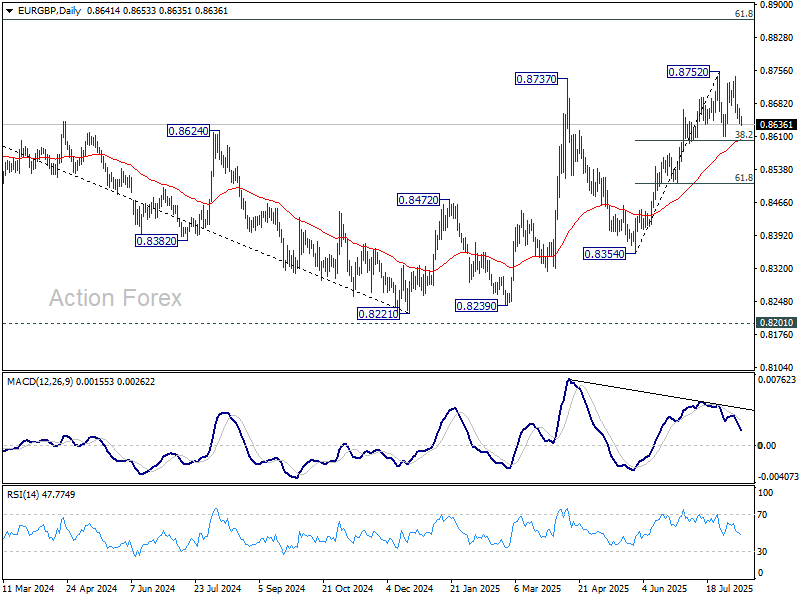
EUR/GBP Daily Outlook
Daily Pivots: (S1) 0.8636; (P) 0.8654; (R1) 0.8667; More...
No change in EUR/GBP's outlook as consolidations continue below 0.8752 short term top. Intraday bias stays neutral. Downside should be contained by 38.2% retracement of 0.8354 to 0.8752 at 0.8600. On the upside, firm break of 0.8752 will resume the rise from 0.8354 towards 0.8867 fibonacci level.
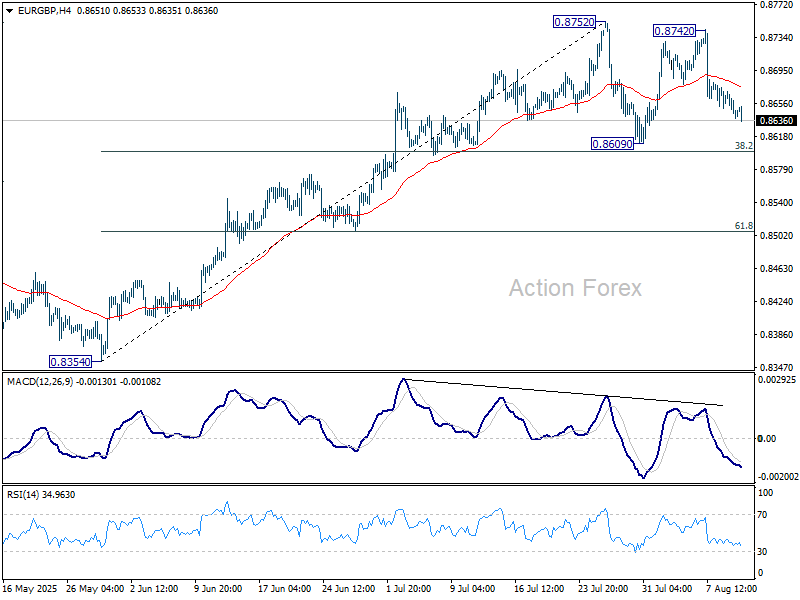
In the bigger picture, the structure from 0.8221 medium term bottom are not impulsive enough to suggest that it's reversing the down trend from 0.9267 (2022 high). But even if it's a correction, further rise is expected to 61.8% retracement of 0.9267 to 0.8221 at 0.8867. This will remain the favored case as long as 55 W EMA (now at 0.8497) holds.
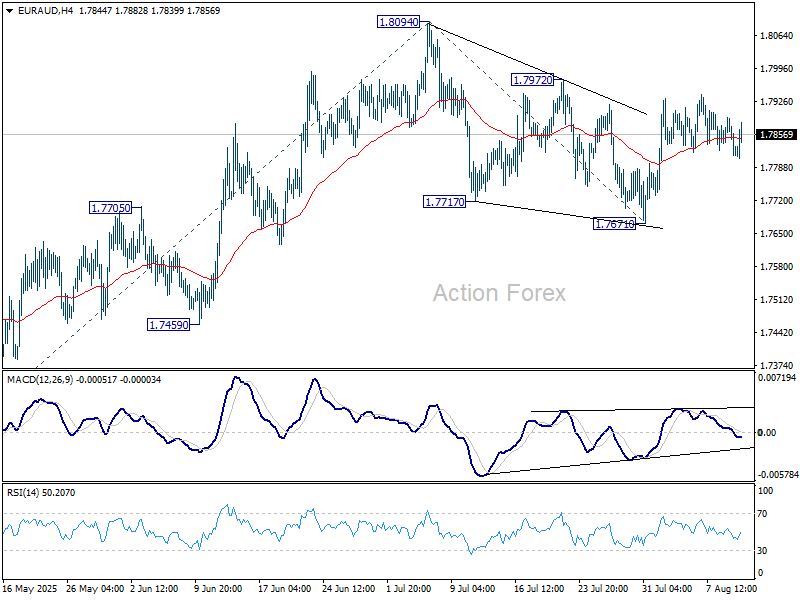
EUR/AUD Daily Outlook
Daily Pivots: (S1) 1.7801; (P) 1.7849; (R1) 1.7881; More...
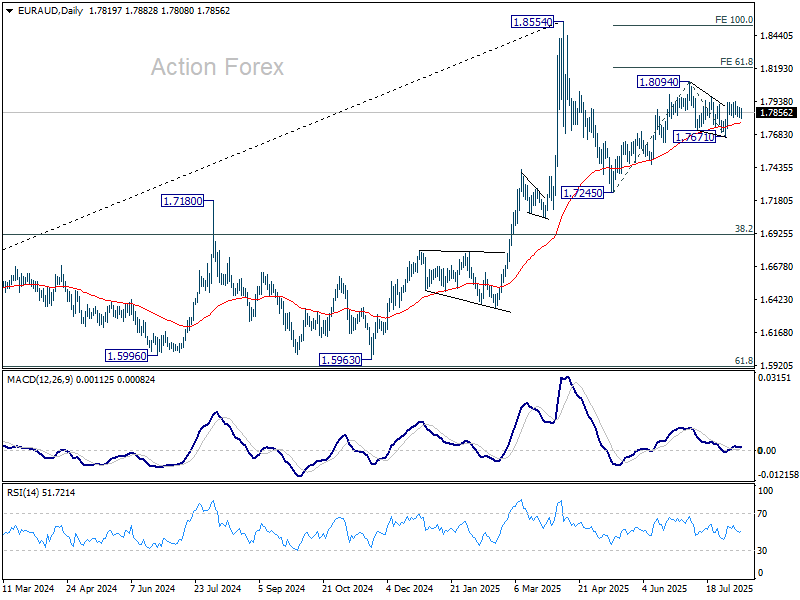
Intraday bias in EUR/AUD remains neutral for the moment as sideway trading continues. On the upside, firm break of 1.7972 resistance should confirm that corrective pattern from 1.8094 has completed at 1.7671. Further rise should then be seen through 1.8094, to resume the rebound from 1.7245. Next target is 61.8% projection of 1.7245 to 1.8094 from 1.7671 at 1.8196. On the downside, below 1.7671 will bring deeper fall back to 1.7459 support instead.
In the bigger picture, price actions from 1.8554 medium term top are seen as a corrective pattern. Such pattern could extend further with another falling leg. But even in that case, downside should be contained by 38.2% retracement of 1.4281 (2022 low) to 1.8554 at 1.6922 to bring rebound. Uptrend from 1.4281 is expected to resume at a later stage.
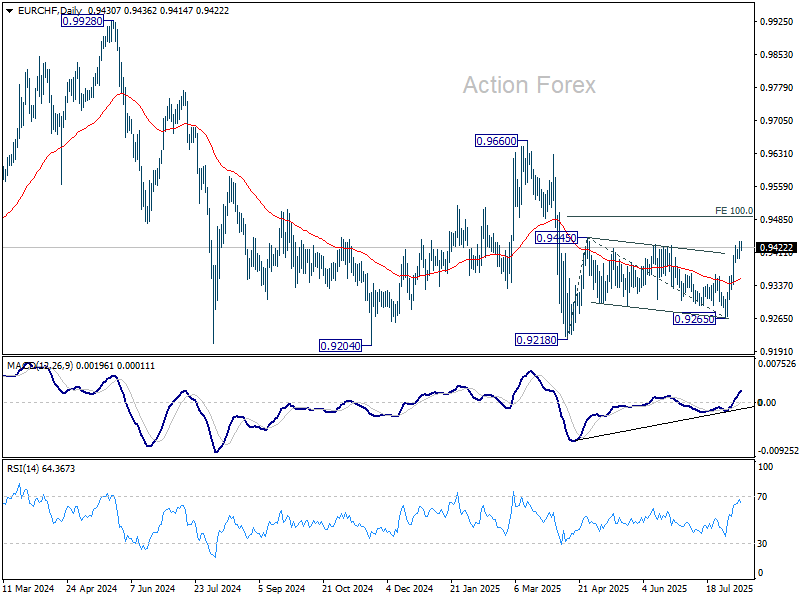
EUR/CHF Daily Outlook
Daily Pivots: (S1) 0.9410; (P) 0.9424; (R1) 0.9452; More....
EUR/CHF's rally resumed after brief retreat and intraday bias is back on the upside. Decisive break of 0.9445 resistance will resume the whole rebound from 0.9218. Next target is 100% projection of 0.9218 to 0.9445 from 0.9265 at 0.9492. On the downside, though, below 0.9398 minor support will turn intraday bias neutral again first.
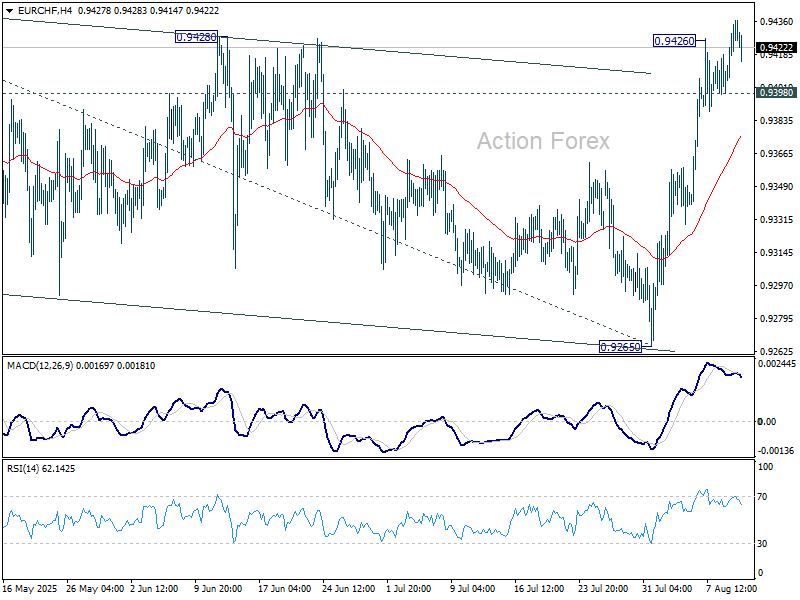
In the bigger picture, the down trend from 0.9204 (2018 high) might still be in progress considering that EUR/CHF is staying well inside the long term falling channel. However, with bullish convergence condition in W MACD, downside position should be limited in case of another fall. Instead, firm break of 0.9660 resistance will be an important sign of medium term bullish trend reversal.
US July Inflation Numbers Lead Today’s Agenda
Markets
US July inflation numbers lead today’s agenda. Consensus expects headline CPI to rise by 0.2% M/M with annual figure ticking up from 2.7% to 2.8%. Core CPI is estimated to accelerate to 0.3% M/M and 3% Y/Y (from 2.9%). It’s the second of three Summer inflation reports which Fed Chair Powell suggested would be indicative on the impact of US President Trump’s trade policy and which could impact the US central bank’s reaction function when it meets next in September. The more so given the dramatic downward revisions in the July payrolls report which prompted calls for action by more Fed governors than the two dissenters (Waller & Bowman) at the July FOMC meeting. Avoiding any upward surprises will strengthen current market believe/positioning that the Fed will resume its easing cycle in September as downside employment risks start outweighing upward inflation risks. In case of more benign inflation numbers (or weaker activity/labour market data later this month), we’d even err on the side of markets contemplating the possibility of a 50 bps rather than a 25 bps rate cut at the September meeting. This could extend the steepening move of the US yield curve via an outperformance of the front end and keeps the US dollar in the defensive. August German ZEW investor sentiment will also be released today but isn’t expected to impact trading.
Asian markets trade slightly positive this morning after US President Trump as expected extended the pause of tariffs on Chinese goods for another 90 days to November 10. China put out a similar statement. Japanese stock markets outperform with a new record high for the Nikkei as the nation returns from a holiday. UK labour market data were better than expected with employment rising by 238k 3M/3M in June (vs 185k expected) and July payrolls falling by 8k instead of the feared 20k. The unemployment rate stabilized at 4.7% with wage growth slowing from 5% to 4.6% in June. The data confirm the mood since last week’s BoE meeting that the UK central bank won’t accelerate its quarterly cutting pace (ie skip in September, next rate cut in November). EUR/GBP dips in a first reaction from 0.8650 to 0.8640.
News & Views
The Reserve Bank of Australia this morning lowered its key policy rate by 25 bps to 3.6%, bringing this year/cycle’s cumulative easing efforts to 75 bps. Australian inflation has continued to moderate with updated staff forecasts suggesting that underlying inflation will continue to hover around the midpoint of the 2-3% target range assuming an extension of the current gradual easing path. The RBA judges that there’s still a risk of households and firms delaying expenditure pending greater clarity on the outlook, even though the worst (trade) outcomes are avoided. Domestic GDP growth is expected to pick up, be it at a slower pace than projected in May (1.7%-2.1% for 2025-2026 from 2.1%-2.2%). Forecasts still assume the narrative to weigh on both activity and inflation. Domestic labour market conditions remain a little tight, although have eased further in recent months. The Board remains cautious about the outlook, particularly given the heightened level of uncertainty about both aggregate demand and potential supply, and will do what it considers necessary to achieve its dual mandate of price stability and maximum employment. Australian money markets assume two more rate cuts (quarterly pace), bringing the policy rate to 3.1% by February 2026. The market reaction is negligible as the rate was fully discounted and given limited changes to the RBA statement.
UK same store retail sales rose by 1.8% Y/Y in July, down from 2.7% in June. Food sales increased by 3.2% Y/Y on a like-for-like basis, supported by warm weather and a busy sporting calendar though higher spending was driven more by food inflation than by stronger demand. The head of the British Retail Consortium also added that early month momentum slowed throughout July. Non-food sales rose by 0.7% Y/Y with fashion initially performing well before weather conditions worsened. BRC CEO Dickinson warned that many retailers will face tough decisions over stores and jobs if the upcoming Autumn Budget adds further taxes. Current growth rates of sales barely touch the sides of covering the £7bn in new costs imposed on retailers in last year’s Budget. The ongoing pressure can continue pushing UK prices higher.
UK payrolled employment falls again by -8k, pay growth eases slightly
UK labor market data for July showed a slight deterioration in employment alongside a modest easing in pay growth. Payrolled employment fell by -8k, or -0.0% m/m, marking a -0.5% yoy drop compared to the same period last year. The number of payrolled employees has been trending lower since peaking in 2024, highlighting a gradual cooling in hiring momentum. Median monthly pay growth slowed marginally to 5.7% yoy from 5.8% yoy, while the claimant count dropped by -6.2k, sharply better than expectations of a 20.8k increase.

In the three months to June, unemployment rate held steady at 4.7%, in line with forecasts. Wage growth metrics were mixed. Average earnings including bonuses slowed from 5.0% to 4.6% yoy, falling short of expectations for 4.7%. Earnings excluding bonuses were unchanged at 5.0% yoy, matching forecasts.

Tariffs, Gold, Chips, and Inflation
Trump extended the tariff truce with China, which was set to expire today, by 90 more days, announced that gold will finally not be tariffed, and confirmed that Nvidia and AMD will pay the US government a 15% cut of their Chinese sales.
One emerging issue is that China doesn’t want companies to buy Nvidia’s H20 chips anymore for national security reasons – remember the reports that these chips might include location trackers, potentially used to spy on clients. The good news: under the new agreement, Nvidia could export a downgraded version of the Blackwell chip to China until further notice. The bad news: the Chinese government could still blacklist these chips as forbidden imports from the US.
While things are getting complicated, Nvidia and AMD might have still improved their position in China. Nvidia, for example, is expected to make over $20bn in revenue from China this year, if they accept to share $3bn of it with the US government — that is, if Chinese buyers keep purchasing their products.
On the US side, since the chip export ban is motivated by national security concerns, there’s no guarantee business will continue smoothly. But with the Trump administration, nothing is guaranteed anyway.
Consequently, Nvidia’s share price retreated 0.35% yesterday after flirting with its all-time high, while AMD opened lower, swung into gains, but closed with a small loss.
In China, however, the reaction this morning is clearly positive: SMIC — the leading Chinese chipmaker — is up more than 5% on hopes that some demand could be diverted to the domestic brand.
Elsewhere, Trump confirmed that gold imports will remain untaxed. Tariffs on bullion would have had major repercussions for flows into the US, which mainly come from Canada, Mexico, and Switzerland—nations already unsettled by US trade measures. Avoiding the tariff serves US interests by keeping these flows intact. Gold prices are firmer this morning after yesterday’s slump, also supported by Trump’s remarks that his meeting with Russia this week will be ‘a feel-out’ session, with no resolution to the Ukraine war unless Kyiv cedes territory—a statement that dampened earlier optimism. Oil prices also rebounded, with US crude potentially set to return to or above the $65 per barrel level, a key Fibonacci support from this year’s decline and a strong base for the spring–summer rally driven by geopolitical tensions.
Still in commodities, lithium surged after Chinese battery maker CATL failed to renew a license at a major mine in Jiangxi province for at least three months. That mine produces around 3% of global output. The Global X Lithium & Battery Tech ETF jumped 5.5%, driven partly by expectations that China is intentionally curbing capacity amid a global glut—lithium prices have fallen 90% since 2022—and slowing EV battery demand. Cutting supply could support prices and help China counter deflation. The ETF has lost about two-thirds of its value since its 2022 peak and recovered only around one-fifth since its March low. On the flip side of the trade, Fidelity’s Clean Energy ETF fell 1.65% as higher lithium costs may squeeze margins.
Broadly, risk appetite in US equities was limited ahead of today’s CPI release, which is expected to begin reflecting tariff-driven cost pressures as companies pass on expenses to consumers. Slowing services inflation could still offset goods inflation to a degree. But economists expect the headline CPI to post its largest monthly gain this year, with both headline and core readings rising on an annual basis. Core CPI—the Federal Reserve’s (Fed) key metric—is projected to return to 3%, moving further from the 2% policy target. A hotter-than-expected CPI print would likely reduce rate-cut expectations, push the US 2-year yield and the dollar higher, and pressure equity valuations. A softer reading would bolster Fed doves, lower short-term yields, and support stocks—assuming confidence in the data remains intact after the BLS drama earlier this month. The agency’s new chief faces close scrutiny over whether its statistics will remain insulated from political influence.
One certainty: small and mid-cap firms need lower rates to withstand trade disruptions. The S&P 500 equal-weighted index continues to lag its market-cap-weighted counterpart, underscoring how the post-April rally is being carried mainly by Big Tech—and how narrowing market breadth could magnify any future correction. Any sign that tariffs aren’t yet impacting consumer prices would be welcome news for the Fed’s dovish camp and for investors outside the technology sector.
All Eyes on US Inflation
In focus today
In the US, focus will be on the July CPI report. We forecast headline inflation at 0.2% m/m SA (prior: 0.3% m/m), and core inflation slightly higher at 0.3% m/m SA (prior: 0.2% m/m). With markets now pricing in a September rate cut after a weak jobs report, the CPI will offer crucial insights for the Fed's upcoming decision.
Also on the agenda today is the release of the NFIB small business optimism index, and remarks from the Fed's Barkin in the afternoon.
In Germany, focus turns to the ZEW index for August. The recent months have shown a clear rebound in the assessment of the current situation and expectations. It will be particularly interesting to see how the expectations component fared in August following the US-EU trade agreement.
Economic and market news
What happened overnight
In the US, Trump has extended the US-China tariff truce by 90 days, delaying triple-digit duties until early November. Officials from both nations see this as a step towards stabilising the global economy and remain cautiously optimistic about reaching a broader trade agreement later this year.
Additionally, E.J. Antoni of the conservative think tank Heritage Foundation has been nominated to chair the Bureau of Labor Statistics. This follows the dismissal of the former commissioner after the latest jobs report. His appointment awaits Senate confirmation. The Senate is currently on recess until September.
In Australia, the Reserve Bank of Australia (RBA) cut its cash rate to 2.60% (prior: 2.85%), aligning with both our forecast and consensus.
What happened yesterday
In Norway, core inflation came in unchanged at 3.1 % in July (cons: 3.0 %), aligning with Norges Bank's June MPR forecast. This supports the case for a September rate cut. Looking at the details, food inflation rose unexpectedly, with imported inflation also slightly higher. On the other hand, service inflation, especially ex. rent, was lower than anticipated.
In Denmark, inflation came in higher than expected at 2.3% y/y in July (cons: 1.7%, prior: 1.9%), driven by sharp increases in travel, hotel, food and electricity prices, while lower petrol prices provided some relief.
Danish export data showed stable exports to the US despite higher tariffs and a weaker dollar. However, uncertainty persists with a new tariff rate from August and potential future measures on medicine.
Equities: Equities were muted on Monday, with major indexes edging slightly lower (S&P 500 -0.3%, Stoxx 600 -0.1%). Sector preference tilted defensive, with health care and banks performing well - both of which remain our preferred low-beta top pick looking ahead. The fact that global cyclicals have returned over 10% in the past three months, while defensive stocks have been flat, is striking. Valuation would favour a defensive breather, which explains sessions like yesterday. Still, we believe macro momentum remains too strong to fully support that shift. However, if we are wrong on inflation or the US job market, the current valuation discount would, of course, amplify the moves in the opposite direction.
FI and FX: Global yields consolidated in yesterday's session, with no major catalysts. In both the US and the euro area, yields were broadly unchanged. In FX, it was a quiet start to the week. The NOK outperformed following a slightly higher-than-expected July CPI print in Norway, pushing EUR/NOK toward the 11.90 mark. Elsewhere, the USD posted broad-based gains across the G10. EUR/USD edged lower toward 1.16 ahead of today's key US July CPI release. EUR/CHF also moved higher, continuing to trade above 0.94, as Switzerland remains among the hardest-hit economies by the 39% US tariff on its exports.
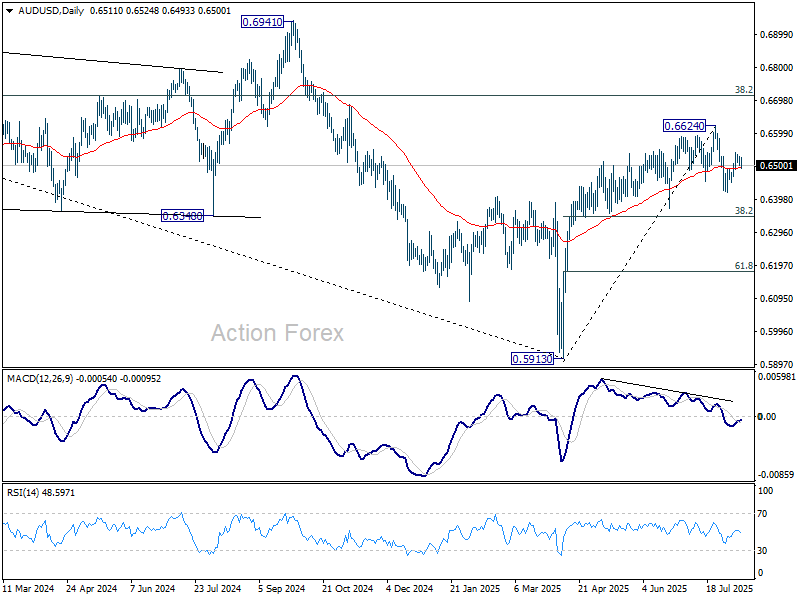
AUD/USD Daily Report
Daily Pivots: (S1) 0.6500; (P) 0.6514; (R1) 0.6528; More...
AUD/USD lost momentum after rebounding to 0.6540 and intraday bias is turned neutral first. Price actions from 0.6624 are seen as a corrective pattern. Above 0.6540 will extend the rebound from 0.6418 to rest 0.66624 high. On the downside, firm break of 0.6449 support will suggest that the pattern is in it third leg, and deeper fall should be seen through 0.6148 to 38.2% retracement of 0.5913 to 0.6624 at 0.6352.
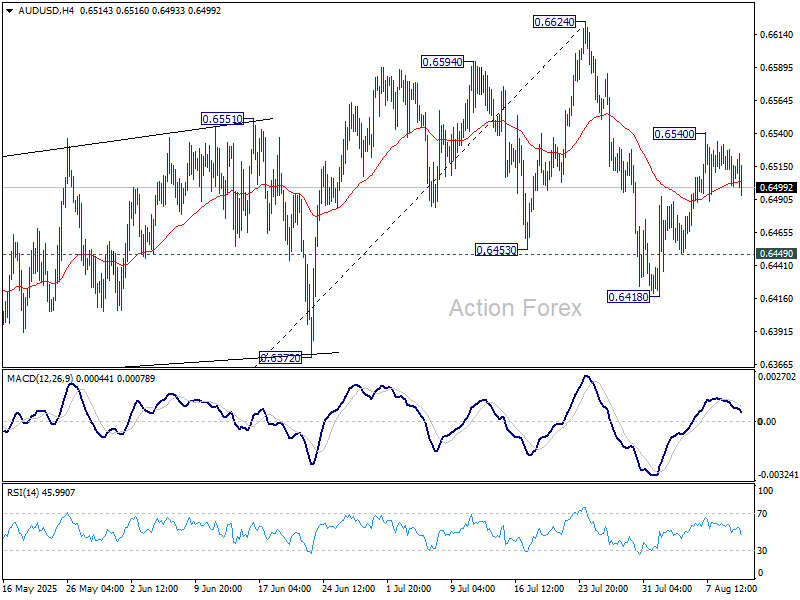
In the bigger picture, there is no clear sign that down trend from 0.8006 (2021 high) has completed. Rebound from 0.5913 is seen as a corrective move. While stronger rally cannot be ruled out, outlook will remain bearish as long as 38.2% retracement of 0.8006 to 0.5913 at 0.6713 holds. Nevertheless, considering bullish convergence condition in W MACD, even in case of another fall through 0.5913, downside should be contained above 0.5506 (2020 low).
USD/CAD Daily Outlook
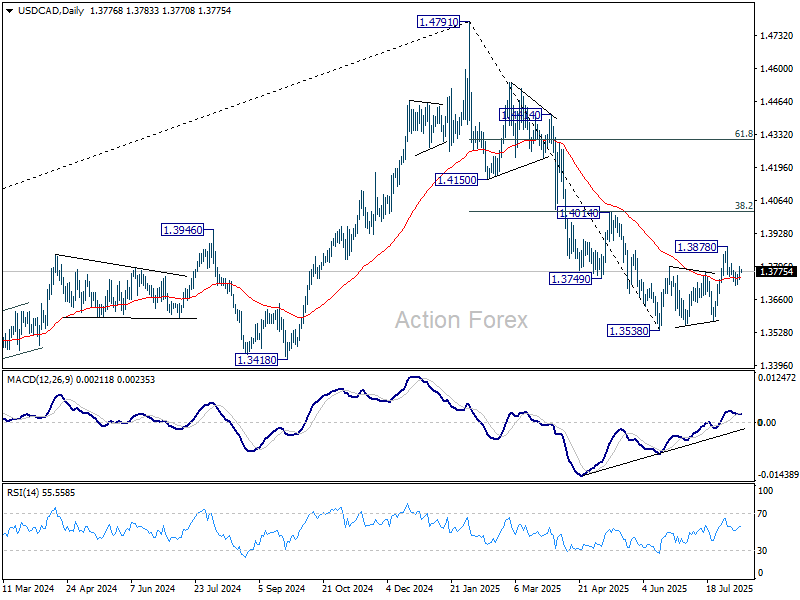
Daily Pivots: (S1) 1.3750; (P) 1.3773; (R1) 1.3801; More...
No change in USD/CAD's outlook and intraday bias stays neutral. On the downside, break of 1.3720 will reaffirm the case that corrective pattern from 1.3538 has completed at 1.3878. Further decline should then be seen back to retest 1.3538 low. However, break of 1.3809 will bring retest of 1.3878. Further break there will extend the corrective rebound from 1.3538 with another rising leg.
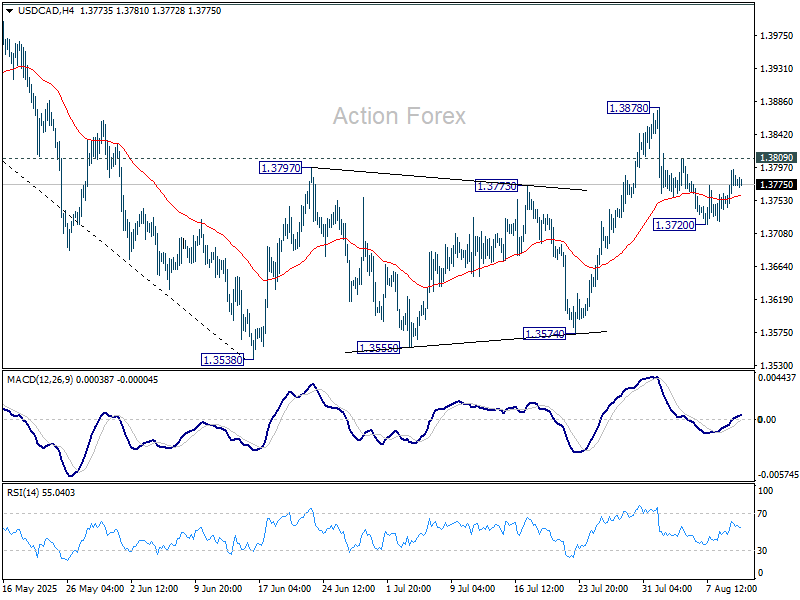
In the bigger picture, price actions from 1.4791 medium term top could either be a correction to rise from 1.2005 (2021 low), or trend reversal. In either case, further decline is expected as long as 1.4014 resistance holds. Next target is 61.8% retracement of 1.2005 (2021 low) to 1.4791 at 1.3069.