Sample Category Title
Bitcoin Rejects Test of All-Time Highs, A Double Top in the Making?
This weekend saw some explosive buying in digital assets, propulsed by Ethereum breaking above its previous highs.
After touching $4,000, a cascade of Saturday buying took the second largest crypto to $4,350 highs.
Ether is now consolidating around the $4,200 key handle – A consolidation at its highs is a more bullish sign, however for the Crypto Market to run higher, Participants will now look at the leading Crypto.
Bitcoin actually caught up to the ETH rally on Sunday evening and in a swift rally, touched $122,310, $900 shy of its all-time high record.
The failure to breach new highs has brought some profit taking, prompting a BTC analysis to see if this top has the potential to be a longer-term top or if there is still the potential for new all-time highs.
Cryptocurrencies have been getting a boost from growing doubts on the US Economy amid the imposition of the infamous Trump tariffs, and getting further support from accommodative US crypto policies.
A daily overlook on the Crypto Market
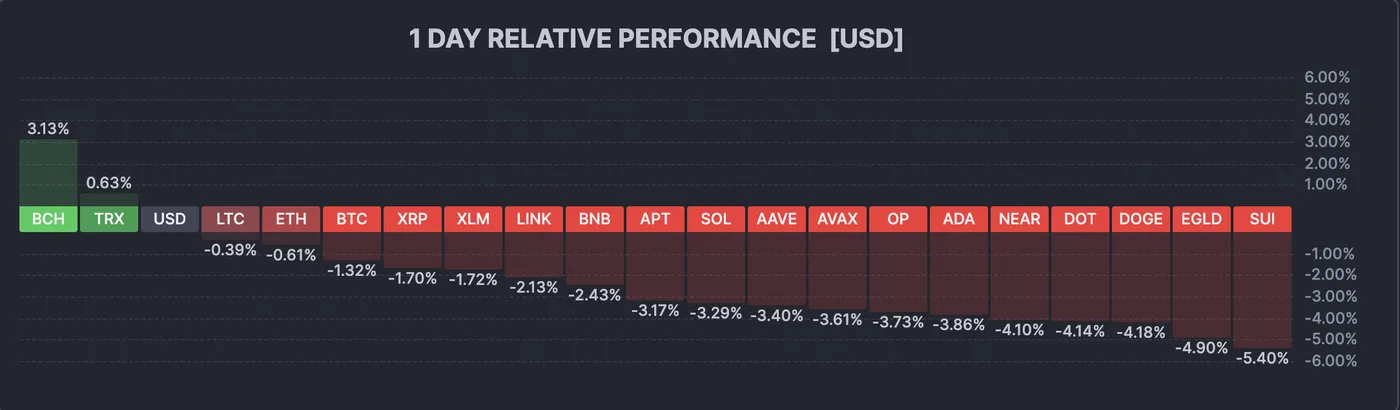
Crypto Daily Performance, August 11, 2025 – Source: Finviz
Some relatively strong profit taking is happening on altcoins but this doesn't seem to be as strong of a correction for Bitcoin and ETH which have been outshining their competitors.
As long as both ETH and BTC hold their current highs, the market shouldn't show any signs of concerns – but the relative strength of both relative to minor coins could be an interesting study for the upcoming cycle.
Bitcoin Multi-timeframe Technical Analysis
Bitcoin Daily Chart
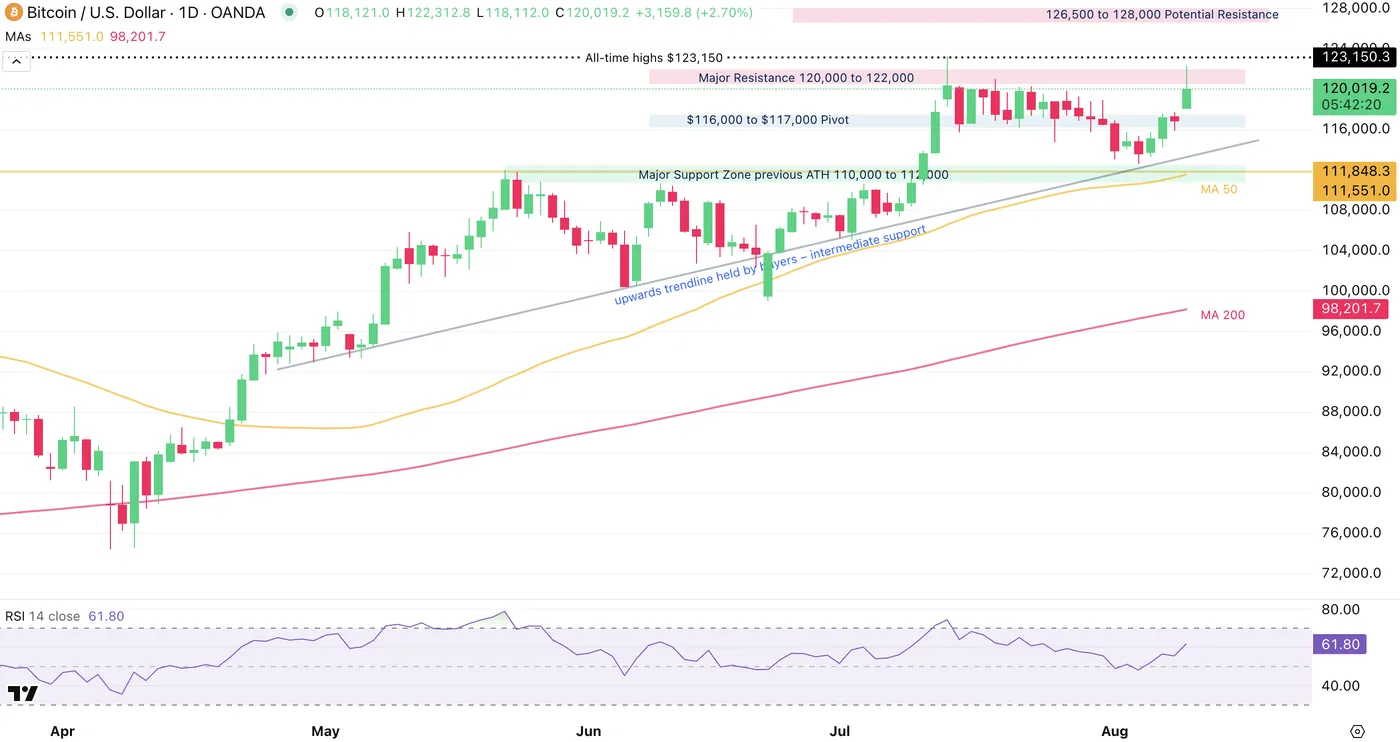
Bitcoin Daily Chart, August 11, 2025 – Source: TradingView
Looking at the daily picture, we see the Bitcoin establishing a range in the $113,000 to $120,000 range – Ranges close to the al-time highs are typically good signs for prolonged upward action.
However, today and tomorrow's daily candles will provide huge technical information on if a double top will emerge or not after the overnight session's higher wick.
As long as the lower bound of the range holds (further supported by the 110,000 to $112,00 support zone), Bitcoin still has a chance to mark new cycle all-time highs.
Bitcoin 4H Chart
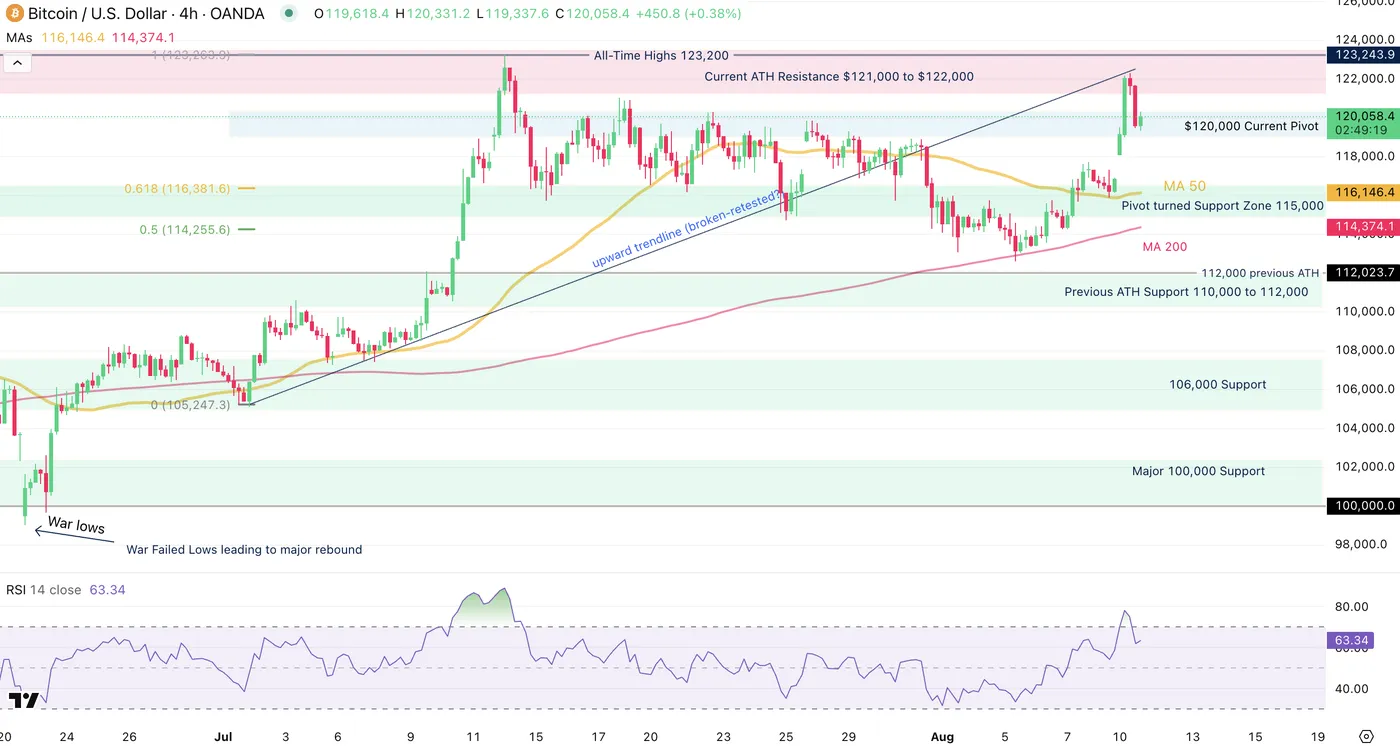
Bitcoin 4H Chart, August 11, 2025 – Source: TradingView
Looking closer, we see the most recent highs acting as a potential break-retest of the July upwards trendline.
Rejecting below the $115,000 Support would confirm a break-retest which would point towards the beginning of a worst-case scenario for Bitcoin as this would come with a failed double top and would indicate that buyers haven't had enough strength to even retest the previous ATH.
This scenario is for now still a bit far, therefore the rest is to see if Bitcoin holds around the 119,000 to 120,000 Pivot zone – Consolidating here gives it more chance to retest the ATH and potentially break higher
Key levels of interest for Bitcoin:
Resistance levels:
- All-time Highs to break 123,150
- Most recent highs 122,300
- Major Resistance 121,000 to 122,000
- 126,500 to 128,000 Potential Resistance
Support levels:
- Immediate Pivot Between $115 ,000 to $116,500 (Confluence with 4H MA 50)
- $113,000 Mini Support and weekend lows
- Major Support Zone previous ATH 110,000 to 112,000
Bitcoin 1H Chart
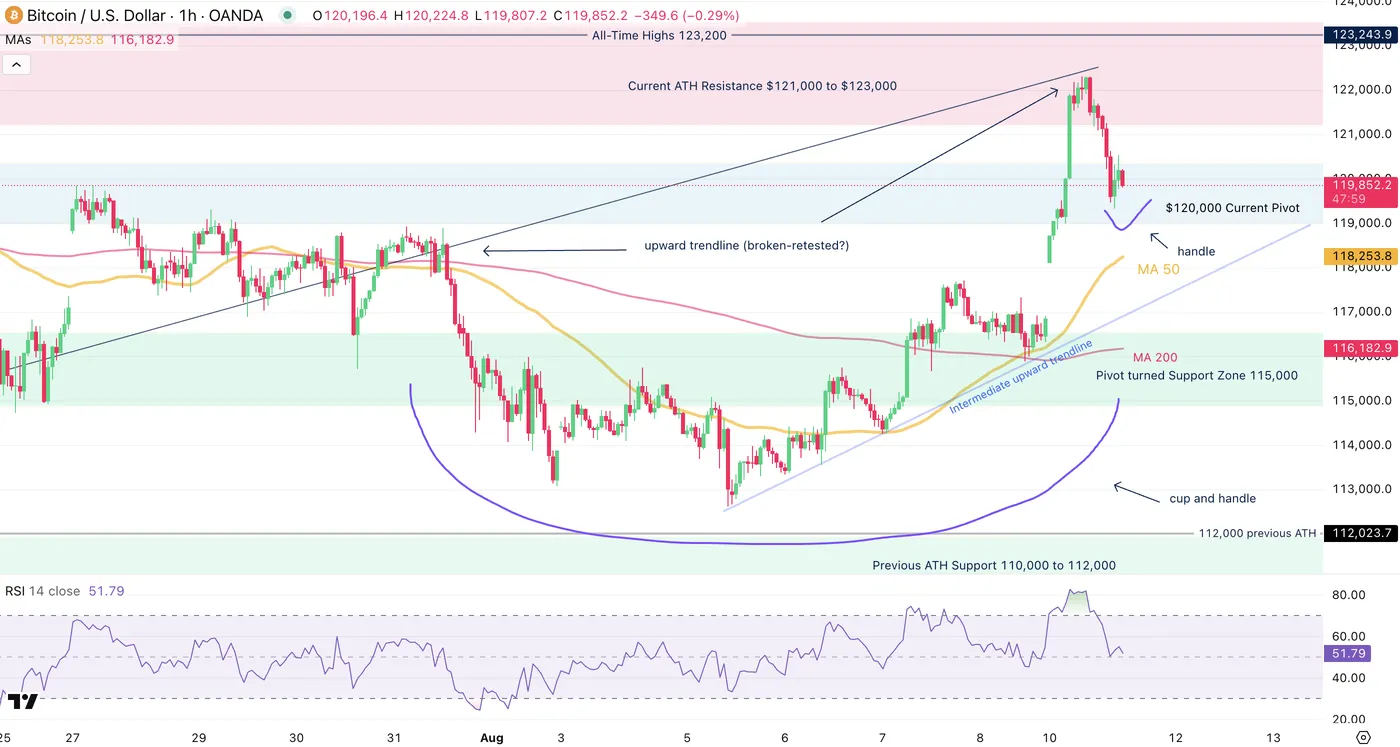
Bitcoin 1H Chart, August 11, 2025 – Source: TradingView
The action is still very balanced in the 1H Chart –
We spot more details of this morning's selloff rejecting the July upward trendline on a break-retest technical pattern, but with the 1H RSI back to neutral, it will be essential to see where players take the prices.
Tomorrow's US CPI will have sure implications for the upcoming price action and participants may no want to move their pawns too much before.
In the meantime, a cup and handle pattern is in the development. If buyers do trade on this technical setup, a measured-move rule of this pattern would point to $125,500 prices.
Tomorrow will be the key to the future price action.
Safe Trades!
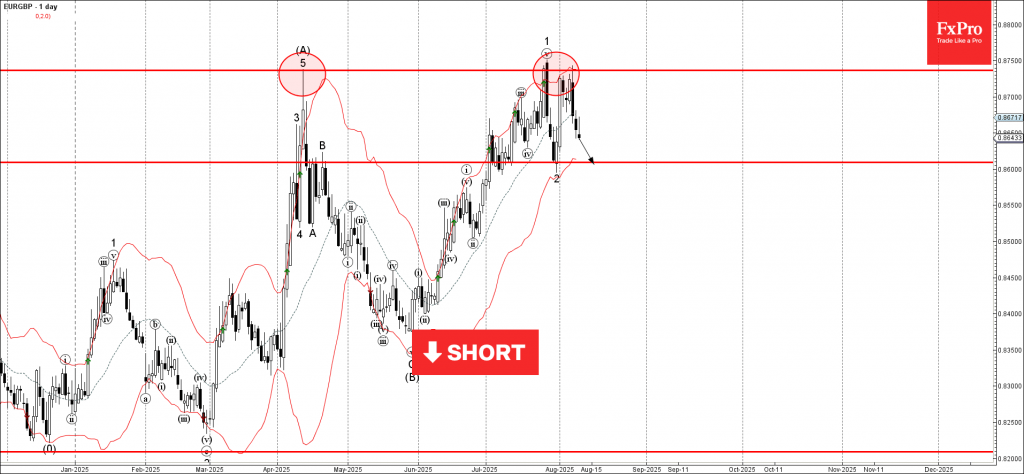
EURGBP Wave Analysis
EURGBP: ⬇️ Sell
- EURGBP reversed from a strong resistance level 0.8735
- Likely to fall to support level 0.8600
EURGBP currency pair recently reversed down from the strong resistance level 0.8735 (which stopped all earlier sharp impulse waves from April), coinciding with the upper daily Bollinger Band.
The downward reversal from the resistance level 0.8735 created the daily Japanese candlesticks reversal pattern, Bearish Engulfing.
EURGBP currency pair can be expected to fall further to the next support level 0.8600, which stopped the earlier downward correction 2.
US CPI Release: Bullish Chance for Dollar
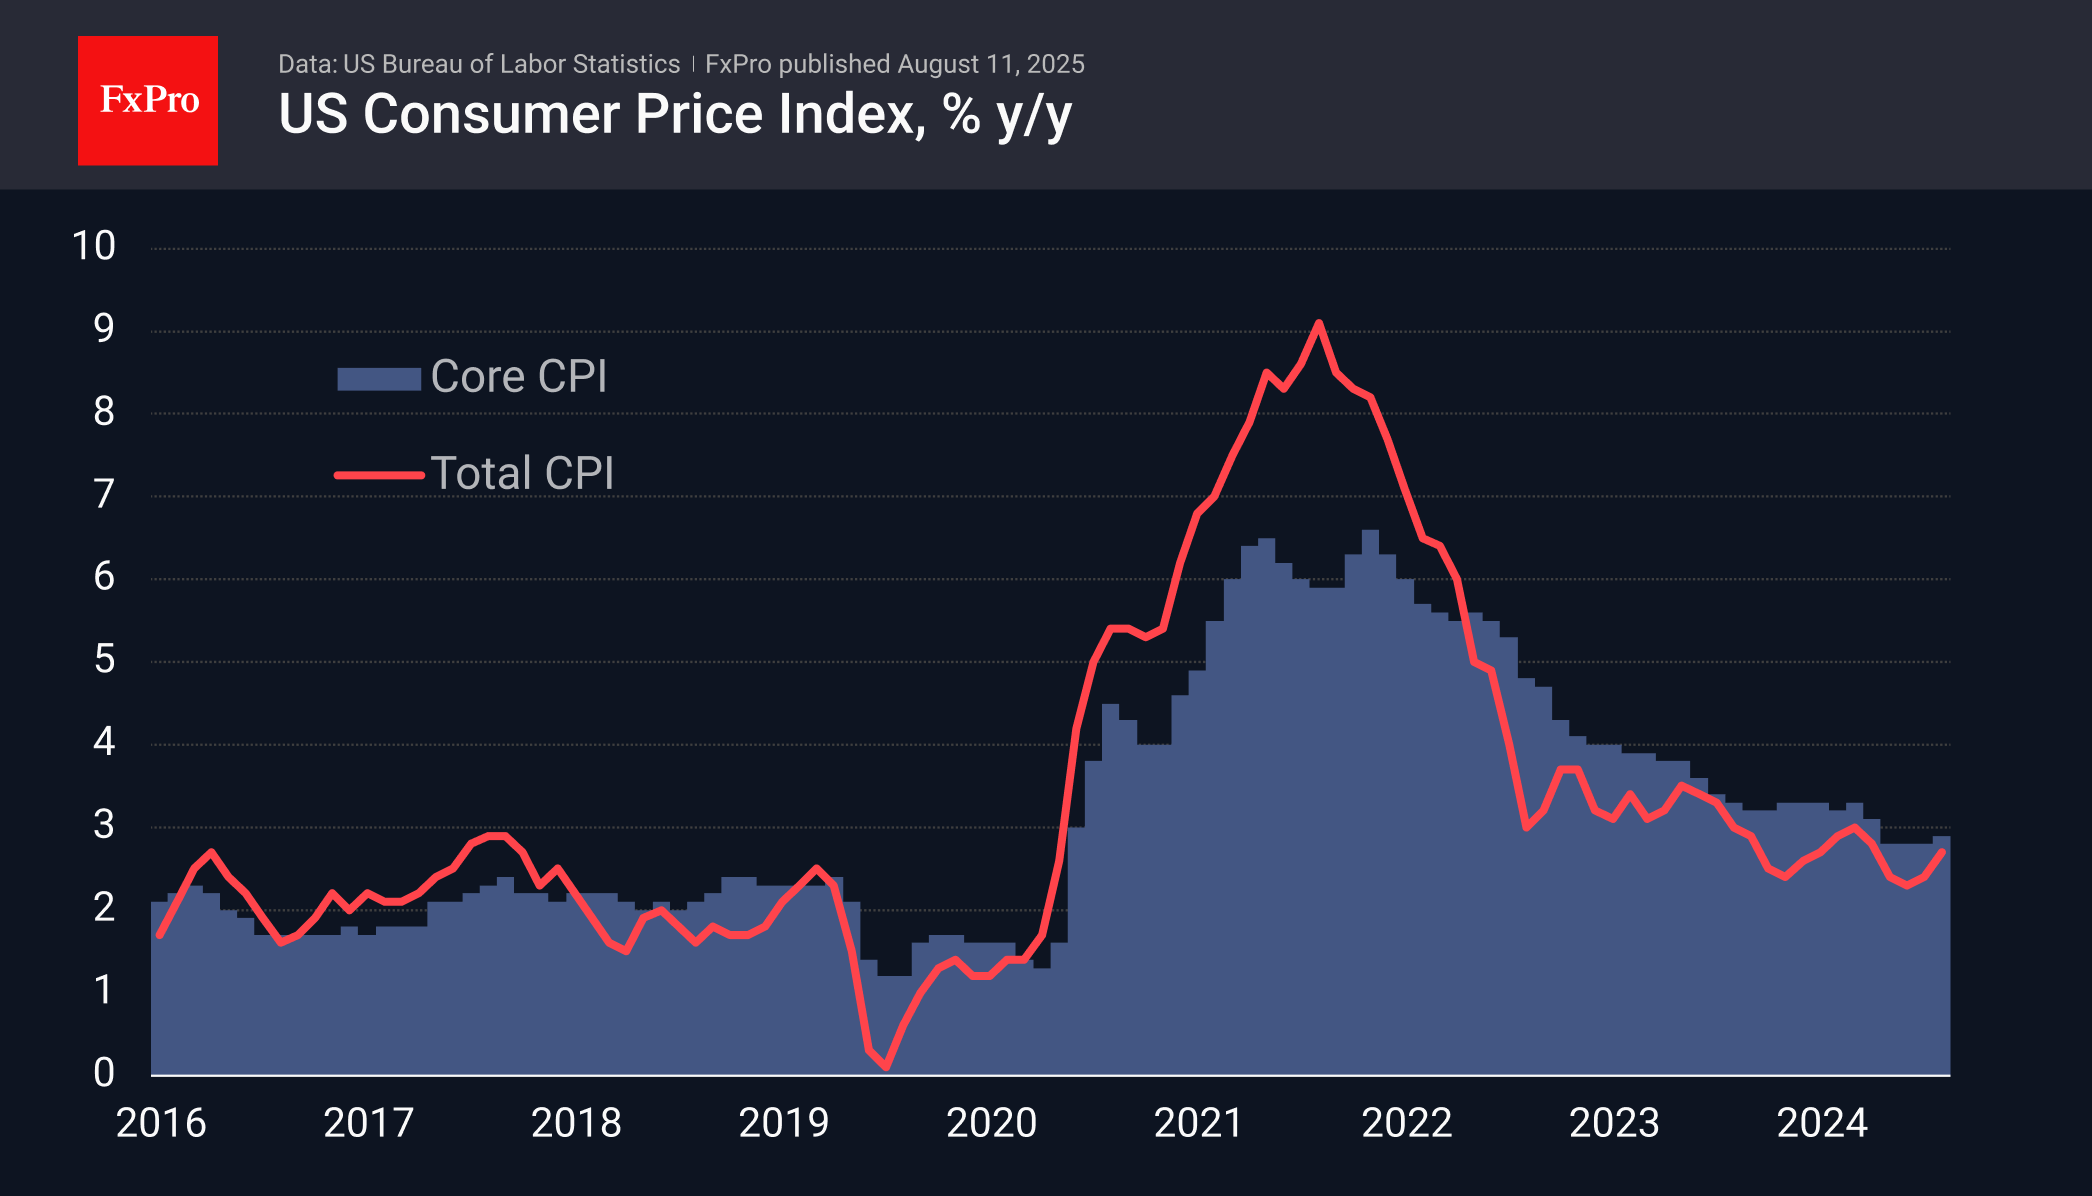
On Tuesday, US consumer inflation data for July will be released, which will largely determine the fate of the key rate cut in September.
The overall consumer price index in the US accelerated its annual growth from 2.3% to 2.7% in June, and analysts expect it to accelerate to 2.8%. Excluding food and energy prices, it is anticipated to accelerate to 3.0% y/y. In both cases, this will be the highest rate since February.
Since the beginning of the year, inflation reports have been below expectations, which could potentially negatively affect the dollar if this trend continues.
But it is also worth considering Powell’s warning at the end of July that the tariff-induced surge in prices has only just begun to gain momentum. An acceleration above expectations could bring back trading on the markets based on expectations of a rate cut in September.
Interest rate futures are pricing in an 86% chance of easing in September (up from over 90% a week ago). Still, an acceleration in headline CPI to 3% could well reduce that chance to 50%, providing a foundation for a dollar recovery.
US Dollar Finds Support Ahead of US CPI
The US Dollar is starting the week on a steadier footing after lagging through much of last week, weighed down by a string of underwhelming US data releases.
Traders now turn their attention to a pivotal stretch for inflation figures, with CPI due Tuesday (consensus: +0.2% m/m, +2.8% y/y) and PPI on Thursday (consensus: +0.3% m/m, +2.5% y/y) and expectations are for high volatility: Markets and central banks all want to know more on the US Economy as the infamous Trump tariffs are finally in place.
Major pairs like EUR/USD and GBP/USD have seen sharp appreciation on the back of recent USD weakness, but that rally now faces a test.
With key data looming, uncertainty is creeping back in and imposes to have a look on the Dollar Index as the week gets underway.
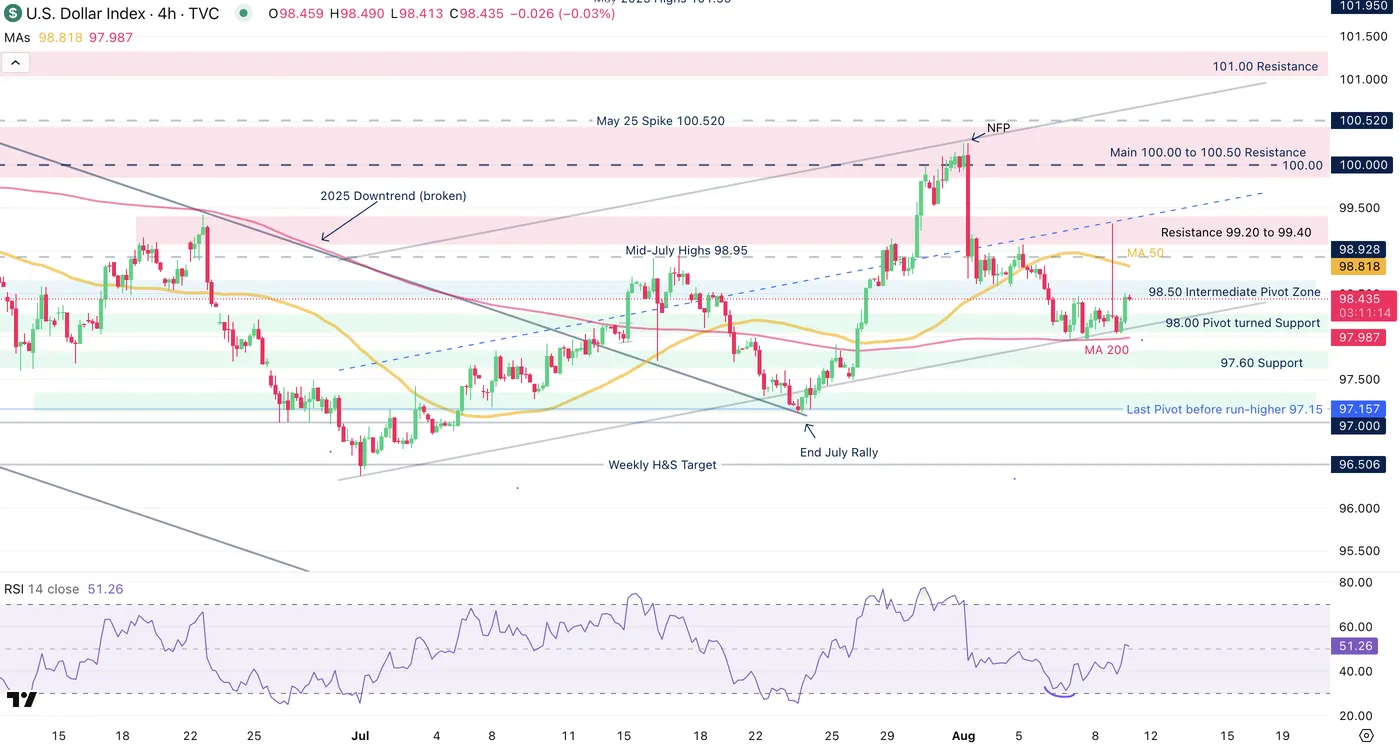
Dollar Index Multi-timeframe checkup ahead of tomorrow's CPI release
Dollar Index Daily Chart
Dollar Index Daily Chart, August 11, 2025 – Source: TradingView
After last week's trough in the DXY, sold off due to the consecutive NFP and PMI misses, buyers started to step in mean-reversion style.
Forming a low around the 98.00 handle with the 50-Day MA acting as immediate support, the buying is still a bit superficial as markets will want to see how inflation data lands.
A stronger than expected CPI will take out some of the pricing for a September cut.
Anything above 0.3% should strengthen the USD strongly which should have a negative effect on equities.
A miss on the other hand will turn the concerns to employment.
FED speak had expressed that US companies are for now absorbing the higher costs but we should see this effect spreading to consumer prices progressively as profit margins get squeezed.
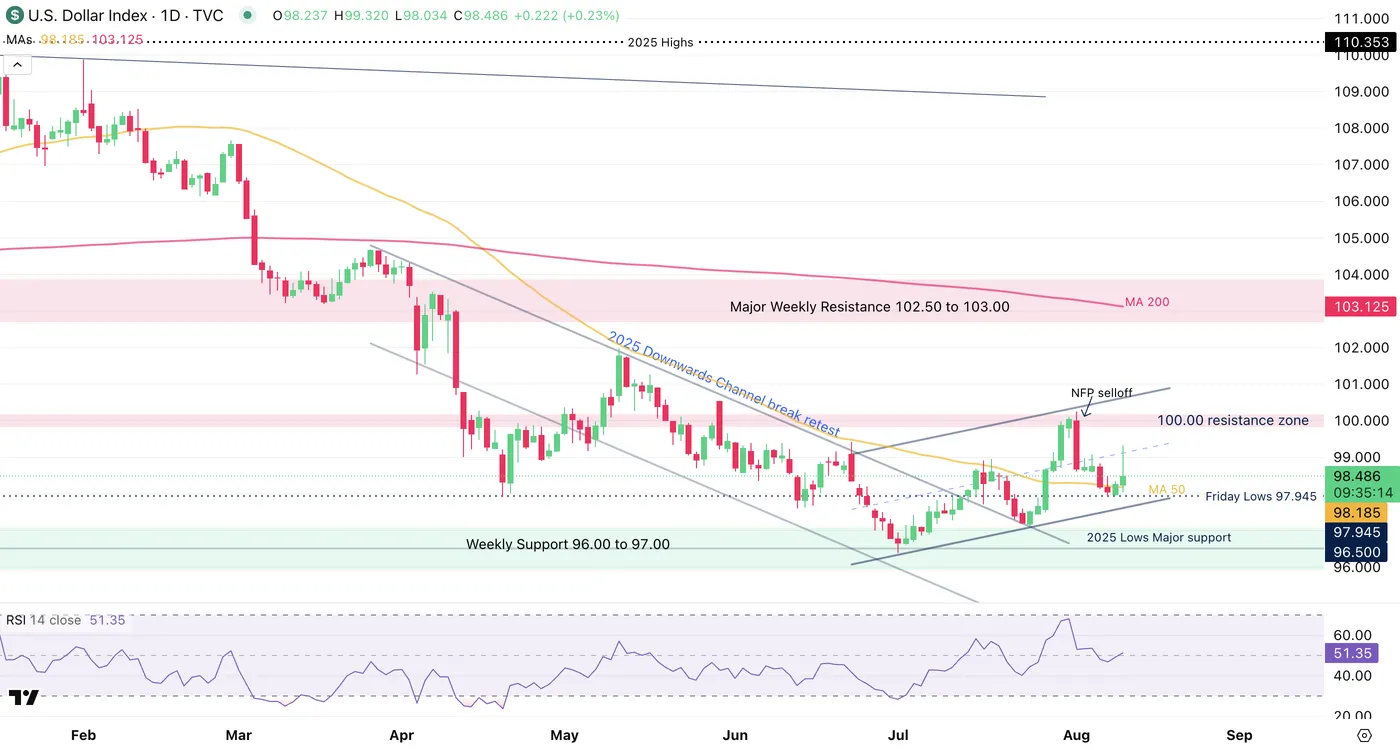
Dollar Index 4H Chart
Dollar Index 4H Chart, August 11, 2025 – Source: TradingView
The US Dollar has formed an intermediate upwards channel confirmed after the most recent 97.95 Friday bottom.
USD Bulls will have to hold above the Friday lows to avoid a more bearish outlook which should see other majors rallying strongly against it – Everything will depend on tomorrow's data.
In the meantime, the Greenback is held between the 200-period MA and the 50-MA, monitor both for breakouts.
RSI momentum is back to neutral, allowing more potential volatility.
Dollar Index 1H Chart
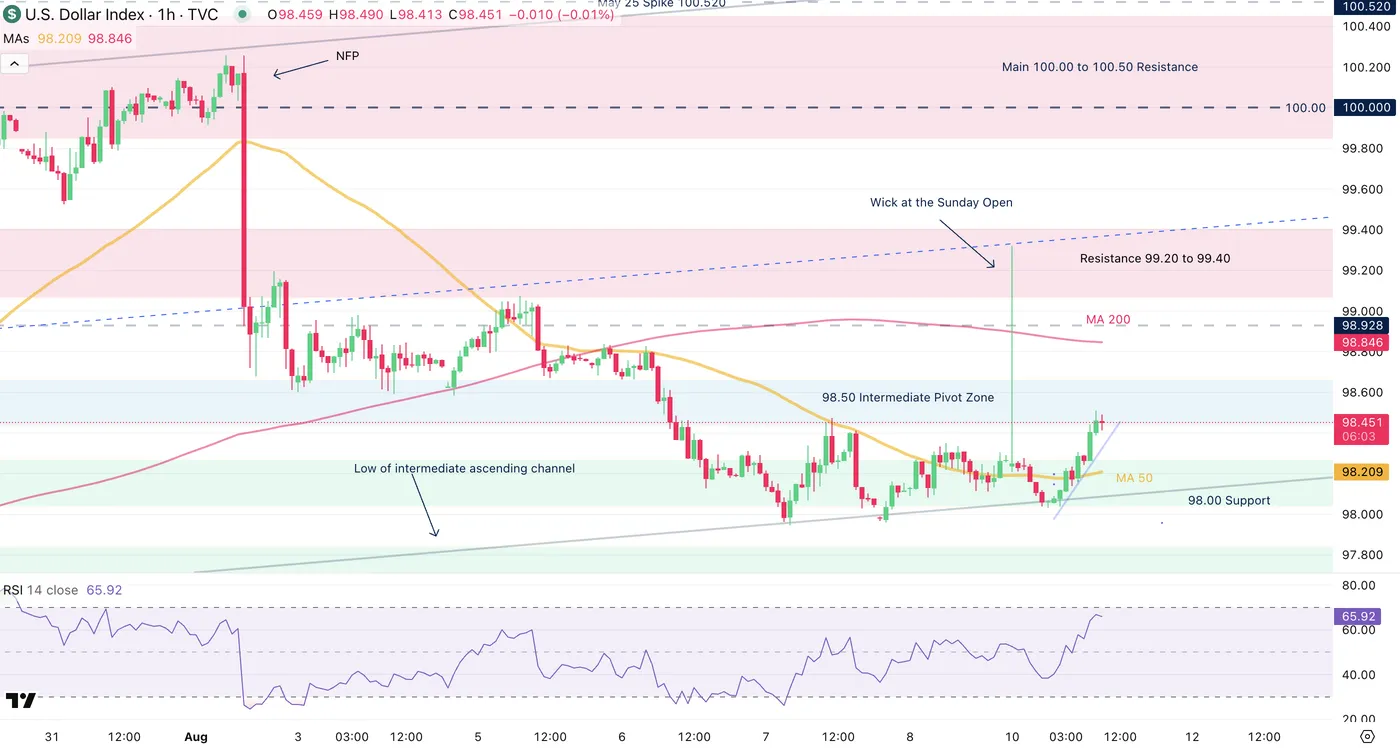
Dollar Index 1H Chart, August 11, 2025 – Source: TradingView
After a bullish NA weekly open for the USD, buyers are facing the 98.50 Pivot Zone leading to some ongoing consolidation.
Expect a balanced price action in the waiting of the key data, particularly as RSI is coming close to overbought in the shorter timeframes.
The 50-H MA is acting as support at 98.20 while the 200-H MA acts as the next resistance at 98.85 – the rest of the action will have to be weighted depending on the potential USD Sellers at the current pivot zone.
If they do show up, expect rangebound action between this morning's 98.510 highs and the 50-H MA.
Safe Trades and successful trading week!
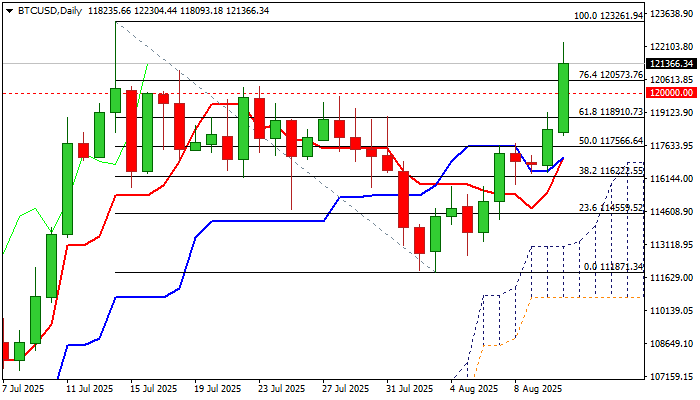
BTCUSD – Bulls Accelerate Through 120K and Near All-Time High
BTCUSD surged through psychological 120K barrier and hit the highest in almost one month (122300) on Monday.
Recovery leg from 112K zone (higher base / the bottom of pullback from new record high) has strongly accelerated in past two sessions and retraced over 76.4% of 123261/111871 pullback), generating signal that corrective phase might be over soon.
The recent rally was driven by fresh institutional purchases, growing expectations of Fed rate cuts (following the latest disappointing numbers from US labor sector) as lower rates and weaker dollar are supportive factors, with broader support provided by significant positive changes in the US legislation of crypto markets.
Return above 120K added to positive technical picture (the price action remains underpinned by ascending and thickening daily cloud / converged daily Tenkan/Kijun-sen about to for a bull-cross and strong positive momentum) however, overbought stochastic warns that bulls may face headwinds on approach to key resistance (new record high).
This is already visible on hourly chart as the price eased from session high, with corrective action expected to stay above broken 120K level (reverted to solid support) to keep larger bulls intact for fresh push higher and potential attack at 123261 top.
Break higher will confirm strong bullish stance and push the price into uncharted territory, with Fibo projections (126000, 127600) and psychological 130K barrier, marking next targets.
Res: 122300; 123261; 126000; 127600
Sup: 120573; 120000; 118910; 118000
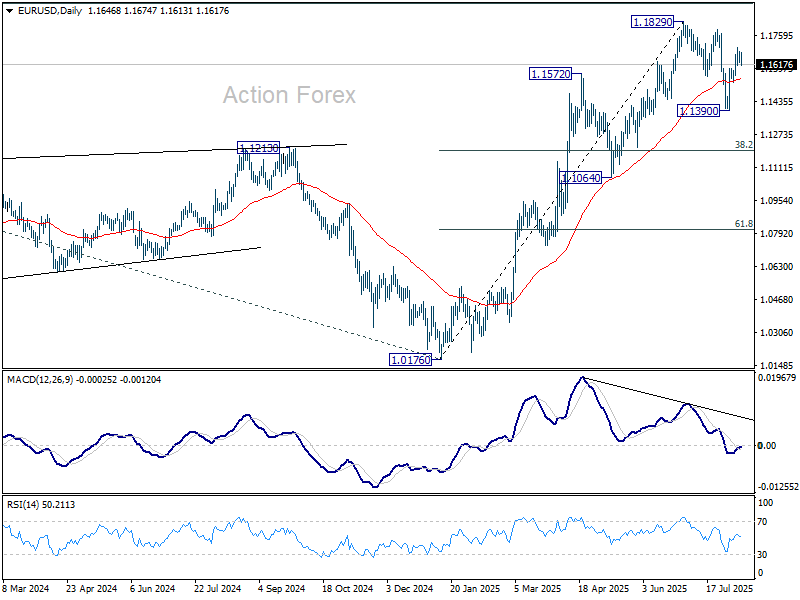
EUR/USD Mid-Day Outlook
Daily Pivots: (S1) 1.1621; (P) 1.1650; (R1) 1.1671; More...
Intraday bias in EUR/USD remains neutral and more consolidations would be seen below 1.1698 temporary top. Outlook is unchanged that correction from 1.1829 should have completed with three waves down to 1.1390. Above 1.1698 will bring retest of 1.1829. However, break of 1.1526 support will dampen this bullish view and bring deeper fall back to 1.1390 instead.
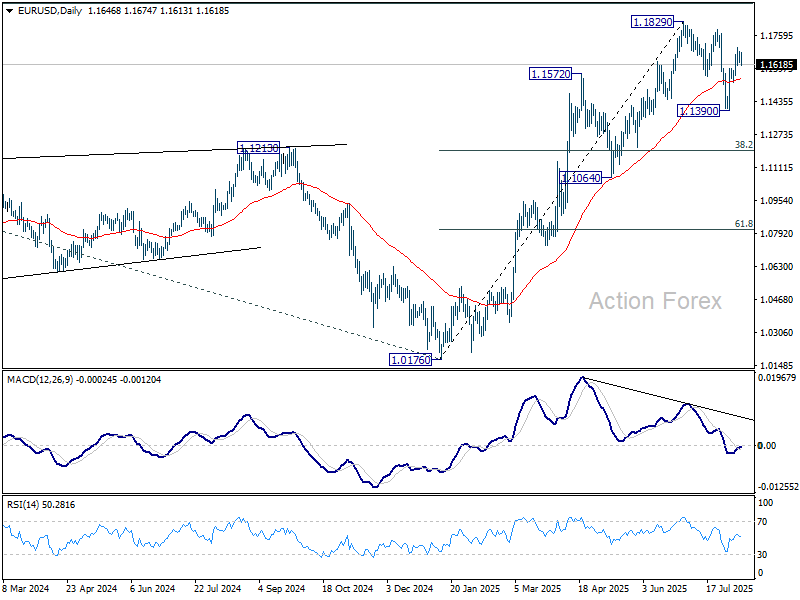
In the bigger picture, rise from 0.9534 long term bottom could be correcting the multi-decade downtrend or the start of a long term up trend. In either case, further rise should be seen to 100% projection of 0.9534 to 1.1274 from 1.0176 at 1.1916. This will remain the favored case as long as 1.1604 support holds.
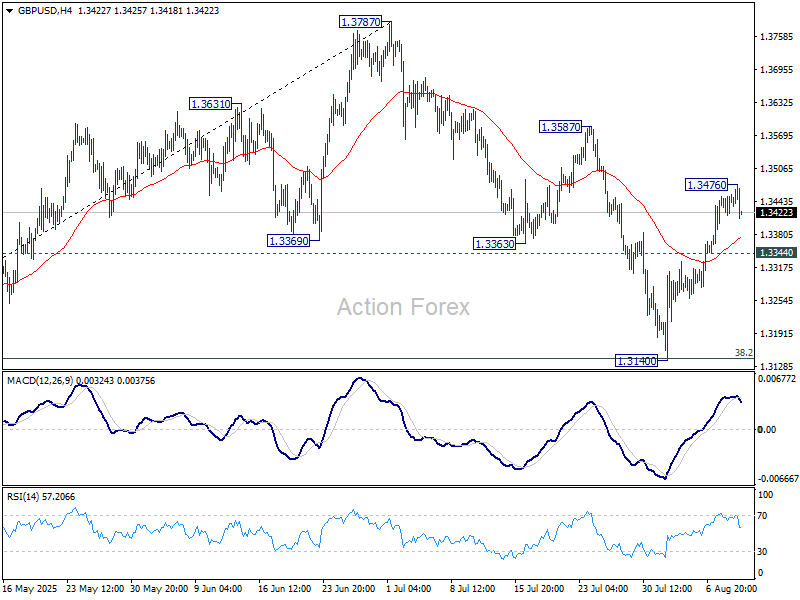
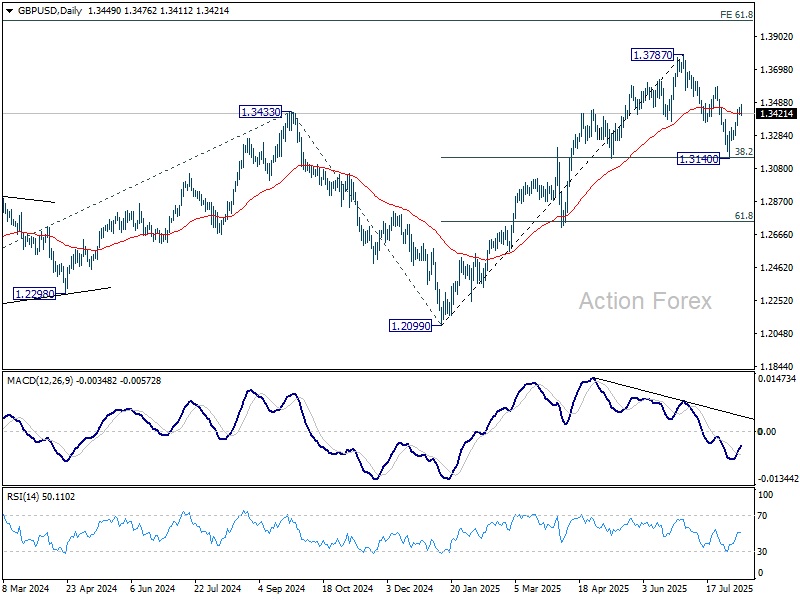
GBP/USD Mid-Day Outlook
Daily Pivots: (S1) 1.3426; (P) 1.3442; (R1) 1.3467; More...
Intraday bias in GBP/USD is turned neutral first with current retreat. Some consolidations would be seen but further rally is expected as long as 1.3344 minor support holds. Correction from 1.3787 should have completed with three waves down to 1.3140. Above 1.3476 will target 1.3587 resistance first. However, break of 1.3344 minor support will dampen this bullish case, and turn bias to the downside for deeper fall.
In the bigger picture, up trend from 1.3051 (2022 low) is in progress. Next medium term target is 61.8% projection of 1.0351 to 1.3433 from 1.2099 at 1.4004. Outlook will now stay bullish as long as 55 W EMA (now at 1.3068) holds, even in case of deep pullback.
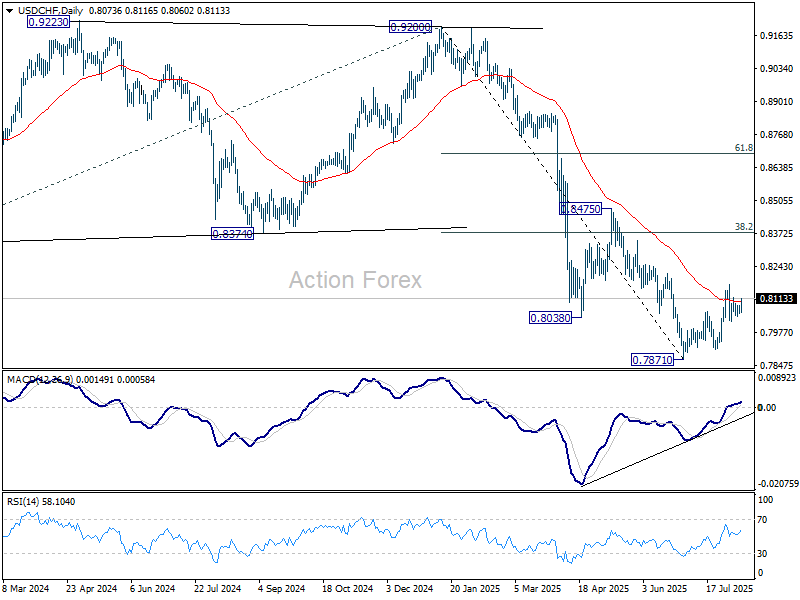
USD/CHF Mid-Day Outlook
Daily Pivots: (S1) 0.8061; (P) 0.8075; (R1) 0.8098; More….
USD/CHF is still bounded in range of 0.8020/8170, and intraday bias remains neutral. On the downside, break of 0.8020 will solidify the case that corrective pattern from 0.7871 has completed at 0.8170. Further fall should be seen back to retest 0.7871 low. However, break of 0.8710 will resume the corrective rise towards 38.2% retracement of 0.9200 to 0.7871 at 0.8379.
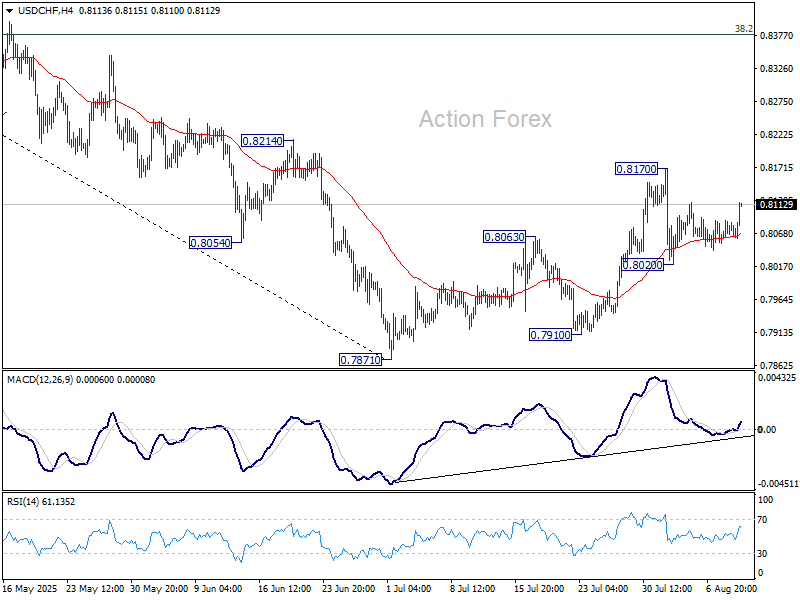
In the bigger picture, long term down trend from 1.0342 (2017 high) is still in progress. Next target is 100% projection of 1.0146 (2022 high) to 0.8332 from 0.9200 at 0.7382. In any case, outlook will stay bearish as long as 0.8475 resistance holds.
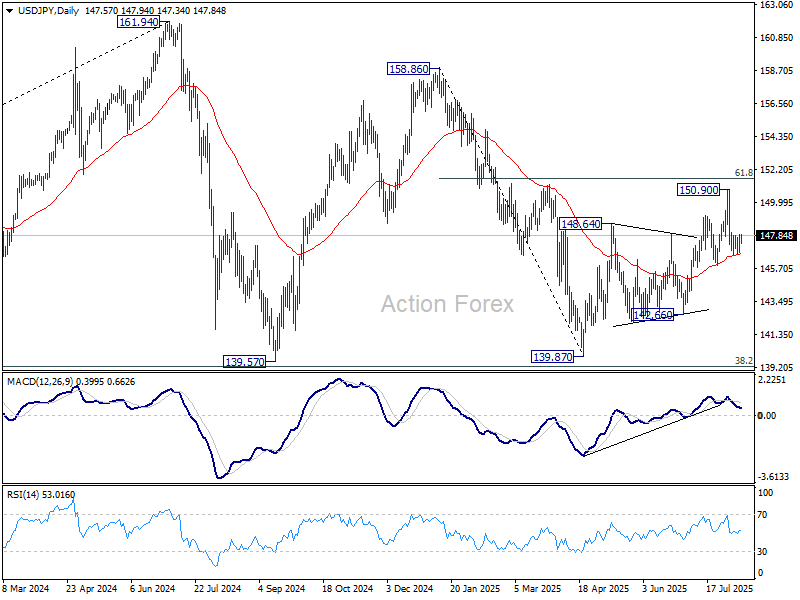
USD/JPY Mid-Day Outlook
Daily Pivots: (S1) 147.00; (P) 147.45; (R1) 148.18; More...
USD/JPY recovers mildly today but stays below 148.07 minor resistance. Intraday bias remains neutral at this point. Intraday bias in USD/JPY stays neutral and outlook is unchanged. As long as 145.84 support holds, larger rebound from 139.87 is still expected to continue. On the upside, above 148.07 minor resistance will bring retest of 150.90 high first. However, decisive break of 145.84 will indicate near term bearish reversal and target 142.66 support next.
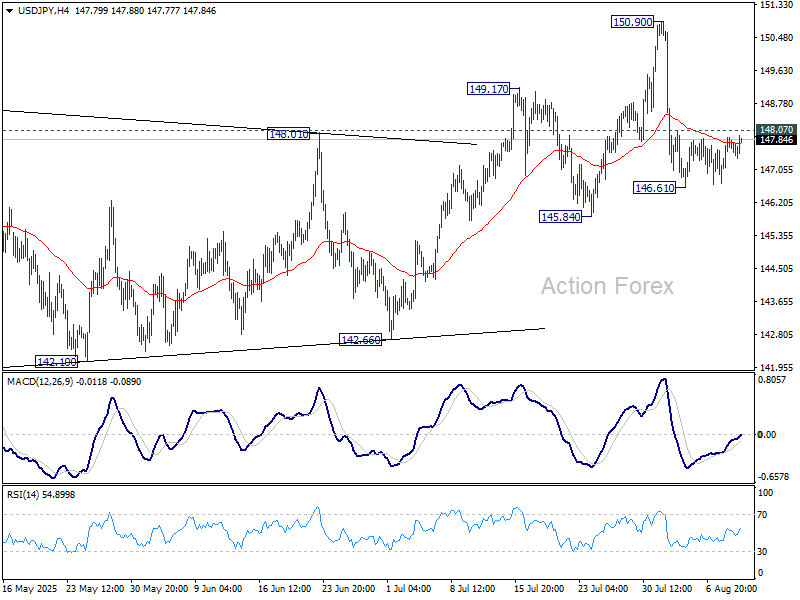
In the bigger picture, price actions from 161.94 (2024 high) are seen as a corrective pattern to rise from 102.58 (2021 low). Decisive break of 61.8% retracement of 158.86 to 139.87 at 151.22 will argue that it has already completed with three waves at 139.87. Larger up trend might then be ready to resume through 161.94 high. In case the corrective pattern extends with another fall, strong support is expected from 38.2% retracement of 102.58 to 161.94 at 139.26 to bring rebound.