Sample Category Title
Dollar Slips Post-CPI, Sterling Gains on Mixed UK Jobs Data
Dollar came under renewed selling pressure in early US session following the release of July’s CPI report. Equity markets responded positively, with stock futures pushing higher as investors focused on the softer-than-expected headline reading, largely downplaying the firmer core figure. Market reaction suggests the report does little to disrupt expectations for the Fed to deliver its anticipated September rate cut.
Futures pricing in fed funds markets even firmed slightly for a follow-up move in October. However, the policy outlook beyond September remains highly uncertain, as the impact of recent US tariff increases is expected to start filtering into the data later in the year.
In the UK, labor market data offered little to bridge the divide on the BoE’s Monetary Policy Committee. Payrolled employment has been declining steadily since late 2024. At the same time, wage growth remains well above pre-pandemic norms.
For BoE’s hawks, still-strong pay growth outweighs the risks of a weaker jobs market, while doves argue that continued payroll declines should take precedence. Complicating matters is the possibility that falling employment is not entirely demand-driven, but partly a response to rising labor costs. Either way, elevated wage growth remains a key contributor to domestic price pressures.
For Sterling, the figures were mildly supportive, as wage resilience keeps the case for a slower easing cycle alive. Market attention now turns to Thursday’s UK GDP release, which could add some decisive information to the BoE policy debate if growth data surprises in either direction.
Elsewhere, Aussie extended losses during the European session after RBA’s expected 25bps rate cut. Governor Michele Bullock acknowledged that “the cash rate might need to be a bit lower” to ensure low inflation and steady employment but emphasized the high degree of uncertainty and reiterated the Bank’s data-dependent approach. RBA appears in no hurry to cut again before the Q3 CPI release in late October, keeping November as the most likely timing for another move.
By the time of writing, Sterling is leading the majors, followed by Swiss Franc and Euro. Aussie sat at the bottom, ahead of Loonie and the greenback. Kiwi and Yen traded mixed in the middle.
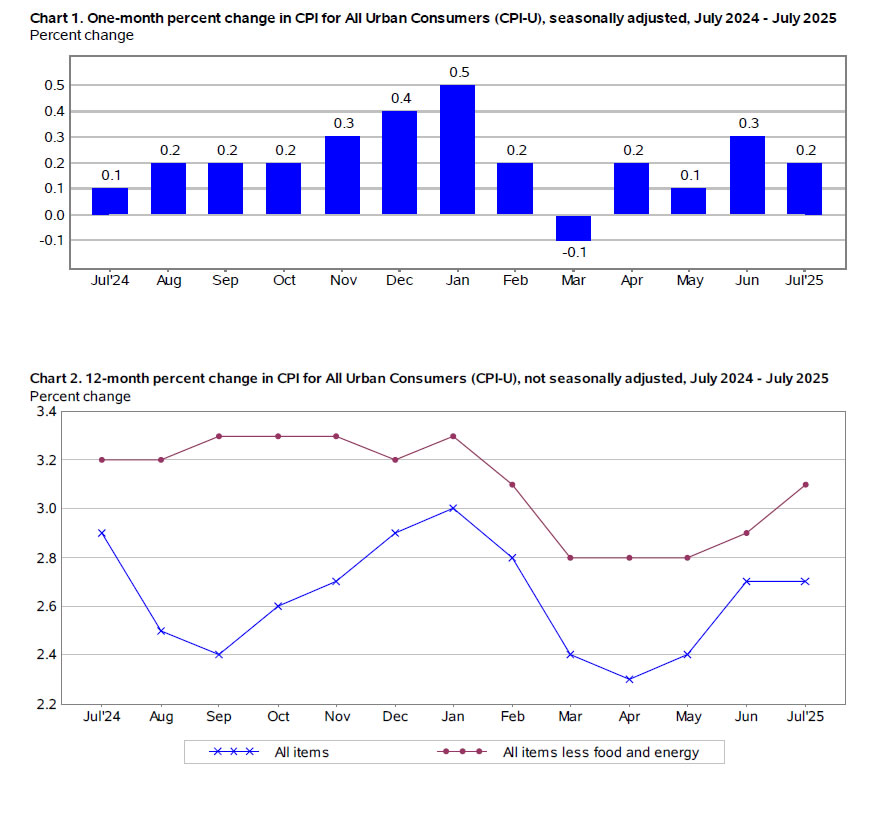
US core CPI jumps to 3.1% in July, headline unchanged at 2.7%
July CPI figures showed headline inflation unchanged at 2.7% yoy, missing expectations for a rise to 2.8% yoy. Core CPI accelerated to 3.1% yoy from 2.9% yoy, topping the 3.0% yoy forecast. The annual energy index dropped -1.6% yoy, offsetting a 2.9% yoy rise in food prices.
Month-on-month, CPI increased 0.2% and core CPI rose 0.3%, both matching consensus. Shelter prices gained 0.2% and was the largest contributor to the monthly increase, while the food index was flat and energy prices declined -1.1%.
The pickup in core pressures may keep the Fed cautious. While markets still expect a September rate cut, the uptick in core CPI could limit the pace of policy easing beyond that meeting.
German, Eurozone ZEW sentiment slides sharply in August
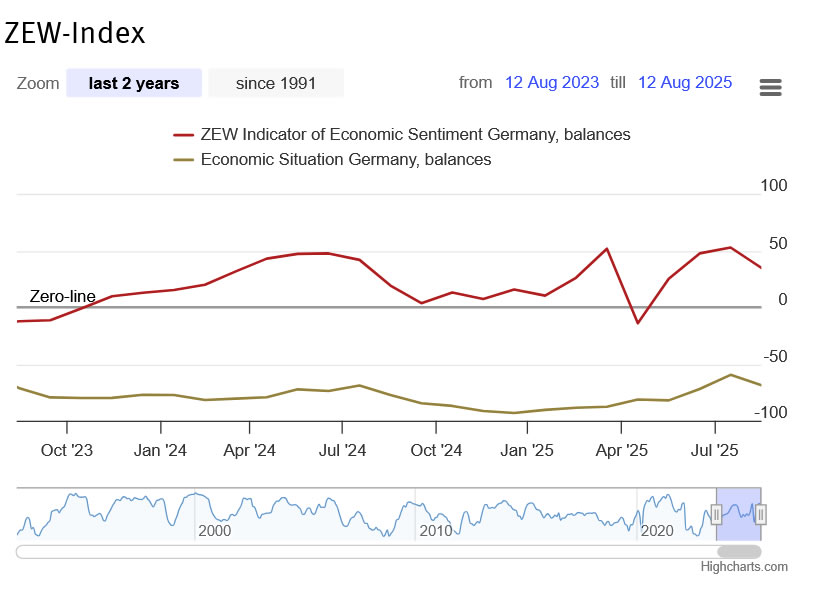
German investor sentiment weakened sharply in August, with the ZEW Economic Sentiment Index falling from 52.7 to 34.7, well below expectations of 40.0. Current Situation Index deteriorated further from -59.5 to -68.6, also missing forecasts of -63.0.
For the Eurozone as a whole, ZEW Economic Sentiment Index dropped from 36.1 to 25.1, missing the expected 28.4. The Current Situation Index fell by -7 points to -31.2.
ZEW President Achim Wambach said the decline was partly due to disappointment over the recently announced EU–US trade deal and Germany’s poor Q2 performance. He noted that the chemical, pharmaceutical, mechanical engineering, metal, and automotive industries are facing particular strain, worsening the forward-looking view.
UK payrolled employment falls again by -8k, pay growth eases slightly
UK labor market data for July showed a slight deterioration in employment alongside a modest easing in pay growth. Payrolled employment fell by -8k, or -0.0% m/m, marking a -0.5% yoy drop compared to the same period last year. The number of payrolled employees has been trending lower since peaking in 2024, highlighting a gradual cooling in hiring momentum. Median monthly pay growth slowed marginally to 5.7% yoy from 5.8% yoy, while the claimant count dropped by -6.2k, sharply better than expectations of a 20.8k increase.
In the three months to June, unemployment rate held steady at 4.7%, in line with forecasts. Wage growth metrics were mixed. Average earnings including bonuses slowed from 5.0% to 4.6% yoy, falling short of expectations for 4.7%. Earnings excluding bonuses were unchanged at 5.0% yoy, matching forecasts.
RBA cuts to 3.60%, rate track points to one more this year
RBA lowered the cash rate by 25bps to 3.60% as widely expected, with the decision passed on a unanimous vote. The new forecasts signaled room for one more cut this year, two in 2026, and a hike in 2027.
Updated economic projections showed inflation forecasts unchanged, with year-end CPI at 3.0% in 2025, 3.1% in 2026, and 2.5% in 2027. Trimmed mean inflation was also left steady at 2.6% for 2025 and 2026, easing to 2.5% in 2027.
The growth outlook, however, was revised notably lower. Year-average GDP growth for 2025 was cut from 1.9% to 1.6%, and for 2026 from 2.2% to 2.1%, with 2027 projected at 2.0%.
The forecasts are based on interest rate assumptions of 3.4% in 2025, 2.9% in 2026, and 3.1% in 2027 — implying scope for one more cut this year, two in 2026, followed a hike in 2027.
In its statement, RBA noted that uncertainty in the global economy remains elevated. While recent developments have brought “a little more clarity” on the scope of US tariffs and the policy responses from other countries, the Bank expects that “more extreme outcomes are likely to be avoided.”
Even so, trade policy uncertainty is still expected to weigh on global activity and inflation, with the risk that households and firms delay spending until there is greater clarity. The RBA said these effects will likely continue to drag on the Australian economy “for a period”.
NAB survey shows rising Australian business confidence, pockets of inflation pressure
Australia’s NAB Business Confidence index rose from 5 to 7 in July, and moving just above the long-run average of 5. NAB noted that confidence has been trending higher despite elevated global uncertainty.
Business Conditions slipped from 7 to 5, with weakness seen across all subcomponents. Trading conditions fell from 14 to 11, profitability from 4 to 2, and employment from 4 to 1. While the pullback follows strong gains in June, NAB noted conditions have retained much of last month’s improvement.
Price indicators highlighted ongoing inflationary pressures in pockets of the economy. Labor cost growth accelerated from 1.3% to 2.1% in quarterly equivalent terms. Purchase costs edged up from 1.3% to 1.5%. Final product price growth strengthened from 0.5% to 0.9%, and retail price growth climbed from 0.5% to 1.1%.
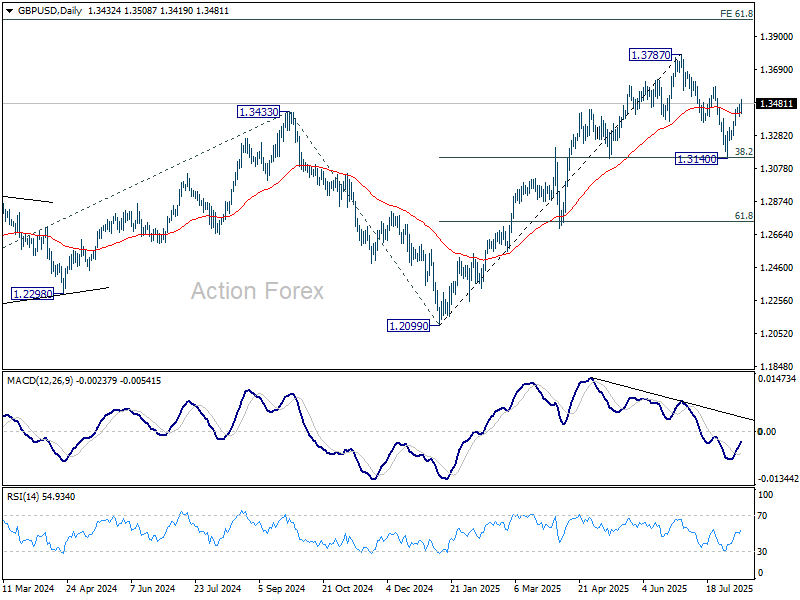
GBP/USD Mid-Day Outlook
Daily Pivots: (S1) 1.3396; (P) 1.3436; (R1) 1.3473; More...
GBP/USD's rise from 1.3140 resumed after brief retreat and intraday bias is back on the upside for 1.3587 resistance. Correction from 1.3787 should have completed with three waves down to 1.3140. Firm break of 1.3587 will bring retest of 1.3787 high. On the downside, below 1.3398 minor support will turn intraday bias neutral and dampen the bullish case.
In the bigger picture, up trend from 1.3051 (2022 low) is in progress. Next medium term target is 61.8% projection of 1.0351 to 1.3433 from 1.2099 at 1.4004. Outlook will now stay bullish as long as 55 W EMA (now at 1.3068) holds, even in case of deep pullback.
US core CPI jumps to 3.1% in July, headline unchanged at 2.7%
July CPI figures showed headline inflation unchanged at 2.7% yoy, missing expectations for a rise to 2.8% yoy. Core CPI accelerated to 3.1% yoy from 2.9% yoy, topping the 3.0% yoy forecast. The annual energy index dropped -1.6% yoy, offsetting a 2.9% yoy rise in food prices.
Month-on-month, CPI increased 0.2% and core CPI rose 0.3%, both matching consensus. Shelter prices gained 0.2% and was the largest contributor to the monthly increase, while the food index was flat and energy prices declined -1.1%.
The pickup in core pressures may keep the Fed cautious. While markets still expect a September rate cut, the uptick in core CPI could limit the pace of policy easing beyond that meeting.
UK Employment Cools, Pound Edges Higher, US CPI Expected to Tick Higher
The British pound is in positive territory on Tuesday. In the European session, GBP/USD is trading at 1.3461, up 0.22% on the day. The pound has jumped 1.9% in August and touched a high of 1.3476 on Monday, its highest level since July 25.
Job openings drop, wage growth steady
The UK labor market continues to cool. Job openings fell by 5.8% across most industries and the nunber of payrolled employeees also declined. However, the slowdown was not as bad as expected and didn't boost the unemployment rate, which remained at 4.7%.
The labor market is feeling the effect of higher employer national insurance contributions and a rise in the minimum wage, as employers continue to cut back on hiring.
The Bank of England has been cautious in its rate path and last week's cut was only the second this year. The split vote at the rate meeting reflects the conundrum that Bank policymakers face regarding rates - the UK economy is weak and the labor market is slowing, but inflation has been moving higher. The Bank is expected to cut rates again in November but that will depend on the employment and inflation numbers.
US inflation expected to hit to 2.8%
The US releases the July inflation report later today. Inflation is is expected to inch higher to 2.8% y/y, up from 2.7% y/y in June. This would mark a third straight acceleration and the highest inflation level since February. Core CPI is also expected to accelerate to 3.0%, up from 2.9%.
Monthly, CPI is projected to ease to 0.2% from 0.3%. Core CPI is projected to rise to 0.3% from 0.2%.
Today's inflation report could shift market expectations for the September Fed meeting but a Fed cut will likely remain on track. The markets have currently priced in the likelihood of a rate cut at 84%, according to FedWatch's CME.
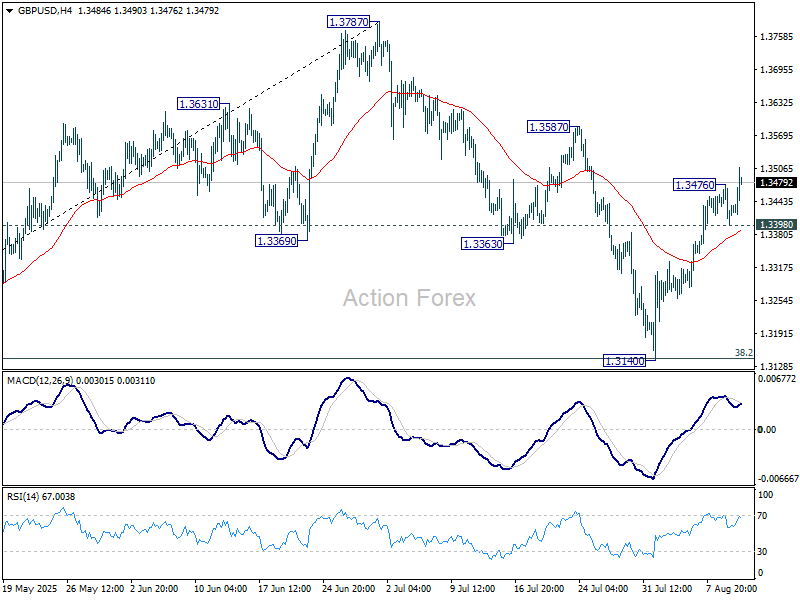
GBP/USD Technical
- GBP/USD has pushed above resistance at 1.3436 and is testing 1.3453. Next, there is resistance at 1.3487
- 1.3402 and 1.3385 are providing support
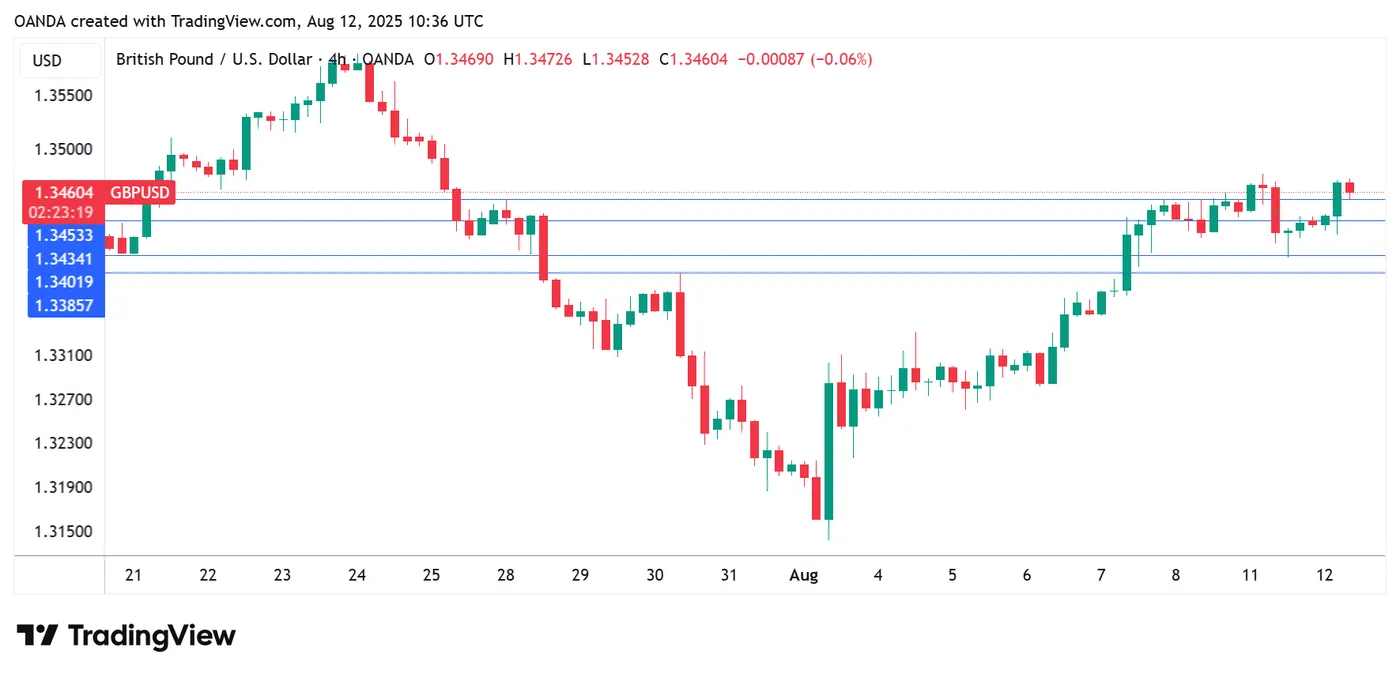
GBPUSD 4-Hour Chart, Aug. 12, 2025
RBA Lowers Rates, Aussie Dips Lower, US CPI Expected to Rise
The Australian dollar is lower on Tuesday. In the European session, AUD/USD is trading at 0.6494, down 0.29% on the day.
RBA cuts rates to 3.60%
The Reserve Bank of Australia lowered the cash rate by a quarter-point on Tuesday in a unanimous decision, bringing the cash rate to 3.60%. This is the lowest level since April 2023 and today's cut was the third this year.
This time around the RBA didn't shock the markets, unlike the July meeting when the RBA held rates and said it needed to see additional inflation data before lowering rates.
The rate statement began by noting that inflation has "fallen substantially" since 2022 and that inflation had fallen back within the target band of 2%-3% in the second quarter.
The Board noted that headline inflation was at 2.1% and trimmed mean (a key core CPI gauge) was at 2.7%. The Board said that underlying inflation is expected to continue to ease to the midpoint of the target band and the cash rate should continue to follow a "gradual easing path".
This dovish tune in the statement was balanced out by concerns that uncertainty remains in both the global economy and at home. The Board said it would remain cautious and would remain focused on price stabililty and employment.
At a post-meeting press conference, Governor Bullock said that the growth and inflation forecasts support further rate cuts but "there is still a lot of uncertainty" and future rate decisions would be data-dependent.
US inflation expected to rise to 2.8%
The US releases the July inflation report later today. Inflation is expected to nudge higher to 2.8% y/y, up from 2.7% y/y in June. This would mark a third straight acceleration and the highest inflation level since February. Core CPI is also expected to accelerate to 3.0%, up from 2.9%
Monthly, CPI is projected to ease to 0.2% from 0.3%. Core CPI is projected to rise to 0.3% from 0.2%.
Today's inflation data could shift market expectations for the September Fed meeting but the decision will very likely be rate cut, with a current likelihood of 84%, according to FedWatch's CME.
AUD/USD Technical
- AUD/USD is testing support at 0.6500. Below, there is support at 0.6483
- 0.6500 and 0.6527 are the next resistance lines
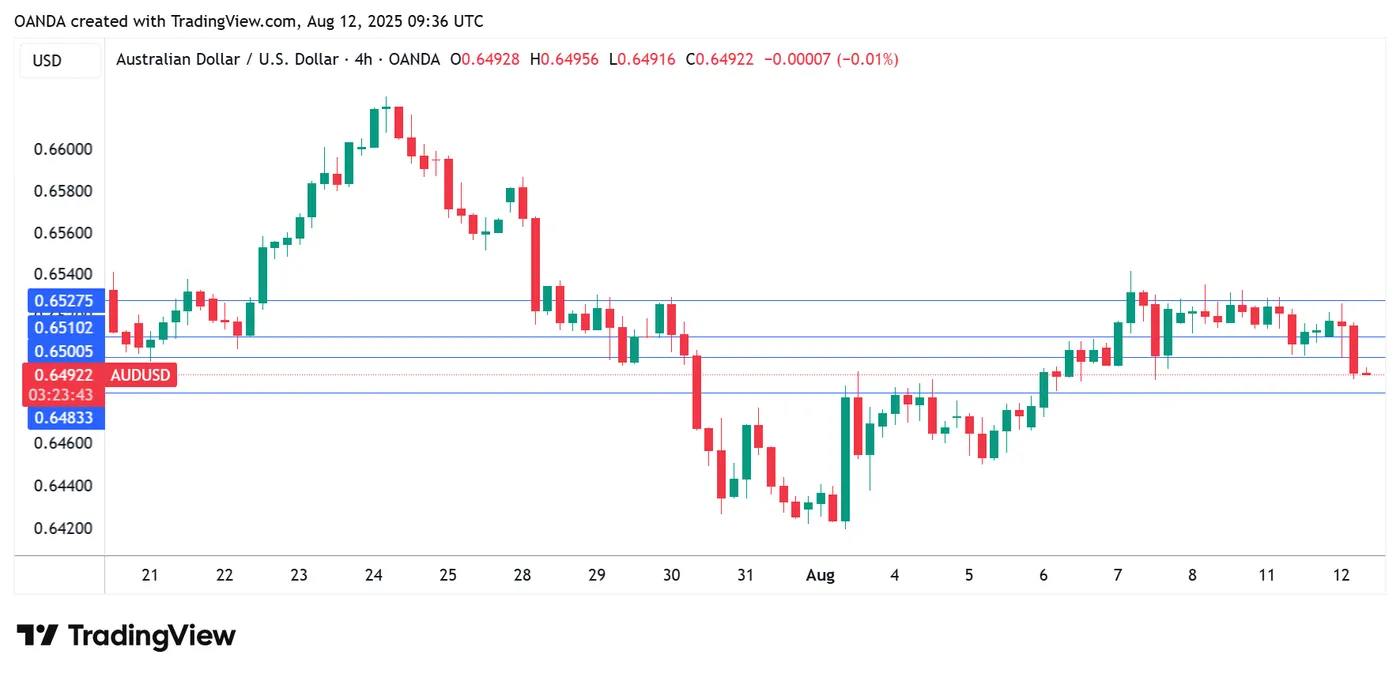
AUDUSD 4-Hour Chart, Aug. 12, 2025
German, Eurozone ZEW sentiment slides sharply in August
German investor sentiment weakened sharply in August, with the ZEW Economic Sentiment Index falling from 52.7 to 34.7, well below expectations of 40.0. Current Situation Index deteriorated further from -59.5 to -68.6, also missing forecasts of -63.0.
For the Eurozone as a whole, ZEW Economic Sentiment Index dropped from 36.1 to 25.1, missing the expected 28.4. The Current Situation Index fell by -7 points to -31.2.
ZEW President Achim Wambach said the decline was partly due to disappointment over the recently announced EU–US trade deal and Germany’s poor Q2 performance. He noted that the chemical, pharmaceutical, mechanical engineering, metal, and automotive industries are facing particular strain, worsening the forward-looking view.
Nikkei 225 Index Sets All-Time Record
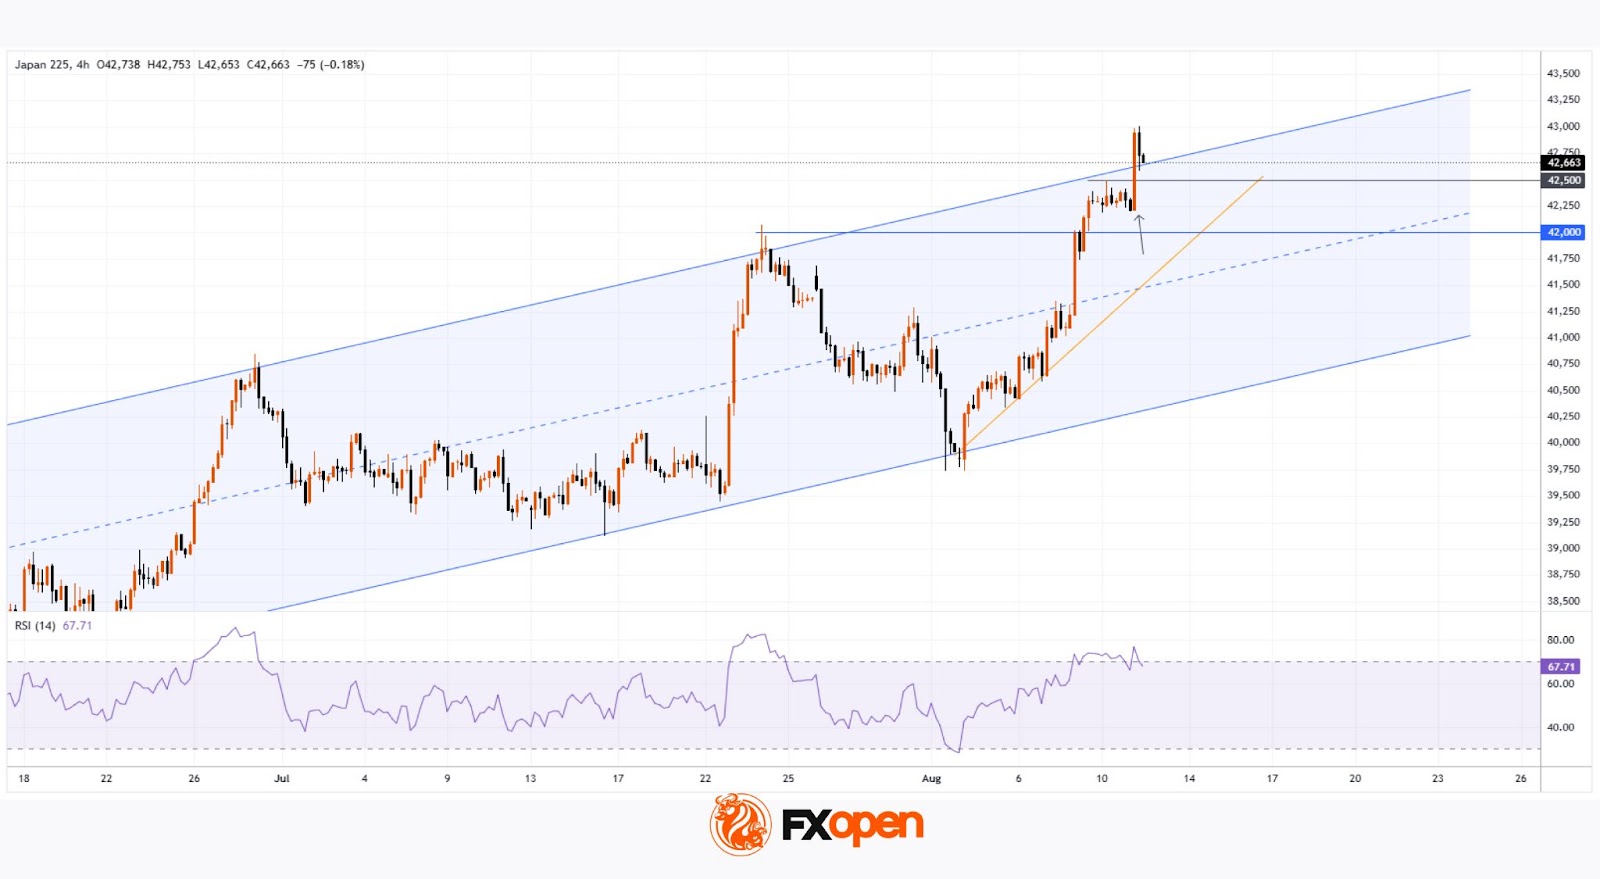
As the chart shows, the Nikkei 225 stock index (Japan 225 on FXOpen) rose today to the 43,000-point level, thereby:
→ surpassing its 2024 peak;
→ setting a new all-time high.
Bullish sentiment has been driven by strong quarterly earnings reports from Japanese companies and expectations regarding the Bank of Japan’s monetary policy. Optimism was further reinforced by news of extended trade negotiations between the United States and China. According to Reuters, the decision to prolong the tariff truce between the world’s two largest economies by a further 90 days has improved the outlook for global trade.
Technical Analysis of the Nikkei 225 Chart
Earlier this month, we:
→ identified an ascending channel formed by price fluctuations in 2025;
→ suggested that bullish momentum would likely be sufficient to attempt a breakout above the 42k level;
→ noted that optimism might wane if the price approached the channel’s upper boundary.
Since then:
→ the channel has remained valid, as has the intermediate trendline (marked in orange) of the uptrend;
→ following a brief consolidation, the price broke above the 42,500 level on a long bullish candle.
However, the subsequent bearish candles appear to signal the start of a short-term correction, which is reasonable given the RSI indicator’s overbought reading. In this scenario, the correction could extend, for example, to the 42,000 level – a psychological mark where the 2025 high had previously been located.
In the longer term, a bearish scenario cannot be ruled out. Note the candle marked with an arrow: although it appears strongly bullish at first glance, the sharp surge could be linked to a buying climax and the beginning of a distribution phase (as per Richard Wyckoff’s theory).
Given that the index is at record highs, major market participants may use the positive news flow to lock in profits and sell assets at elevated prices. Confidence in this hypothesis would be reinforced if today’s sharp rise is soon reversed, signalling the bulls’ failure to maintain control at these record levels.
Trade global index CFDs with zero commission and tight spreads. Open your FXOpen account now or learn more about trading index CFDs with FXOpen.
This article represents the opinion of the Companies operating under the FXOpen brand only. It is not to be construed as an offer, solicitation, or recommendation with respect to products and services provided by the Companies operating under the FXOpen brand, nor is it to be considered financial advice.
Nikkei 225 Update: Bullish Impulsive Sequence Intact, New Resistance Levels to Watch After New All-Time High
The Japan 225 CFD Index (a proxy of the Nikkei 225 futures) has staged the expected bullish move and rallied by 5.5% since our last publication on 6 August, cleared above its prior all-time high of 42,513 printed in July last year, and hit a fresh record high of 43,009 in today’s Asia session led by banking stocks.
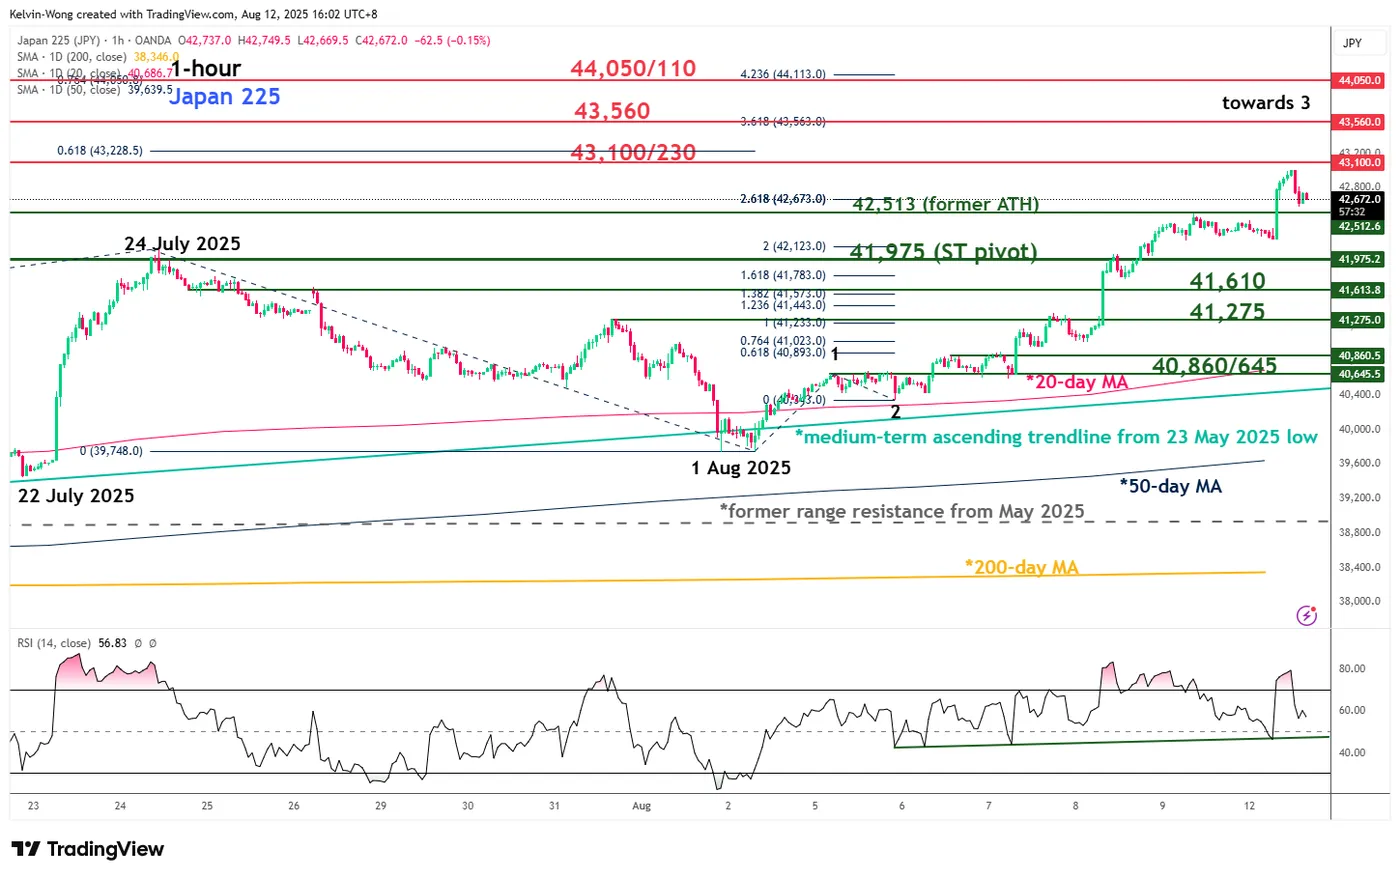
Fig. 1: Japan 225 CFD Index minor trend as of 12 Aug 2025 (Source: TradingView)
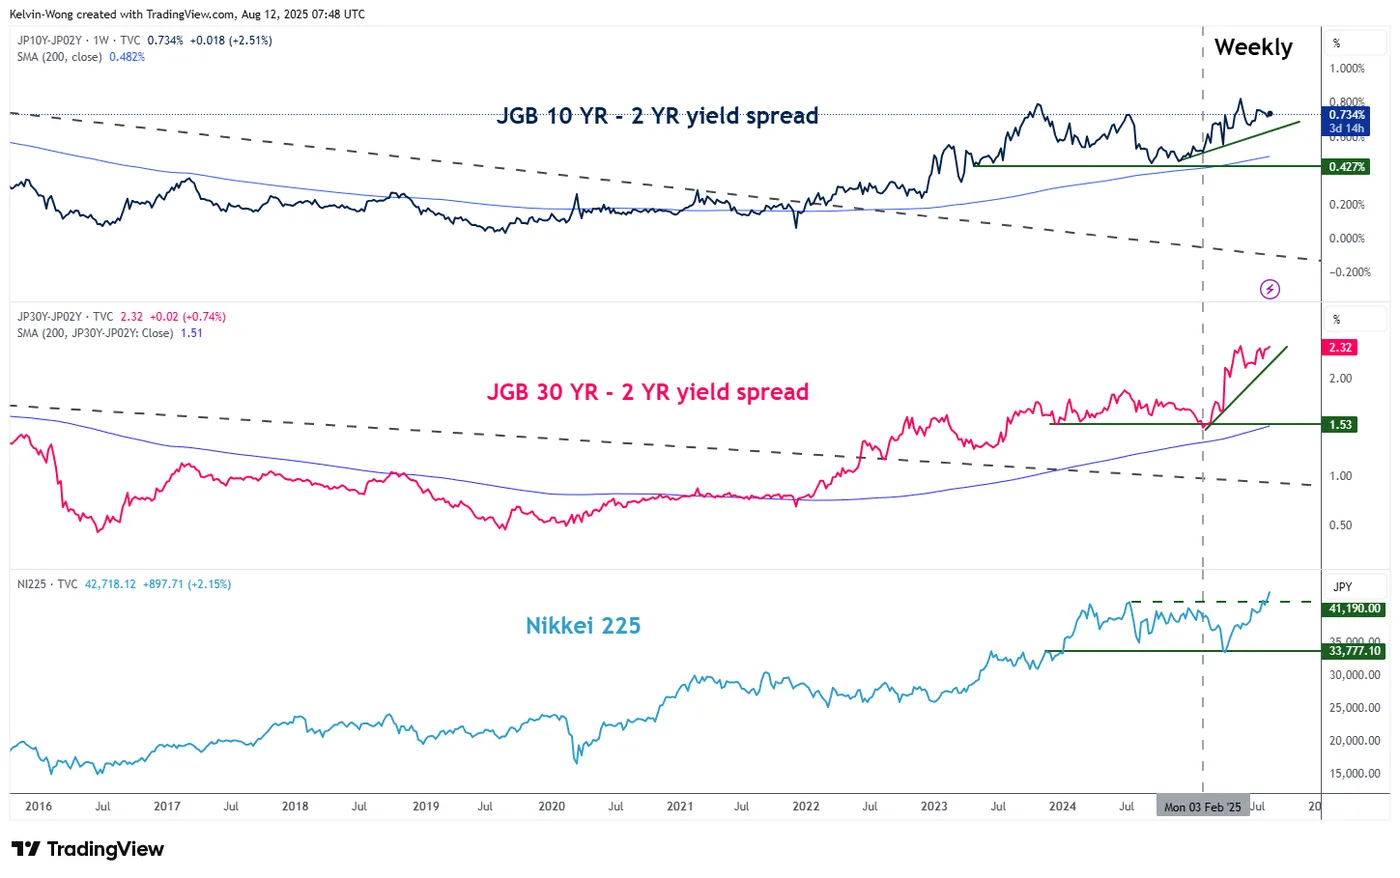
Fig. 2: JGB yield curves (30-YR/2-YR & 10-YR/2-YR) major trends as of 12 Aug 2025 (Source: TradingView, click to enlarge chart)
Preferred trend bias (1-3 days)
Maintain a bullish bias above a tightened short-term pivotal support at 41,975 for the Japan 225 CFD Index, and a clearance above 43,230 sees the next intermediate resistances coming at 43,560 and 44,050/44,110 (Fibonacci extension cluster levels) (see Fig. 1).
Key elements
- Based on the Elliot Wave Principle, the current short-term bullish impulsive up move sequence from its 1 August 2025 low of 39,749 is advocating a potential wave 3 extension to the upside for the Japan 225 CFD Index.
- The hourly RSI momentum indicator of the Japan 225 CFD Index is still exhibiting a short-term bullish momentum condition as it stays above a parallel ascending trendline support at the 47 level.
- The major bullish breakout (steepening conditions) of the JGB yield curves since June 2022 has a direct correlation with the movements of the Nikkei 225, and the major uptrend phases of the JGB yield curves remain intact so far, in turn, may trigger a positive feedback loop into the Nikkei 225 (see Fig.2).
Alternative trend bias (1 to 3 days)
Failure to hold at the 41,975 key short-term support negates the bullish tone to kickstart a minor corrective decline to expose the next intermediate supports at 41,610 and 41,275.
EUR/USD Under Pressure All Eyes on US Inflation Data
The EUR/USD pair dipped to 1.1620 on Tuesday following sharp swings in the previous session. Investors are bracing for the release of US inflation data, which could reshape expectations for the Federal Reserve’s interest rate policy.
The July CPI is forecast to rise by 0.2% month-on-month, down from 0.3% in June, while the annual rate is expected to climb for a third consecutive month to 2.8%. The core index is expected to remain steady at 0.3% month-on-month.
Despite persistent inflationary pressures, markets are pricing in a near-90% probability of a Fed rate cut in September.
On the trade front, President Donald Trump has extended the truce with China by another 90 days to allow further negotiations. Another key focus is Trump’s upcoming meeting with the Russian president on Friday, where discussions are expected to focus on a ceasefire agreement.
Aside from the US inflation figures, traders are awaiting the ZEW Eurozone Economic Sentiment Index for August, which is projected to rise to 30.0 points, up from 28.1 previously. Later in the day, Fed officials are scheduled to speak, potentially offering further clues on monetary policy.
Technical Analysis: EUR/USD
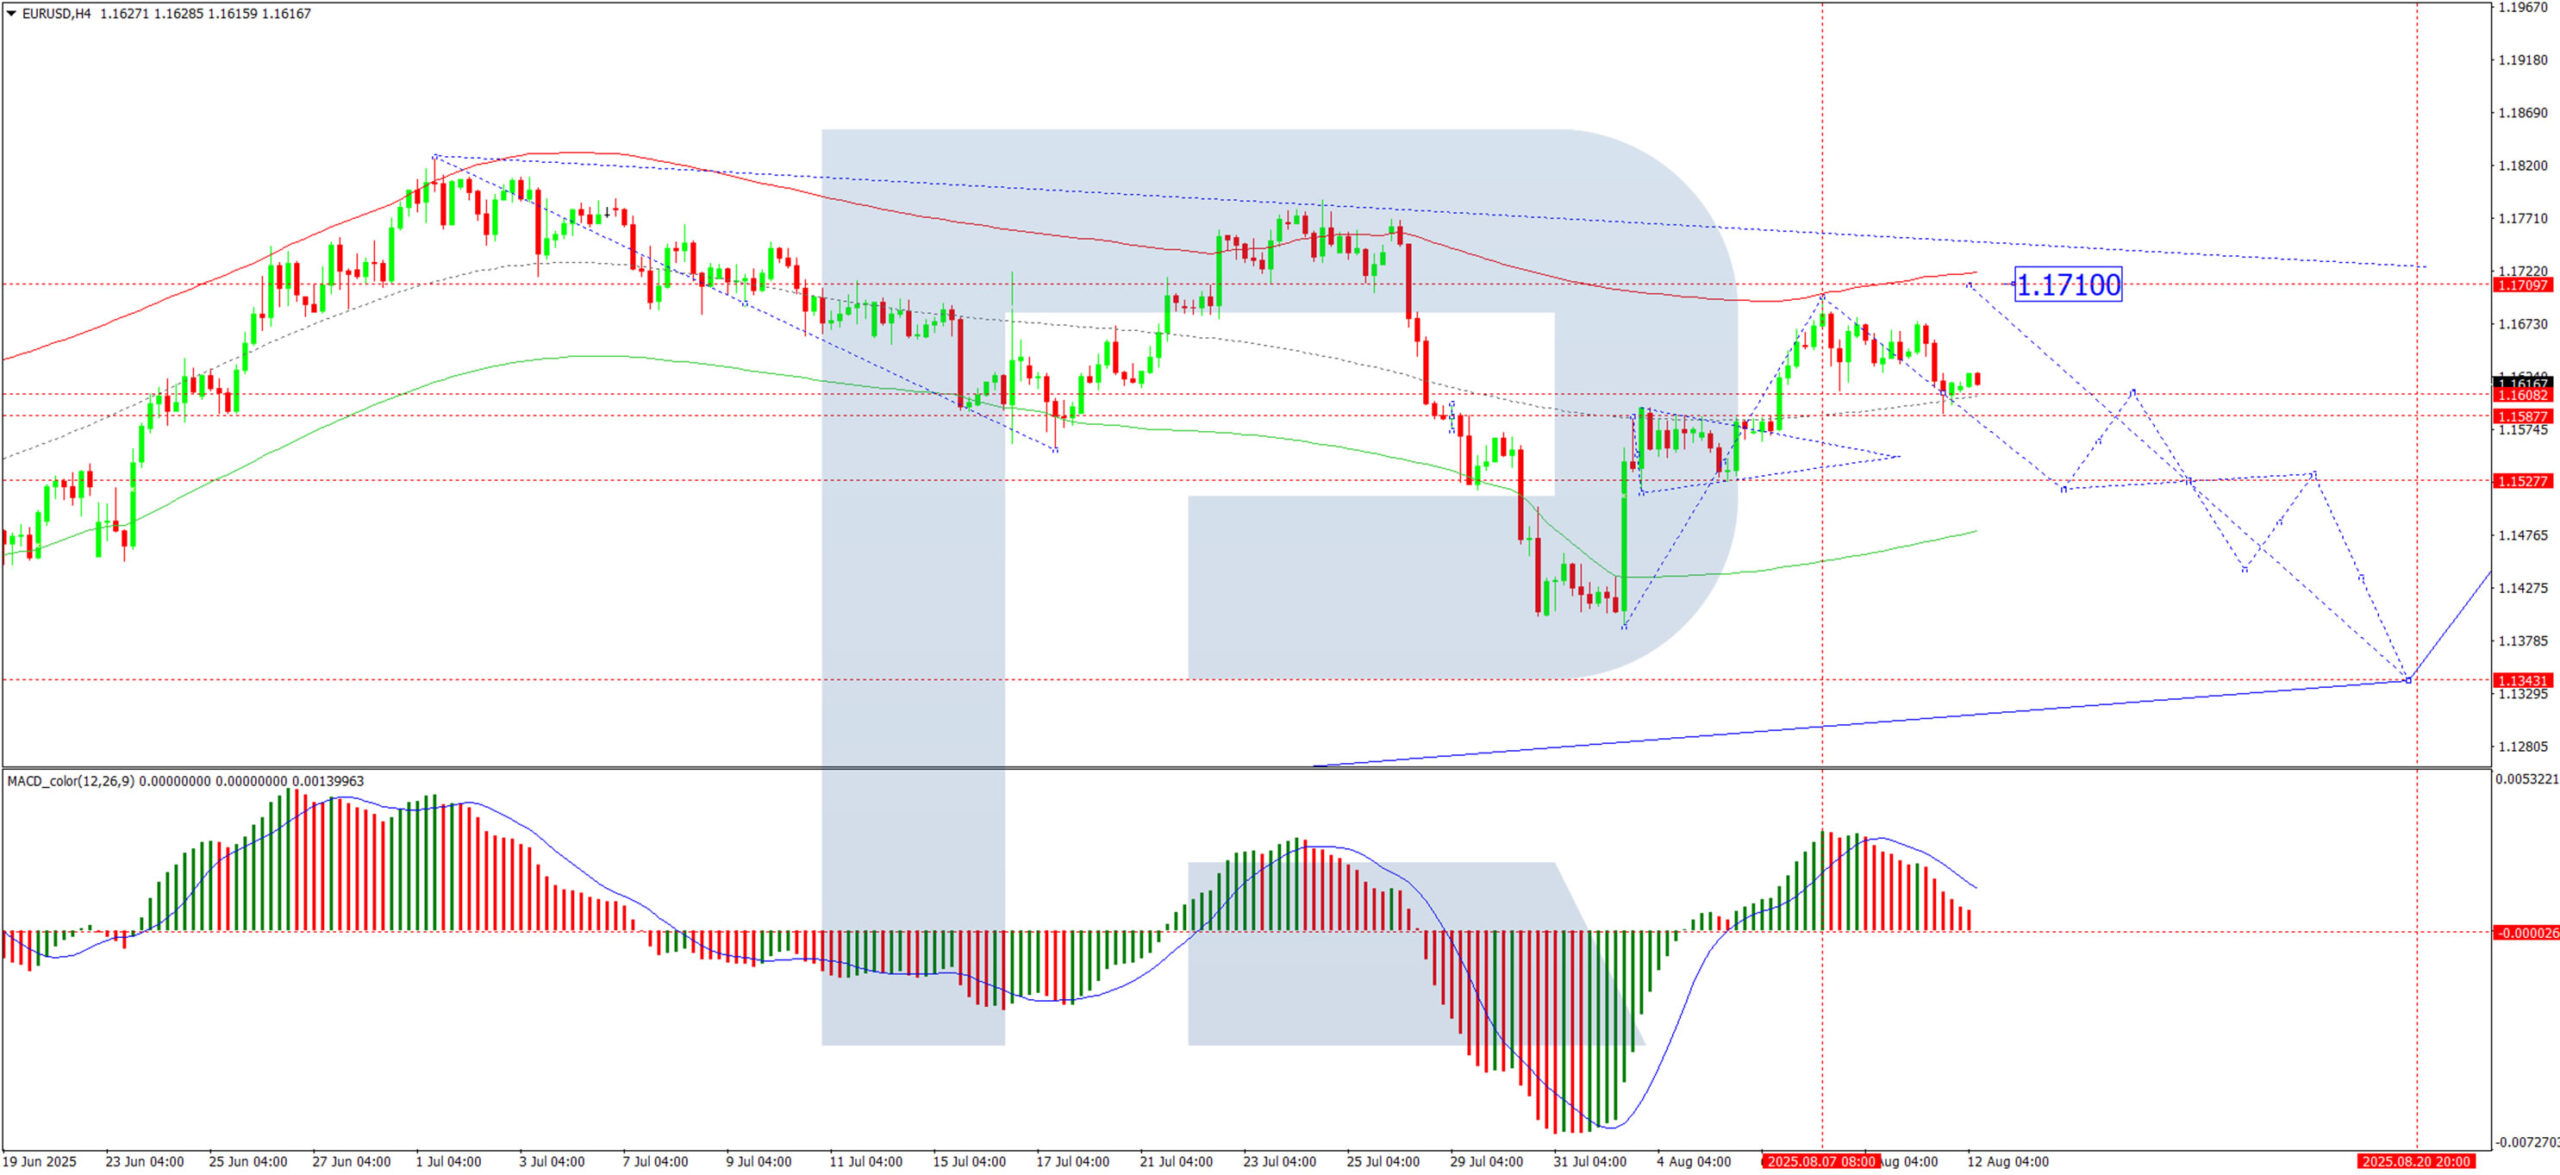
H4 Chart:
The EUR/USD is currently consolidating near the top of its corrective phase. A break below 1.1611 could trigger a downward wave, targeting 1.1520, with potential for an extended decline towards 1.1343. This bearish scenario is supported by the MACD indicator, where the signal line remains above zero but is pointing sharply downwards.
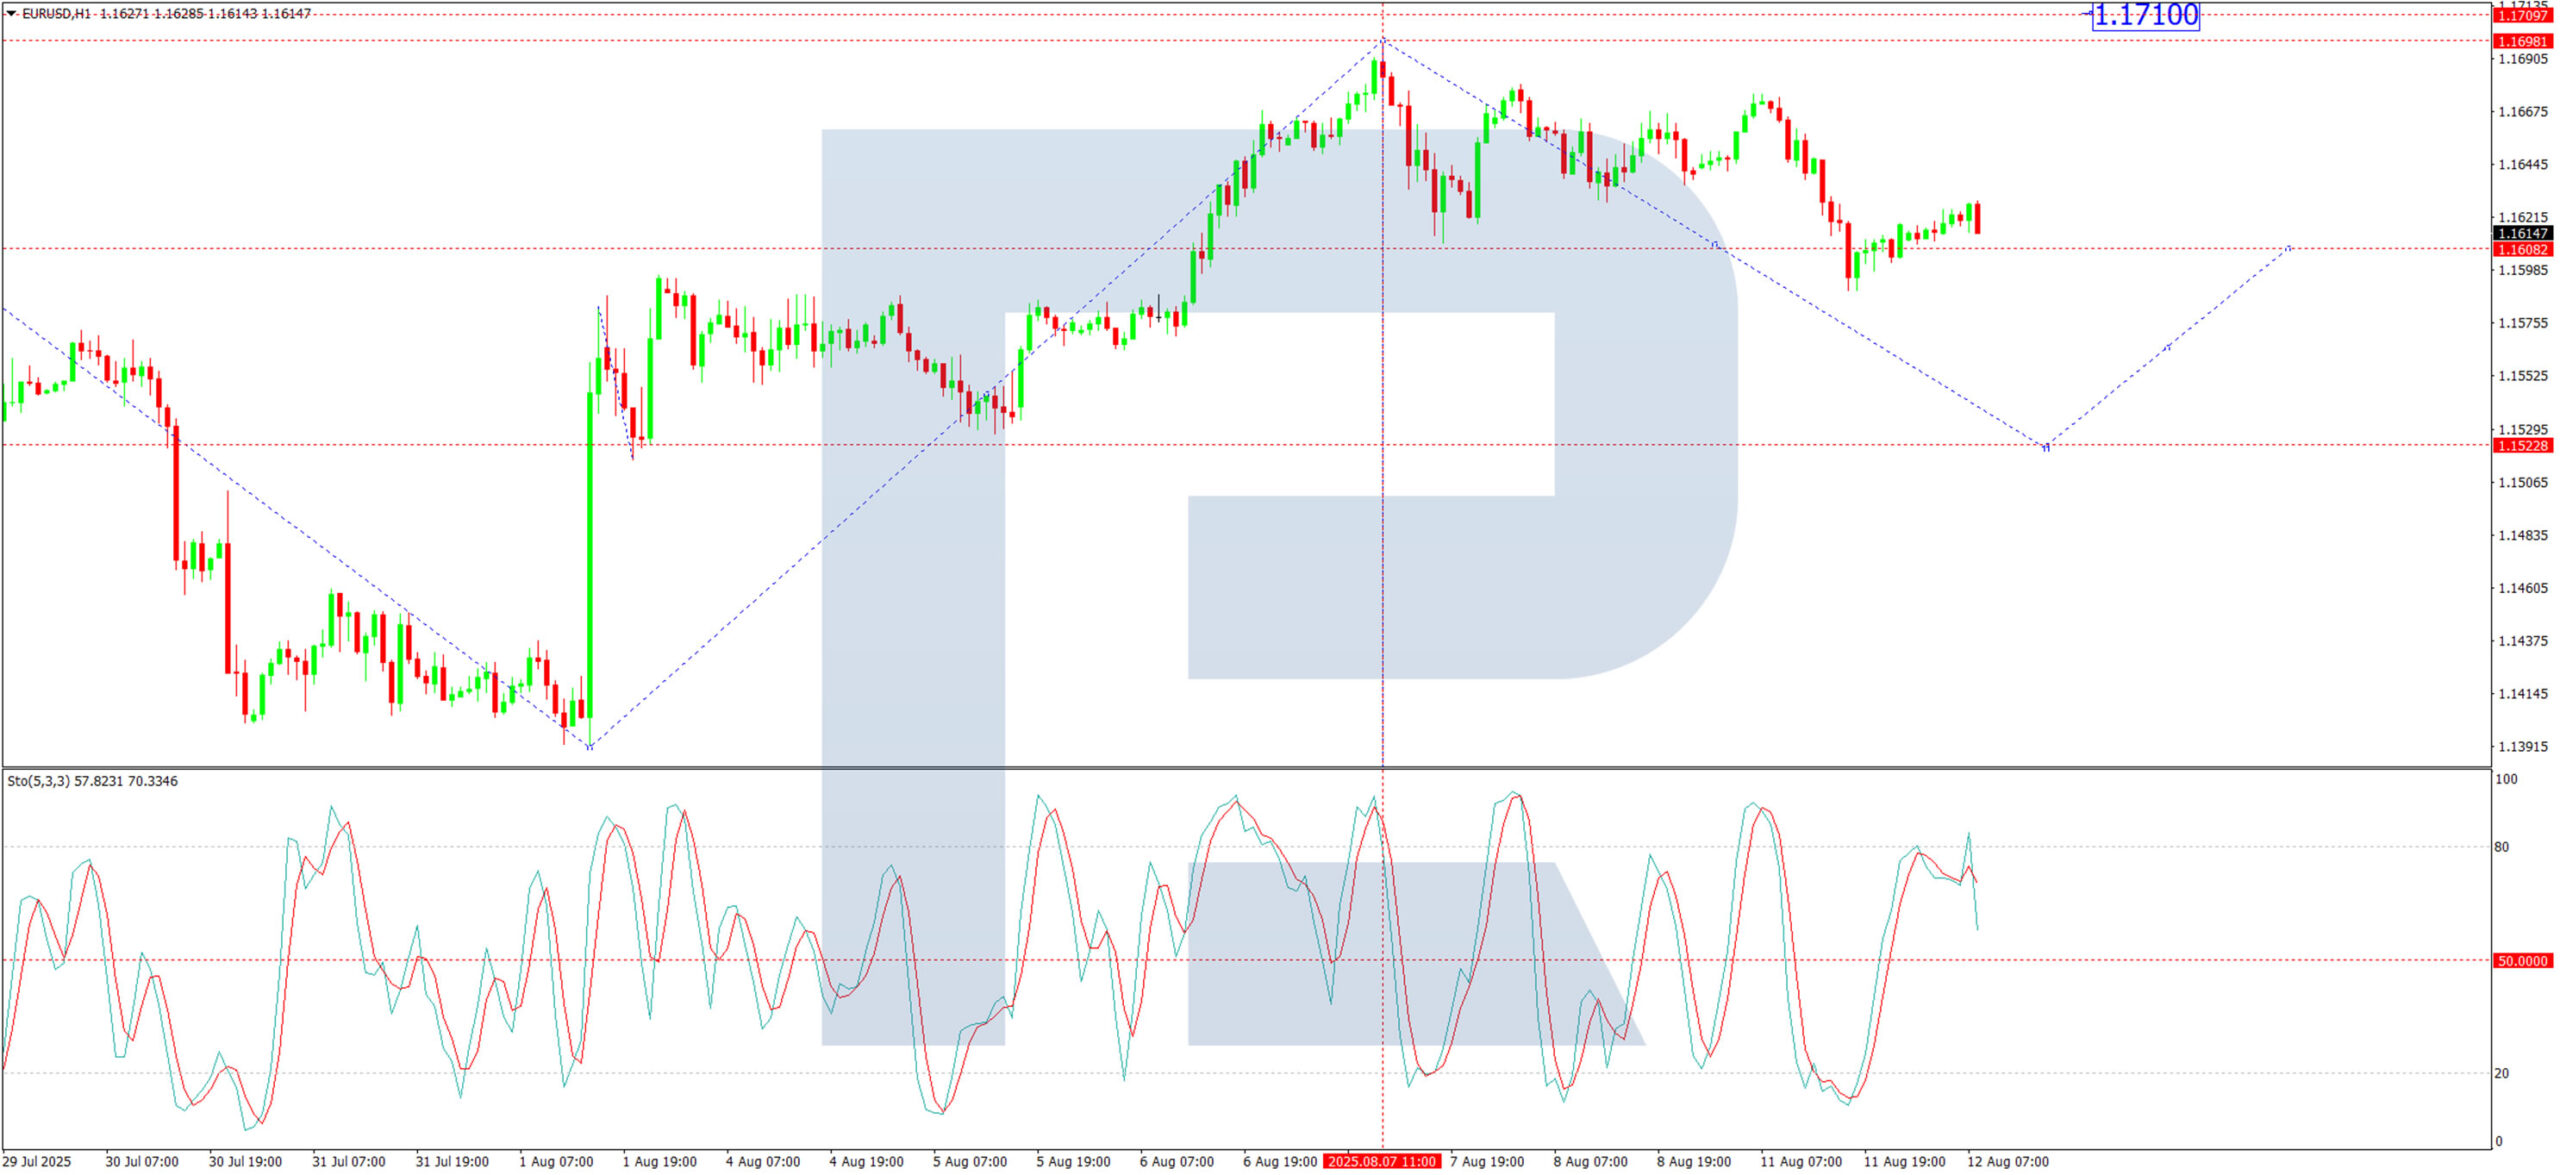
H1 Chart:
The pair has completed a downward impulse to 1.1611, followed by a rebound to 1.1679, effectively setting a consolidation range. Today, traders should watch for a downside breakout, potentially initiating a fifth downward wave towards 1.1520. A brief retest of 1.1611 (from below) could be followed by further declines to 1.1444, with an eventual target of 1.1343. The Stochastic oscillator reinforces this outlook, with its signal line below 80 and trending downwards towards 20.
Conclusion
With US inflation data in focus, the EUR/USD remains vulnerable to further downside. A break below 1.1611 could accelerate selling pressure, while any surprises in the CPI figures may prompt a reassessment of Fed rate expectations.
RBA Cuts Cash Rate in Evolution, Not Revolution, of Views
RBA cuts cash rate 0.25ppts to 3.6%, with more cuts assumed to be needed to keep inflation at target. Worst-case outcomes on global trade have been avoided, but RBA is now more pessimistic about near-term growth in output and productivity.
- The RBA Monetary Policy Board (MPB) cut the cash rate by 0.25ppts to 3.6% following its August meeting as widely expected. With underlying inflation clearly inside the 2–3% target range and heading towards its 2½% midpoint, the need for restrictive monetary policy is dissipating. The updated inflation forecasts are largely unchanged but show a 2.5% at the end of the (extended) forecast horizon to December 2027.
- The RBA’s forecasts are predicated on further cuts to the cash rate as expressed by market pricing last week. The trough rate implied by this assumption is now sub-3%, consistent with our own view. In the press conference, the Governor did not rule out back-to-back cuts and emphasised that the MPB would take things meeting by meeting. The every-other-meeting pace implied by our own recent forecasts still seems a reasonable base case, though.
- The RBA has downgraded its near-term view of trend productivity growth, and hence GDP growth. Importantly, this does not imply a downgrade to the long-run trend. In addition, the RBA has moved away from its view of a year ago that slow productivity growth presented an upside risk to inflation.
Today’s decision by the MPB to cut the cash rate was widely anticipated. Inflation is at target and likely to stay there. The labour market has eased further, though the statement still characterises it as ‘a little tight’. It was hard to construct a scenario where the information flow between the July and August meetings would have made the MPB want to keep rates on hold in August. Nonetheless, the benign print for Q2 underlying inflation and slight pick-up in unemployment were as expected. This helped ‘seal the deal’ and gave the six MPB members who had previously wanted to wait the evidence they needed to be comfortable cutting the cash rate in August. They joined the three who had voted for a cut in July for a unanimous vote this time, as we expected.
The evolution in the RBA’s views since May, as expressed in its forecasts, has been fairly minor. The unemployment forecast is unchanged, implying no further increases in the unemployment rate from here. At these levels, the RBA assesses that ‘some tightness remains’ in the labour market. This benign outcome is vulnerable to labour supply rising faster than working-age population growth, given the multi-decade trend increase in female participation.
The forecasts for trimmed mean inflation now show a 2.5% for end-2027, the additional period as the forecast horizon rolls forward with time. But the flat-as-a-pancake 2.6% rate remains the forecast for the whole period covered by the May forecasts. Within the total, housing-related inflation is expected to be a little higher than previously forecast, while traded goods inflation could be a little lower, given slower global growth amid trade disputation.
The SMP highlights that trade patterns have adapted to US tariffs relatively smoothly, even though tariff rates have landed somewhat higher than assumed a few months ago. In particular, the Chinese economy has remained resilient; a key judgement in the forecasts – which we share – is that the Chinese authorities will continue to use policy stimulus to ameliorate the impact from trade restrictions and ongoing US policy uncertainty.
The forecasts for public demand and consumption have been lowered relative to the May forecasts. However, both are still expected to pick up over the next couple of years. The SMP points to government budgets in support of a view that the weakness in public demand will be temporary. Lower interest rates and some positive real income growth will both support consumption growth, as also implied by our own forecasts.
The revised RBA forecasts are predicated on the cash rate declining further from here, with the implied trough at 2.9% in 2026, similar to our own expectations. In the media conference, the Governor highlighted that a couple more rate cuts were necessary to achieve the current forecasts and keep inflation at target. She also noted that holding rates constant from here would result in inflation falling below the target midpoint. The Governor did not rule out back-to-back cuts and emphasised that the MPB would take things meeting by meeting. The every-other-meeting pace implied by our own recent forecasts still seems a reasonable base case, though.
RBA productivity view finally catches up to Bank of Canada
The main change in the RBA’s views relates to GDP growth and productivity. Specifically, the RBA has revised down its assumption on trend productivity growth from around 1%yr to 0.7%yr, citing consistently lower outcomes than expected recently. The forecast for GDP has been revised down proportionally, though a pick-up in growth is still expected over the next couple of years.
The SMP devoted an entire chapter to explaining the change. Some of the recent weakness in productivity was acknowledged as being due to industry-specific factors that will unwind. These are the increased share of the non-market sector and the decline in mining productivity that Westpac Economics has been flagging for some time; the RBA’s quantitative estimates of the drag align with our own previously published estimates. However, the trend growth rate that the RBA expects productivity to converge to as these factors unwind is now this lower 0.7%yr rate. In the media conference, the Governor characterised the change as being a fix to a ‘puzzle’, whereby their inflation and unemployment forecasts turns out to be roughly correct, but GDP and wages growth both turned out to be weaker than forecast.
One consequence of the revised view of trend productivity growth is that the RBA’s view of potential or trend output growth over the next couple of years is also lower now. To put this in perspective, the downgrade to trend GDP is similar to the one implied by population growth being lower (1.2%–1.3%) in the forecast period than the 1.5%–1.6% range seen in the years leading up to the pandemic. The differences relate to the implications for (per person) living standards.
The recognition that productivity growth has been slower in recent decades than it was in the IT-boom of the late 1990s is not new (see this 2021 speech and this 2023 Bulletin article). It is also not Australia-specific but relates to a range of global factors, including the level of business dynamism, competition and adoption of technology. The downgraded RBA forecasts for business investment – and thus growth in the capital stock – have particular salience for this issue. These were reduced by more than GDP growth was, in recognition that slower demand growth lowers the return to future investment. This points to a disturbing path-dependence of lower growth begetting even less future supply capacity. If true, it would make a policy mistakes of keeping policy too tight even more problematic.
Importantly, the RBA does not assume that the weaker trend for the next couple of years necessarily implies that the long-term trend growth in productivity (and hence potential output growth) will be low. This would have been a big call given the current optimism around AI and other technologies and their implications for productivity growth.
What is new is that the RBA explicitly states that this reassessment has no implications for inflation. All the hand-wringing a year ago about wages growth being too fast given trend productivity growth turned out to be misplaced. The explicit assumption now is that households and businesses have (likely subconsciously) adapted to slower productivity growth, which is why wages growth is slower. This is exactly how the Bank of Canada framed the issue more than a year ago. Accordingly, this change in view has not boosted the inflation forecasts, but if anything has reduced the RBA’s views of upside risks to inflation from this source and made it less nervous about further rate cuts.
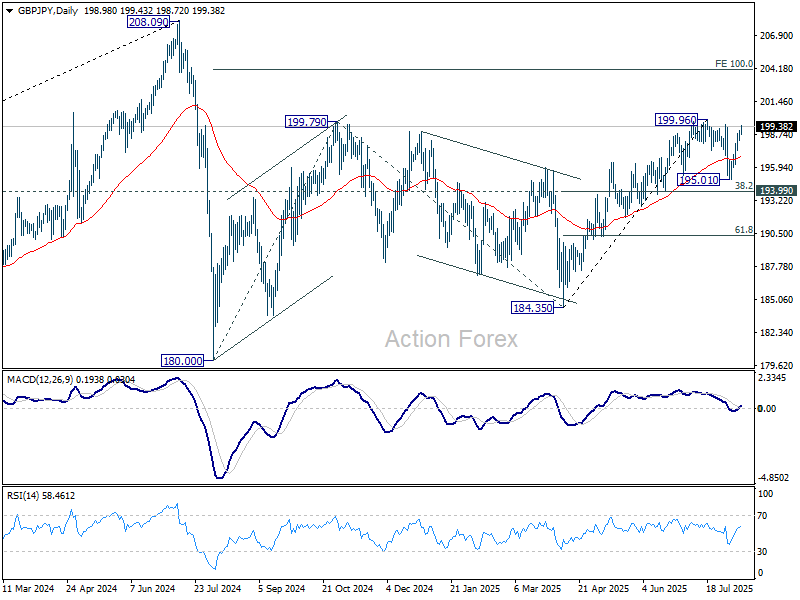
GBP/JPY Daily Outlook
Daily Pivots: (S1) 198.41; (P) 198.74; (R1) 199.30; More...
Intraday bias in GBP/JPY remains on the upside for the moment. Decisive break of 199.96 will resume whole rise from 184.35. Next target is 100% projection of 180.00 to 199.79 from 184.35 at 204.14. On the downside, below 198.16 minor support will delay the bullish case and turn intraday bias neutral again.
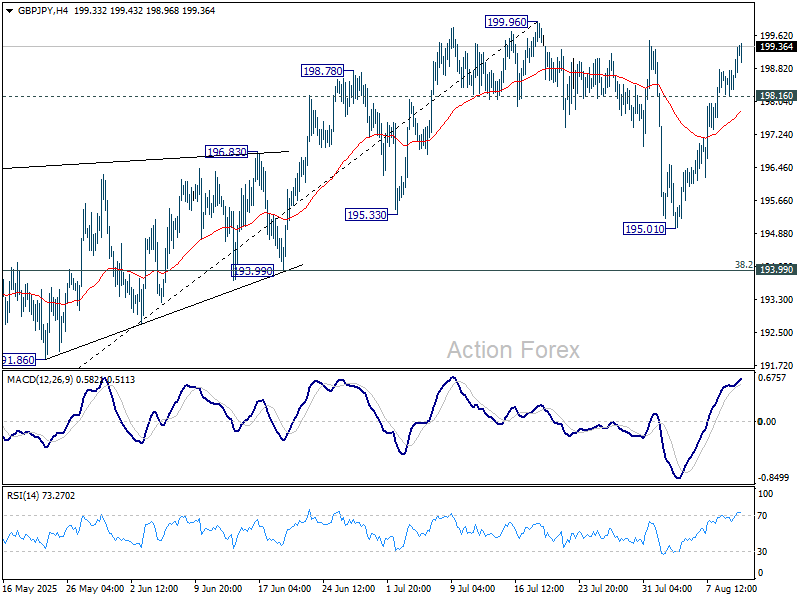
In the bigger picture, price actions from 208.09 (2024 high) are seen as a correction to rally from 123.94 (2020 low). The pattern might still extend with another falling leg. But in that case, strong support should be seen from 38.2% retracement of 123.94 to 208.09 at 175.94 to contain downside. Meanwhile, decisive break of 208.09 will confirm long term up trend resumption.