
Sample Category Title
Dollar Lost Out Against Euro
Markets
Monthly headline and core US CPI inflation printed bang in line with expectations at respectively +0.2% M/M and +0.3% M/M yesterday. Annual reading showed a stabilization on the overall level (2.7% Y/Y) and an increase from 2.9% Y/Y to 3.1% Y/Y for the core gauge (matching highest level since January 2025). More importantly from a market point of view: the publication lacked feared evidence of tariff inflation. Core goods prices excluding new vehicles and used cars and trucks rose by 0.22% M/M, less than half the 0.55% M/M pace in June (highest since early 2022). With two out of “three critical Summer CPI reports” (dixit Fed Chair Powell) out of the way, markets become more confident that the Fed will pull the policy normalization card when it meets next in September. Especially as activity and labour market data point to growing downside risks to the Fed’s maximum employment mandate. A 25 bps rate cut is now fully discounted. If activity data continue to disappoint in coming weeks (eg retail sales on Friday), we err on the side of money markets starting to contemplate the possibility of the Fed pulling a 50 bps rate cut like they did in September of last year. The option was yesterday floated by US Treasury Secretary Bessent as well. The US yield curve steepened yesterday. Short-term yields lost up to 3.8 bps (2-yr) while the very long end of the curve gained 2.6 bps. European and UK yield curves steepened as well, in bearish fashion and without specific trigger. The move started somewhat after the US CPI release. German yields rose by 0.3 bps (2-yr) to 7.3 bs (30-yr) with the German 30-yr yield taking out technical resistance (2023 & 2025 highs at 3.26%) to close at the highest level since 2011 (3.3%). UK yields added 2.2 bps (2-yr) to 7.5 bps (30-yr) with the very long end of the curve (5.47%) closing in on 5.6% resistance. We keep a close eye on this move as it fits in our medium term bearish view on bonds because of the return of term premia. In FX space, the dollar lost out against the euro. EUR/USD spiked from 1.16 to 1.1650 on the CPI-release but suffered follow-up losses towards the high 1.16-area. The greenback(‘s credibility) got further eroded by Trump’s suggestion that he is weighing a lawsuit against Fed Chair Powell over the renovation of the central bank’s headquarters. The latter is a judicial route Trump is exploring to get rid off Powell. The dollar faced more pressure after Trump’s pick as new commissioner for the Bureau of Labour Statistics floated the idea of pausing the monthly payrolls releases amid accuracy concerns. Until it is corrected, he suggested publishing more accurate though less timely quarterly numbers. US stock markets extended their record races with gains of over 1% on the prospect of a less restrictive Fed policy.
Risk sentiment remains positive in Asia this morning. Japanese bonds underperform after a weak 5-yr government bond auction. Today’s empty eco calendar suggests markets will stick to yesterday’s themes (weaker dollar, steeper curves). Tomorrow and on Friday, more US eco data will help shape Fed expectations with PPI inflation and weekly jobless claims tomorrow and the empire manufacturing survey, retail sales and the University of Michigan consumer confidence survey (including inflation expectations measures) on Friday.
News & Views
OPEC yesterday raised next year’s oil demand growth forecast from 1.3 mb/d to 1.4 mb/d. This year’s expectation was unaltered at 1.3 mb/d (y/y). The revision comes on the back of supportive economic activities. OPEC sees global economic growth of 3% this year and 3.1% in 2026. Some upward revisions were made for the US (1.8%-2.1%), the eurozone (1.2%-1.2%) and China (4.8%-4.5%). Oil supply forecasts outside the Organization of the Petroleum Exporting Countries were downwardly revised from for 2026 from 0.7 mb/d to 0.6 mb/d while this year’s forecast remained steady at 0.8 mb/d. Data from yesterday’s monthly oil market monitor thus suggest a tighter market next year with rapidly depleting oil inventories around the world (1.2 mb/d) unless OPEC continues scaling up previously halted production. We must add that OPEC forecasts of late have been a lot more bullish than other industry prognosis made for example the International Energy Agency.
Cut that Rate
Yesterday, US inflation data was mixed, but the market reaction was not. Core inflation in the US posted its strongest gains this year, and the yearly figure accelerated more than expected to 3.1% in July. However, headline inflation eased more than expected to 2.7%. Normally, core inflation is the measure the Federal Reserve (Fed) focuses on when deciding monetary policy. In that context, the market could have reacted by scaling back expectations of a September rate cut.
But no — investors instead increased September cut expectations, thinking that imported goods inflation remained lower than feared as companies continued to absorb tariff costs. As a result, the US 2-year yield fell after the data release, the probability of a September cut jumped to 94% from 80% beforehand, and the US dollar slipped back below its 50-DMA. The index had already reversed its summer uptrend last week, the game is on for further US dollar weakness. There is still one more set of PCE, jobs, and CPI data before the next decision (even though the new BLS chief is reportedly willing to pause the monthly jobs releases). Still, the odds favour a 25bp Fed cut in September.
The story doesn’t end there. US Treasury Secretary Scott Bessent is now calling for a jumbo rate cut in September — a 50bp move would help offset US jobs weakness caused by trade policies. That sets the stage for further yield curve steepening, driven by rising rate-cut expectations pulling the short end of the curve lower, while exploding US debt keeps the long end from falling by a similar magnitude. One hope is that Trump’s tariff revenue — and direct collections from companies like Nvidia and AMD on their overseas operations — could fill government coffers, reduce the need for longer-term Treasury issuance, and help contain the long end of the curve. Right now, investors remain more motivated by the prospect of upcoming rate cuts supporting growth than by debt concerns — even if those debt concerns loom large on the horizon.
The S&P 500 advanced to a fresh ATH yesterday, mid-cap stocks rallied more than 2%, and small caps jumped 3%. Bullish sentiment reigns on the back of a softening dollar, robust earnings, rate-cut expectations, and persistent tech appetite.
Speaking of the US dollar, the greenback’s softness continues to support major currencies. The EURUSD extends gains above its own 50-DMA, while cable is testing solid resistance near the 1.35 mark — which also coincides with its 50-DMA and will likely give way to sterling bulls. Yesterday’s UK jobs data came in significantly stronger than expected, and combined with rising inflation pressures, fuelled expectations that the Bank of England (BoE) will hold off on a November rate cut. That more-dovish Fed/more-hawkish BoE combination should support cable and bring 1.38 back into play in the coming weeks. Elsewhere in FX, the AUDUSD is stronger even after the Reserve Bank of Australia’s (RBA) rate cut yesterday and its signal of more to come.
A softer dollar makes EM investments attractive again, as it reduces borrowing costs and lowers import prices for dollar-denominated raw materials. Cherry on top, lower inflation pressures allow for supportive monetary policies. Brazil’s central bank, for instance, has taken advantage of a stronger real and cheaper imports to cut its Selic rate from 11.75% at the start of the year to around 10% by August without reigniting inflation. Similar trends are visible in Chile and Indonesia, where currency stability has given policymakers room to ease rates and stimulate growth. No surprise then that the MSCI EM index has outperformed the S&P500 this year, riding the tailwinds of easier monetary conditions and a softer greenback — partly offsetting the drag from US trade policies.
Weaker dollar should also help put a floor under the oil selloff, as it makes oil more affordable globally. OPEC has raised its global demand growth forecast by 100,000 barrels per day to 1.4 mbpd, implying a tighter market than previously projected. It also expects non-OPEC supply to shrink by the same amount due to lower prices. While I remain cautious on OPEC’s projections — given their vested interest — the US Department of Energy recently increased its forecast for this year’s global oil surplus to 1.7 mbpd, in contrast. Still, I now believe US crude should not sustainably drop below $60pb if the dollar continues to weaken — a positive adjustment from my earlier $50pb downside view.
In the short run, US crude fell yesterday after a surprise 1.5 million-barrel build in US inventories last week. But geopolitical risks remain tilted to the upside: the upcoming Trump–Putin meeting is unlikely to yield any meaningful progress on Ukraine. Any lack of progress should lead to a rebound in oil prices toward and above $65pb.
US CPI Inflation Landed Close to Expectations
In focus today
Today is a quiet day for data releases, with no significant market movers.
Economic and market news
What happened overnight
In Australia, the Wage Price Index (SA) rose by 3.4% yoy in Q2 2025, matching the previous quarter's pace and exceeding expectations of a 3.3% increase. An acceleration in both the public and private sectors drove the stronger-than-expected growth, as public sector wages surged by 4.7%, up from 3.6% in Q1, while private sector wages rose by 3.4%, compared to 3.3% previously.
What happened yesterday
In the US, July CPI landed close to expectations on both headline (+0.19% m/m SA, June +0.29%, forecast +0.2%) and core terms (+0.32% m/m, June +0.23%, forecast +0.3%). Surprisingly, the modest uptick in core inflation was mostly driven by services. This would typically be seen as a sign of sticky inflation and hence interpreted as a hawkish signal. However, the fact that core goods and food inflation remained stable at still modest levels alleviated markets' concerns of rapid pass through of tariff-related costs. While we do expect core goods inflation to pick up speed towards fall, the reading supports the case for the Fed's September rate cut.
President Donald Trump renewed his criticism of Federal Reserve Chair Jerome Powell, urging an immediate cut to benchmark interest rates. Trump also hinted at permitting a lawsuit against Powell, citing mismanagement of renovations at the Federal Reserve's buildings.
In Germany, the German ZEW indicator - measuring financial analyst views on the German economy - saw some weakening in August. Analysts rolled back on their assessment of the current situation (-59.5 to -68.6) and expectations (52.7 to 34.7), though the latter remained somewhat above the historical average. According to ZEW, experts were somewhat disappointed with the EU-US trade deal in terms of the economic outlook, while the weak German GDP figures for Q2 added to the weak current assessment index. A weak ZEW indicator should not be overinterpreted, and one should put more emphasis on tier-1 growth indicators such as the PMIs/IFO surveys. Markets seem to share that view as today's downside surprise did not trigger any noticeable reaction.
Equities: Global equities extended gains yesterday, with leadership coming from the US cyclical sectors and small caps. US indices closed at day-high and several indices at new all-time highs. While this pattern has repeated several times in recent months, what stood out yesterday was the market's focus on macro data, in particular, the US inflation print, rather than political headlines or daily news flow. The reaction was more or less textbook alike for the current phase of the cycle, fitting neatly with our strategy view from last month's report that investors are becoming increasingly data-driven, and less focused on the daily political noise.
In the US yesterday, Dow +1.1%, S&P 500 +1.1%, Nasdaq +1.4% and Russell 2000 +2.99%. Overnight, the positive momentum carried into Asia, with strong equity performance across the region. European futures are pointing higher, and U.S. futures are marginally in the green.
FI&FX: The in-line US July CPI print reinforced expectations that the Fed will have room to cut rates in September, lifting risk sentiment and pushing front-end US yields lower. EUR/USD edged higher to the 1.17 mark. The Swedish National Debt Office resumed bond auctions last week, issuing SEK 17.5bn in T-bills after a six-week summer break. Today's auction holds greater significance as it marks the first nominal government bond auction since late June.
EUR/USD Daily Outlook
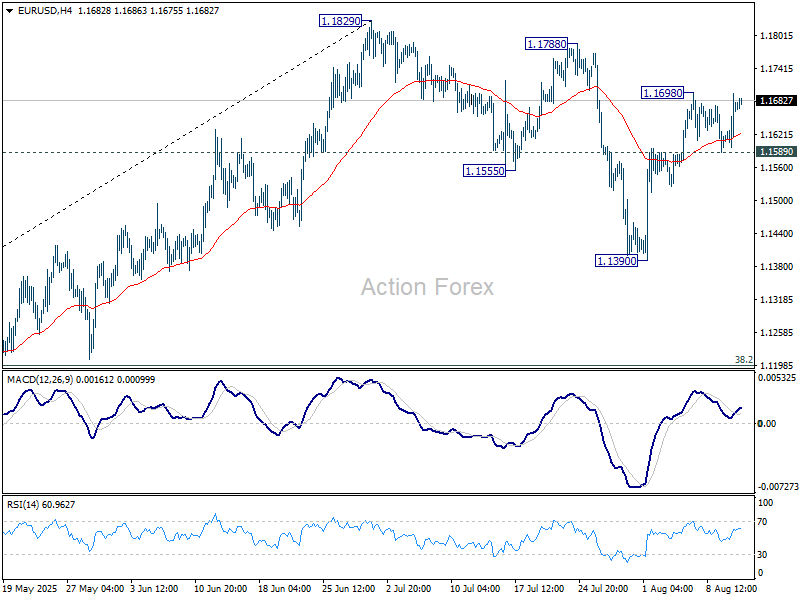
Daily Pivots: (S1) 1.1578; (P) 1.1628; (R1) 1.1665; More...
EUR/USD rebounded after drawing support from 55 4H EMA, but stays below 1.1698 temporary top. Intraday bias remains neutral first. Outlook is unchanged that correction from 1.1829 should have completed with three waves down to 1.1390. Above 1.1698 will bring retest of 1.1829. However, break of 1.1589 support will dampen this bullish view and bring deeper fall back to 1.1390 instead.
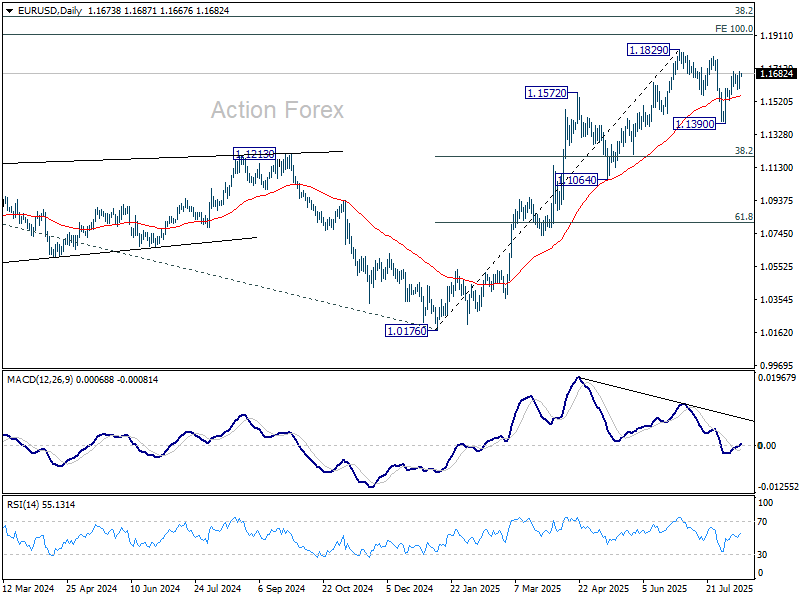
In the bigger picture, rise from 0.9534 long term bottom could be correcting the multi-decade downtrend or the start of a long term up trend. In either case, further rise should be seen to 100% projection of 0.9534 to 1.1274 from 1.0176 at 1.1916. This will remain the favored case as long as 1.1604 support holds.
Dollar Stays Soft, Bessent’s Half-Point Cut Idea Stirs Talk but Not Positioning
Dollar continued to stay soft in Asian session today, carried over from Tuesday’s post US CPI weakness. US Treasury Secretary Scott Bessent added to the policy discussion by urging Fed to consider a 50bps rate cut in September to “make up for the delay” in starting its easing cycle earlier this year.
Bessent argued that if Fed had started cutting in June or July, the current debate would look different, and that now it may be necessary to move more aggressively. He also voiced support for the Senate confirming Stephen Miran — currently chair of the Council of Economic Advisers — to fill a temporary Fed board vacancy before September, suggesting Miran’s presence could help pave the way for a larger cut given recent downward revisions to jobs data and favorable inflation readings.
Despite the strong rhetoric, fed funds futures show markets are far from embracing Bessent’s proposal. Pricing currently reflects a 94% chance of a 25bps cut in September, with the remaining probability on no change. The idea of a 50bps cut has yet to gain any traction among traders. Odds of an October cut are at 60%, but the prevailing expectation is still for just two cuts in total for 2025.
In the broader FX markets, Yen continues to underperform as the worst performer as strong risk-on sentiment continues to weigh. In particular, Japan’s Nikkei index surged above 43k mark for the first time ever, extending its record-breaking rally. Meanwhile, in the US, both S&P 500 and NASDAQ closed at all-time highs overnight, reinforcing the positive tone in global equities.
Elsewhere, Loonie and Dollar are also under pressure. Sterling leads gains, trailed by Euro and Swiss Franc. Despite the buoyant risk mood, Aussie and Kiwi are trading mixed in the middle of the pack.
On the trade front, US President Donald Trump eased market nerves in precious metals earlier in the week by announcing he would not impose tariffs on gold. The move was welcomed by the Swiss precious metals association ASFCMP as a positive signal for trade stability. However, the group stressed the need for a formal and binding commitment.
Meanwhile, China announced preliminary anti-dumping duties of 75.8% on Canadian canola imports, escalating a trade dispute dating back to Ottawa’s tariffs on Chinese EVs last August. Canada has rejected the dumping claim and expressed “deep disappointment” over the decision but said it remains open to constructive dialogue to resolve the dispute.
In Asia, at the time of writing, Nikkei is up 1.35%. Hong Kong HSI is up 2.04%. China Shanghai SSE is up 0.48%. Singapore Strait Times is up 0.84%. Japan 10-year JGB yield is up 0.024 at 1.524. Overnight, DOW rose 1.10%. S&P 500 rose 1.13%. NASDAQ rose 1.39%. 10-year yield rose 0.020 to 4.293.
Ethereum outperforms, Bitcoin pauses for breath
Ethereum’s rally has gathered strong pace and the cryptocurrency is now on track towards its record high. The move comes as Bitcoin remains stuck in consolidation, unable for now to decisively break its own record, as traders await the next catalyst.
Both assets are drawing support from the improved clarity around US cryptocurrency policy. However, Ethereum’s outperformance appears tied to larger institutional inflows, with big investors playing catch-up. In particular, Ethereum’s dominant role in stablecoin infrastructure leaves it uniquely positioned to benefit as digital dollar transactions expand under a more certain regulatory regime.
Technically, Ethereum’s near-term outlook stays bullish while above 4,163.97 support. Firm break of 4,863.75 record high would open the way toward 100% projection of 2,110.58 to 3,940.08 from 3,353.16 at 5,128.66.
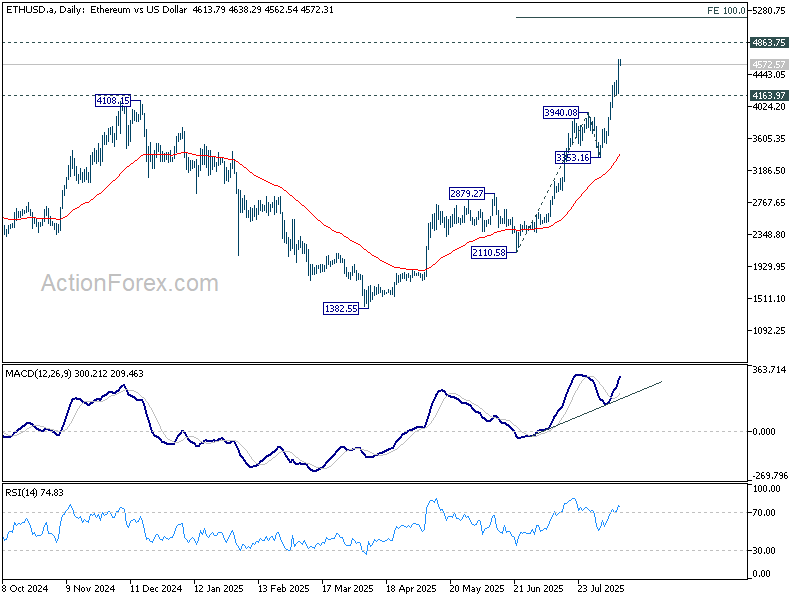
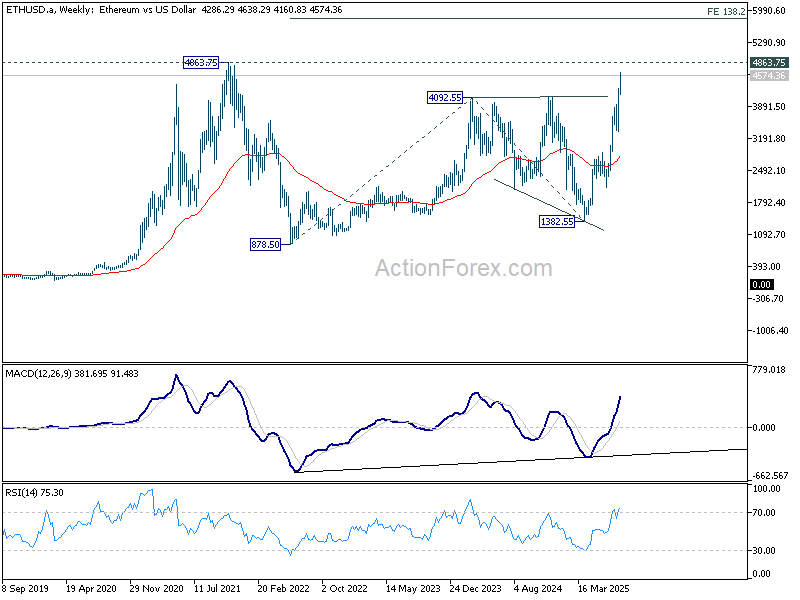
On the broader horizon, a clean break above 4,163.97 also sets up a medium term move move toward 138.2% projection of 878.5 to 4,092.55 from 1,382.55 at 5,824.36.
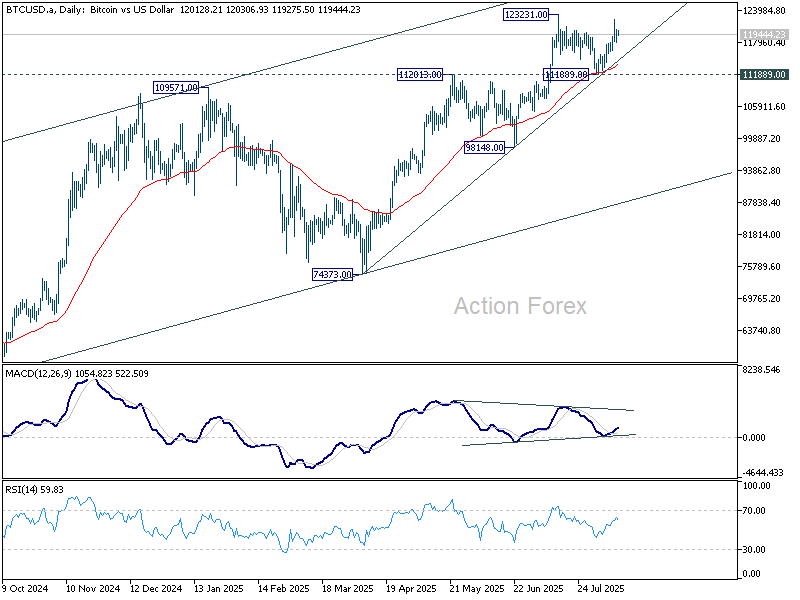
Bitcoin, meanwhile, is likely to see more consolidation below 123,231 in the near term. The broader outlook remains bullish while above 111,889 support, with the long-term uptrend expected to resume sooner or later.
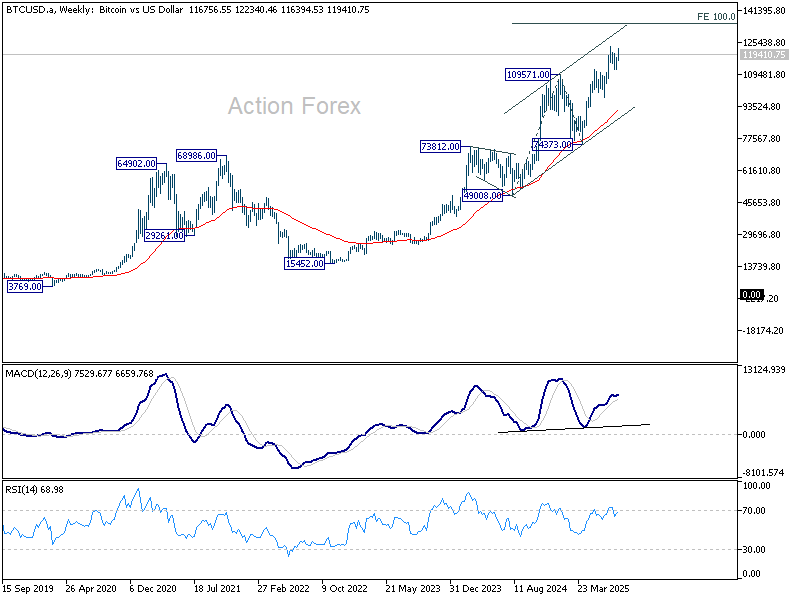
However, Bitcoin may face strong resistance just below 100% projection of 49,008 to 109,571 from 74,373 at 134,936, which could act as a cap before any sustained move higher.
EUR/USD Daily Outlook
Daily Pivots: (S1) 1.1578; (P) 1.1628; (R1) 1.1665; More...
EUR/USD rebounded after drawing support from 55 4H EMA, but stays below 1.1698 temporary top. Intraday bias remains neutral first. Outlook is unchanged that correction from 1.1829 should have completed with three waves down to 1.1390. Above 1.1698 will bring retest of 1.1829. However, break of 1.1589 support will dampen this bullish view and bring deeper fall back to 1.1390 instead.
In the bigger picture, rise from 0.9534 long term bottom could be correcting the multi-decade downtrend or the start of a long term up trend. In either case, further rise should be seen to 100% projection of 0.9534 to 1.1274 from 1.0176 at 1.1916. This will remain the favored case as long as 1.1604 support holds.
Hang Seng Index Technical: End of Minor Corrective Decline, Start of New Bullish Impulsive Up Move
Since the recent one-week slide of -5.8% seen on the Hong Kong 33 CFD Index (a proxy of the Hang Seng Index futures) from 24 July 2025 high to 1 August 2025 low, its price actions have been choppy as markets grappled with US tariffs news flow and the possibility of an imminent US Federal Reserve dovish pivot in September.
Amid this chaotic news flow environment, several technical elements are advocating the potential start of a new short-term bullish trend for the Hong Kong 33 CFD Index.
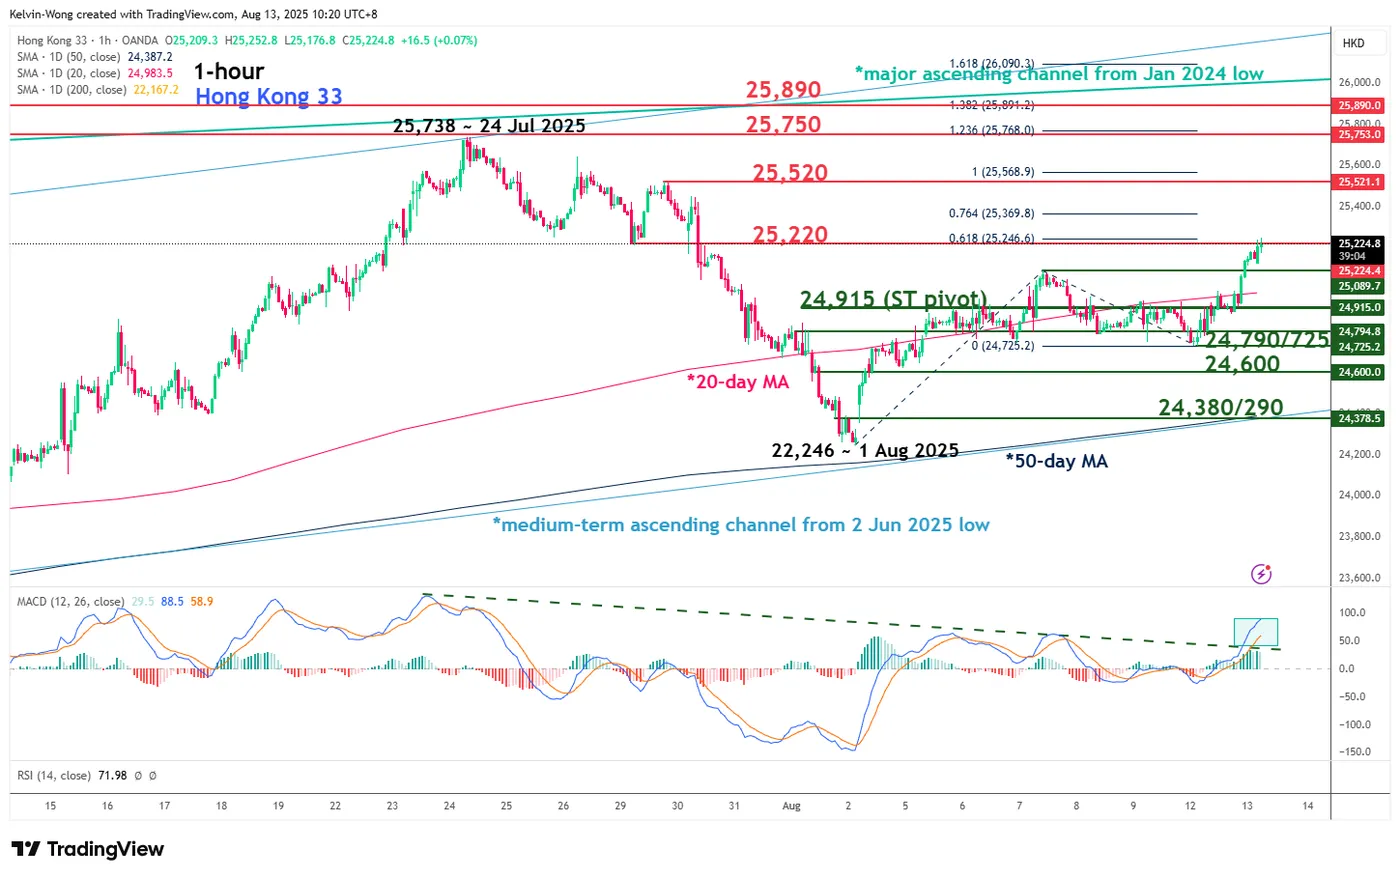
Fig. 1: Hong Kong 33 CFD Index minor trend as of 13 Aug 2025 (Source: TradingView)
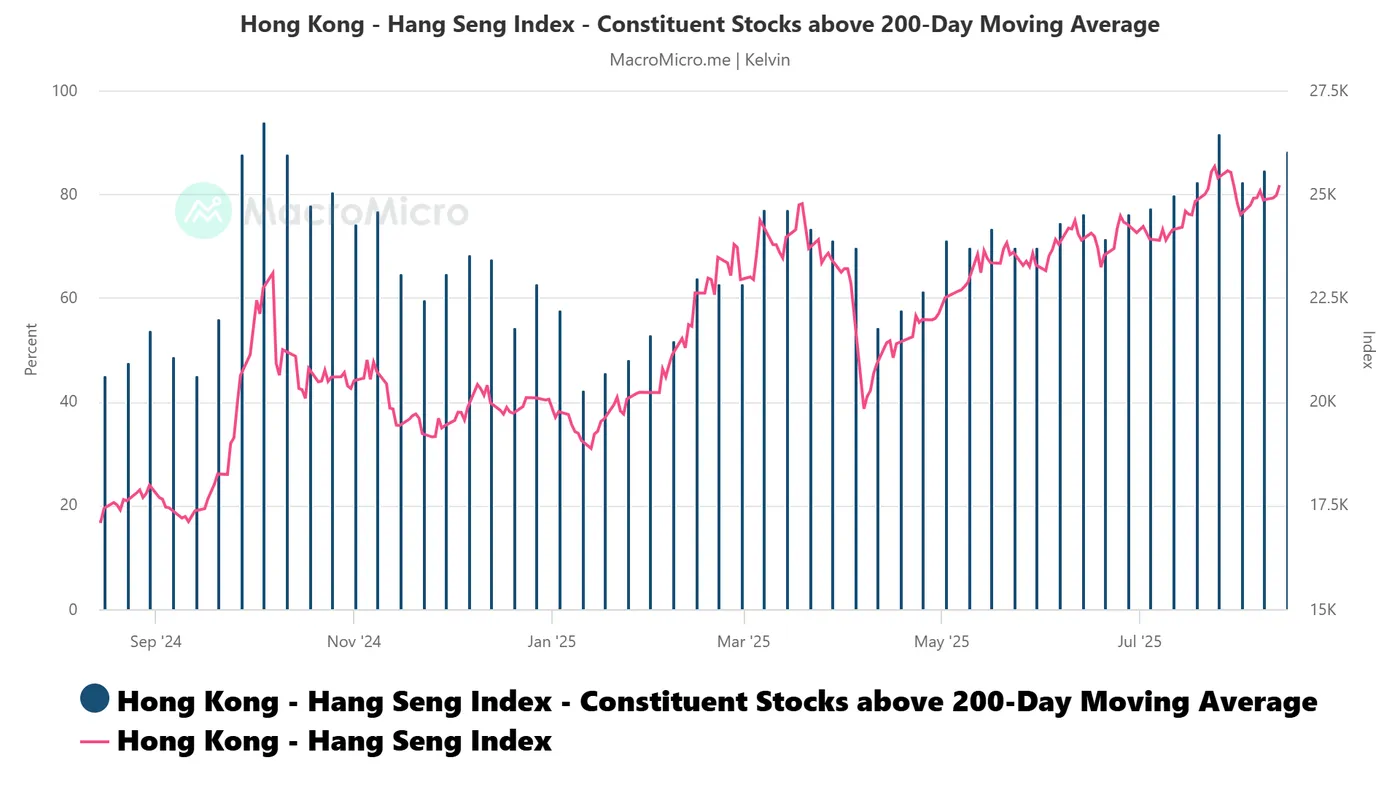
Fig. 2: Percentage of Hang Seng Index component stocks above 200-day MA as of 12 Aug 2025 (Source: MacroMicro)
Preferred trend bias (1-3 days)
Bullish bias above 24,915 short-term pivotal support, with the next intermediate resistances coming in at 25,520, 25,750, and 25,890 (see Fig. 1).
Key elements
- The price action of the Hong Kong 33 CFD Index staged a bullish breakout above its 20-day moving average on Tuesday, 12 August, which suggests the potential start of a new short-term bullish impulsive uptrend phase.
- The medium-term and major uptrend phases remain intact for the Hong Kong 33 CFD Index as price actions continued to oscillate within a major ascending channel from the January 2024 low and a medium-term ascending channel from the 2 June 2025 low.
- The hourly MACD trend indicator of the Hong Kong 33 CFD has continued to trend steadily upwards above its centerline since Tuesday, 12 August, which supports the emergence of a new short-term bullish impulsive uptrend phase.
- Market breadth of the Hang Seng Index has also improved as the percentage of its component stocks trading above their respective key 200-day moving averages has increased from 1 August print of 82% to 88% as of Tuesday, 12 August (see Fig. 2).
Alternative trend bias (1 to 3 days)
Failure to hold at the 24,915 key short-term support negates the bullish tone to reinstate another round of minor choppy corrective decline sequence to retest the next intermediate supports at 24,790/24,725 and 24,600.
GBP/USD Regains Traction as Buyers Return to the Market
Key Highlights
- GBP/USD started a fresh increase above the 1.3350 resistance.
- A short-term bullish trend line is forming with support at 1.3440 on the 4-hour chart.
- EUR/USD climbed higher above 1.1620.
- Crude Oil prices declined below the $65.50 and $65.00 levels.
GBP/USD Technical Analysis
The British Pound found support near 1.3140 and started a fresh increase against the US Dollar. GBP/USD climbed above the 1.3250 and 1.3350 resistance levels.
Looking at the 4-hour chart, the pair cleared the 61.8% Fib retracement level of the downward move from the 1.3589 swing high to the 1.3139 low. The pair even settled above the 100 simple moving average (red, 4-hour) and tested the 200 simple moving average (green, 4-hour).
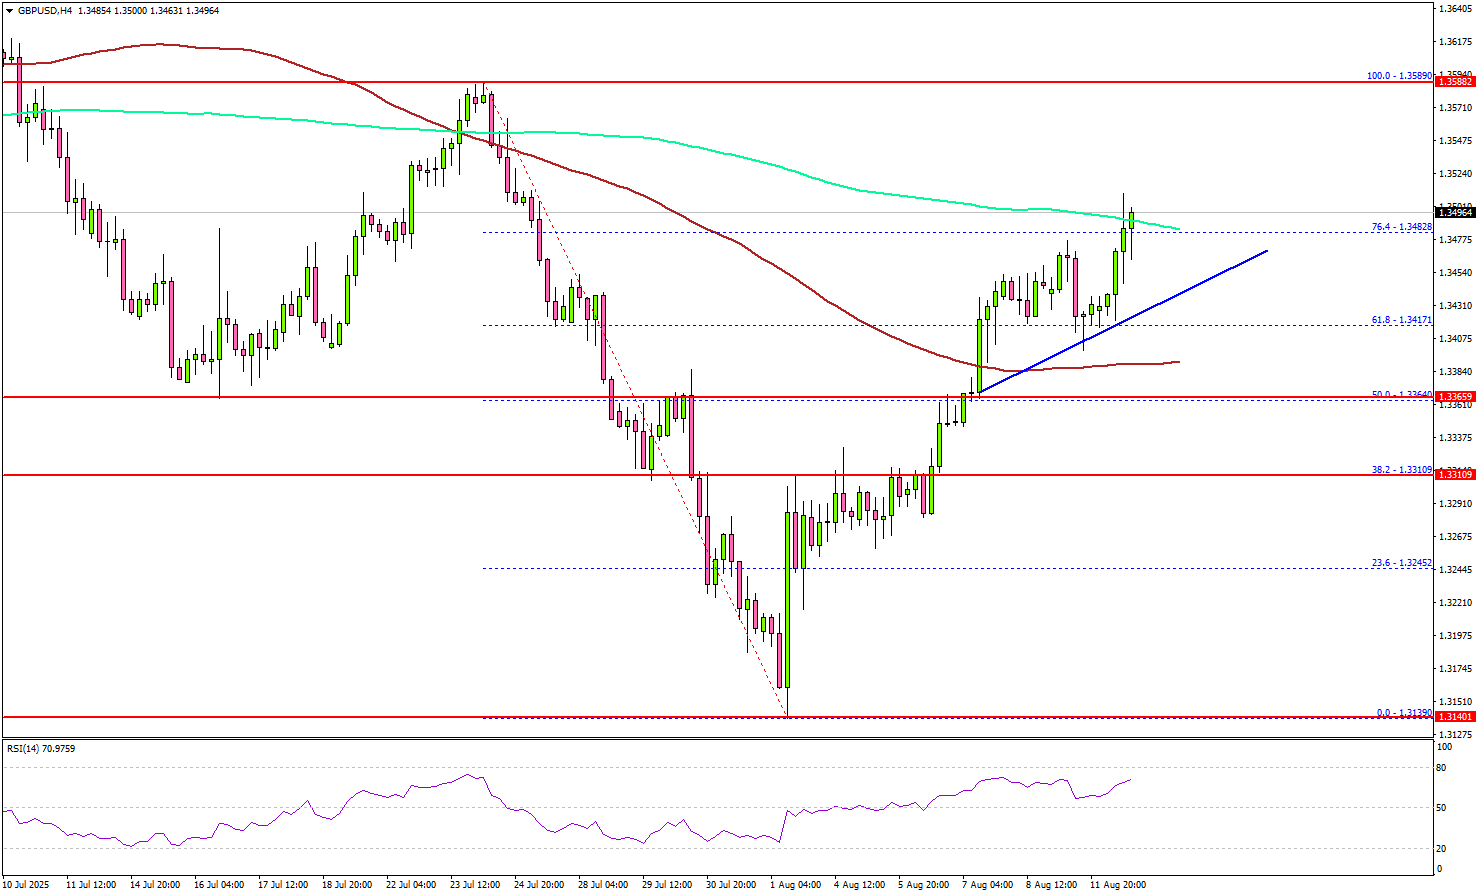
On the upside, the pair now faces resistance near the 1.3500 level. The next key resistance sits near the 1.3540 level. A close above the 1.3540 level could set the pace for another increase.
In the stated case, the pair could rise toward the 1.3600 resistance, above which the bulls could aim for a move toward 1.3660. On the downside, immediate support is near the 1.3440 level. There is also a short-term bullish trend line forming with support at 1.3440 on the same chart.
The next key support sits near 1.3400. Any more losses could send the pair toward the 1.3350 support zone.
Looking at EUR/USD, the pair started a recovery wave, and the bulls might soon aim for a move toward the 1.1750 level.
Upcoming Key Economic Events:
- Fed's Goolsbee speech.
- Fed's Bostic speech.
- EIA Crude Oil Stocks Change.
Ethereum outperforms, Bitcoin pauses for breath
Ethereum’s rally has gathered strong pace and the cryptocurrency is now on track towards its record high. The move comes as Bitcoin remains stuck in consolidation, unable for now to decisively break its own record, as traders await the next catalyst.
Both assets are drawing support from the improved clarity around US cryptocurrency policy. However, Ethereum’s outperformance appears tied to larger institutional inflows, with big investors playing catch-up. In particular, Ethereum’s dominant role in stablecoin infrastructure leaves it uniquely positioned to benefit as digital dollar transactions expand under a more certain regulatory regime.
Technically, Ethereum’s near-term outlook stays bullish while above 4,163.97 support. Firm break of 4,863.75 record high would open the way toward 100% projection of 2,110.58 to 3,940.08 from 3,353.16 at 5,128.66.
On the broader horizon, a clean break above 4,163.97 also sets up a medium term move move toward 138.2% projection of 878.5 to 4,092.55 from 1,382.55 at 5,824.36.
Bitcoin, meanwhile, is likely to see more consolidation below 123,231 in the near term. The broader outlook remains bullish while above 111,889 support, with the long-term uptrend expected to resume sooner or later.
However, Bitcoin may face strong resistance just below 100% projection of 49,008 to 109,571 from 74,373 at 134,936, which could act as a cap before any sustained move higher.
Gold’s (XAU/USD) Recovers to $3350/oz After Mixed CPI Reaction. What Next?
Gold prices have seen whipsaw price action today in light of US inflation data and ongoing tariff developments. The precious metal did take out yesterday's low and continues to edge lower, but whipsaw price action as short while ago saw Gold return to the $3350/oz handle.
US CPI Inflation Data
The US Consumer Price Inflation (CPI) for July came in mostly as expected. Headline inflation increased by 0.2% compared to last month and 2.7% compared to last year. Core inflation (which excludes food and energy) rose by 0.3% month-on-month and 3.1% year-on-year.
Looking at the details, energy prices dropped by 1.1% from the previous month, while food prices stayed the same. For products most affected by tariffs, the impact seems mild for now. Core goods (excluding cars) increased by 0.2% in July, which is a slower rise compared to the 0.55% jump in June. This suggests that companies are currently absorbing most of the extra costs from tariffs.
Some specific changes: appliance prices surprisingly fell by 0.9%, clothing prices went up slightly by 0.1%, sporting goods increased by 0.4%, and furniture prices rose by 0.9%.
It would appear that any inflationary impact expected from tariffs thus far are largely absorbed within US corporate profit margins.Also frontloading ahead of tariff deadlines may be keeping prices in check.
The question going forward is now whether companies will continue to absorb increasing costs or will it be passed to consumers.
The impact on gold was interesting with an initial move higher followed by fresh daily lows and a test of key support at 3334. Gold should in theory rise, given that the inflation print only helps a Fed rate cut in September.
President Trump Rules Out Tariffs on Gold Bars
Tariffs will not be placed on gold bars, according to a statement by Trump on Monday, ending uncertainty that had caused panic in the gold markets last week.
Last Friday, gold futures prices hit a record high on reports of potential US tariffs on 1kg gold bars, which would have impacted Switzerland, a major gold exporter.
Following Trump’s statement, US gold futures fell 2.4% to $3,407 per ounce, while spot gold dropped 1.2% to $3,357. The Swiss Association of Precious Metals Producers welcomed the news but called for a formal decision to ensure stability.
A White House official said an executive order is being prepared to address misinformation about gold tariffs
Gold Prices Moving Forward
Looking at Gold over the medium-term and none of these events served as a catalyst for the precious metal. For now that 3500 handle seems to be unattainable as every bullish rally seems to be making a lower high the most recent of which occurred around 3407.
The failure to gain acceptance above the 3400 handle does leave the precious vulnerable to further downside.
Technical Analysis - Gold (XAU/USD)
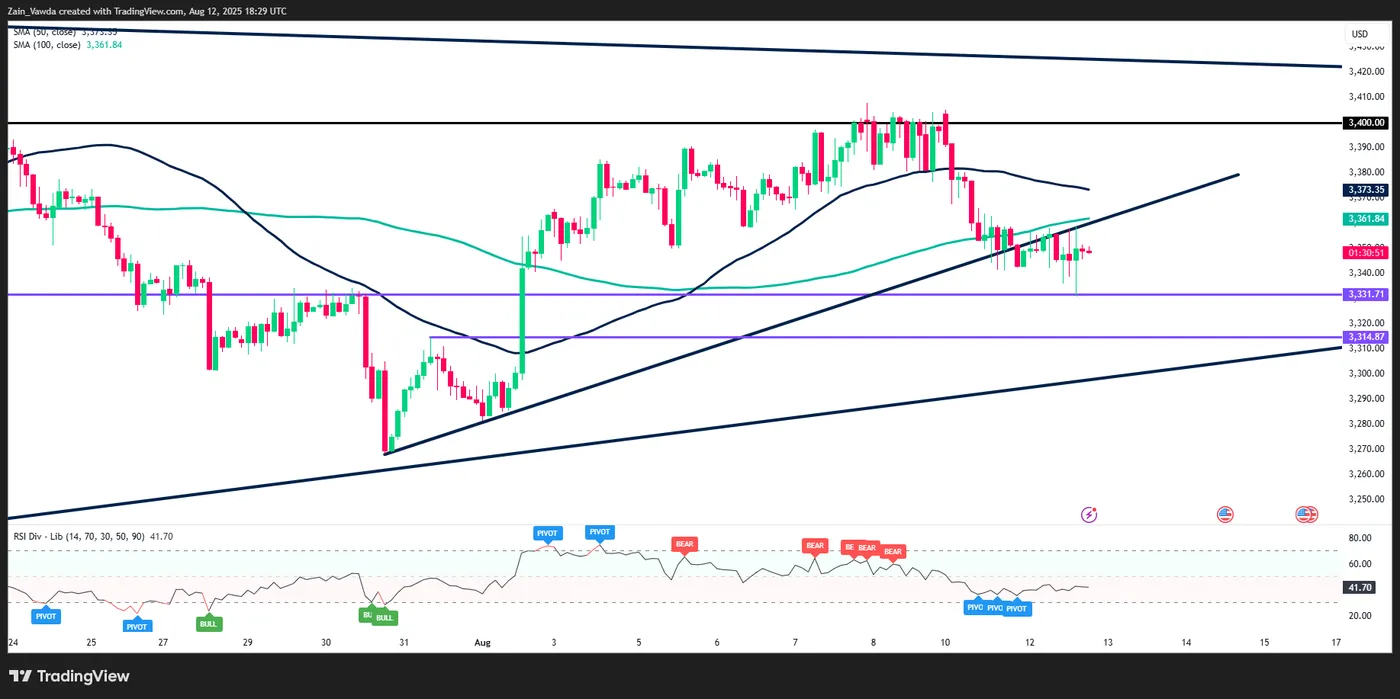
From a technical standpoint, Gold on a two-hour timeframe is also flashing bearish signs.
There was a short-term ascending trendline which has been broken, with resistance being provided by the 100-day MA.
If the 100-day MA holds firm further downside could materialize. Immediate support rests around the 3330 handle with a break below opening up a retest of the swing high at 3314 and then of course the 3300.
A move higher has significant hurdles to clear in the short-term. First we have the 100-day MA at 3361 before the 50-day MA at 3373 and then of course the psychological 3400 handle.
Gold (XAU/USD) Daily Chart, August 12, 2025
Source: TradingView (click to enlarge)
Client Sentiment Data - XAU/USD
Looking at OANDA client sentiment data and market participants are Long on Gold with 67% of traders net-long. I prefer to take a contrarian view toward crowd sentiment and thus the fact that the majority of traders are net-long suggests that Gold prices could continue to slide in the near-term.
EURUSD Attempts to Break 1.17, Sees Newfound Strength from US CPI Report
After a rough month of July taking the most traded Major pair from 1.1830 highs to a 4-handle correction, the NFP report at the beginning of the month led a huge wave of higher mean-reversion – An end-July daily double top on the pair had brought fresh technical fuel to sell the Euro.
August 1st marked lows at 1.13915, with oversold daily levels and an over-extended US Dollar created a perfect recipe for consequential dip buying in EURUSD.
The pair is now trying to reach the 1.17 psychological level amid another fresh wave of US Dollar selling.
Positive data releases for the pair have worked towards bullish fundamentals, allowing fresh buying to take place.
This morning's US CPI in line report saw further pricing of FED cuts for the September meeting – with the Eurozone main policy rate staying put at 2% for the past two meetings, Markets expect rate differentials between the Euro and the US Dollar to converge further.
Euro buyers seem to discard the miss in the Eurozone consumer sentiment as Markets put more emphasis on the Dollar weakness theme.
For those who haven't seen, the mid-tier data release saw a weaker than expected 25.1 Eurozone ZEW Consumer sentiment vs 28.1 estimate.
Let's now turn to the EURUSD technicals to spot if buyers have enough strength to break the 1.17 handle amid the broader USD weakness.
The current Daily picture for Forex Majors
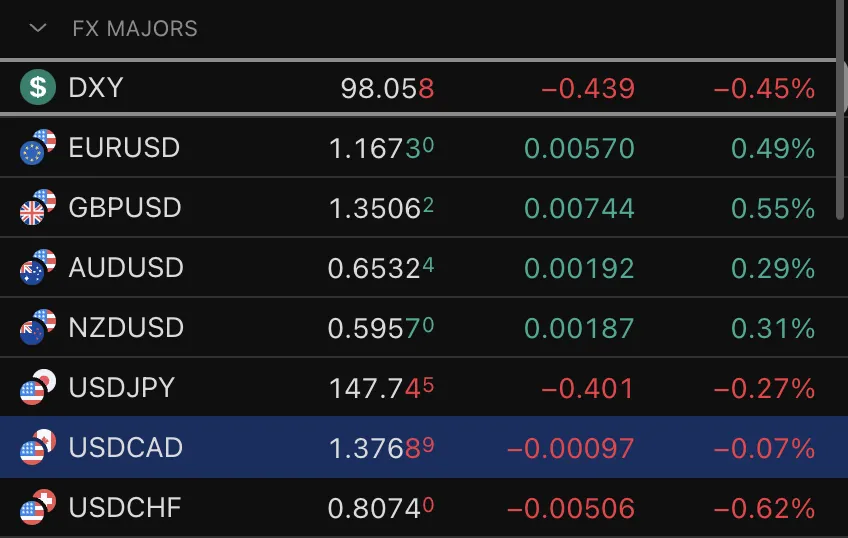
FX Major Watchlist, August 12, 2025 – Source: TradingView
There has been some heavy selling in the US Dollar after the data release, leading to most major currencies appreciate except for the Loonie getting dragged down.
The Dollar index touched 97.90 lows and has now weakly reverted above 98.00. A failure to retest higher levels points to further USD weakness (for the time being at least)
EURUSD Daily Chart
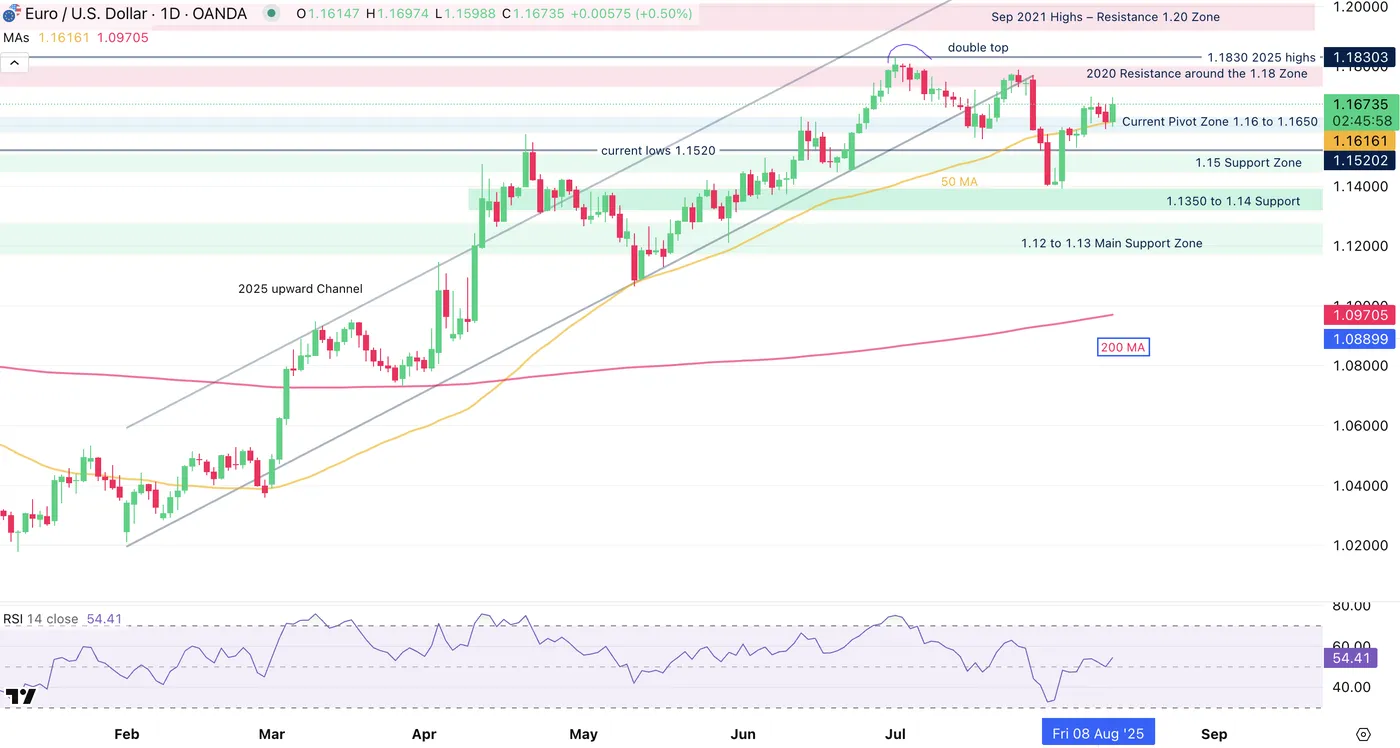
EURUSD Daily Chart, August 12, 2025 – Source: TradingView
The pair is up close to 0.50% on the session, with the morning daily candle trying to break out of a multi-day consolidation.
Buyers stepped in at the 50-Day MA to bring EURUSD to current levels. This moving average, currently standing at 1.16160 is a key barometer for bull/bear strength.
RSI Momentum is back above neutral and turning higher, however more work needs to be done for bulls to push the pair higher.
Let's analyze shorter timeframes to see why.
EURUSD 4H Chart
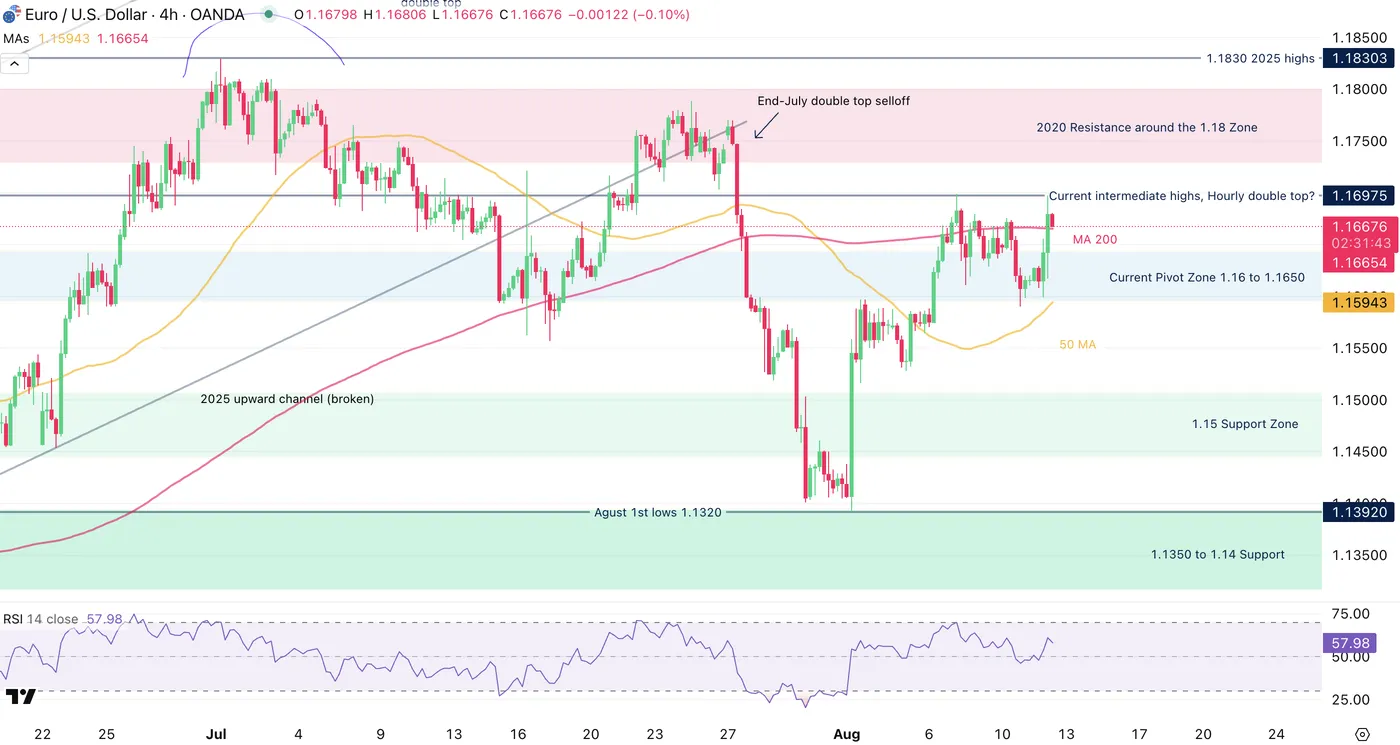
EURUSD 4H Chart, August 12, 2025 – Source: TradingView
As long as buyers don't break the intermediate highs (1.16990), the momentum is more rangebound than upward trending.
Despite this morning's push using the 50-period MA as support, the 4H MA-200 is flattening indicating indecision – This technical formation also coincides with the few overlapping bull and bear candles, generally indicating rangebound action.
Furthermore, this morning's highs are forming a shorter timeframe double-top on the currency pair.
EURUSD would need a further boost from USD selling to push above 1.17 – Above 1.17 however, there isn't much resistance before the 2025 highs 1.18 Zone.
EUR/USD Levels to keep on your charts:
Resistance Levels
- 1.17 psychological level (coincides with daily highs)
- 1.1760 to 1.18 2025 highs resistance zone
- 1.1830 2025 top
Support Levels
- Current Pivot Zone 1.16 to 1.1650
- 1.15 Psychological Level
- 1.1350 to 1.14 Support 2
EURUSD 1H Chart
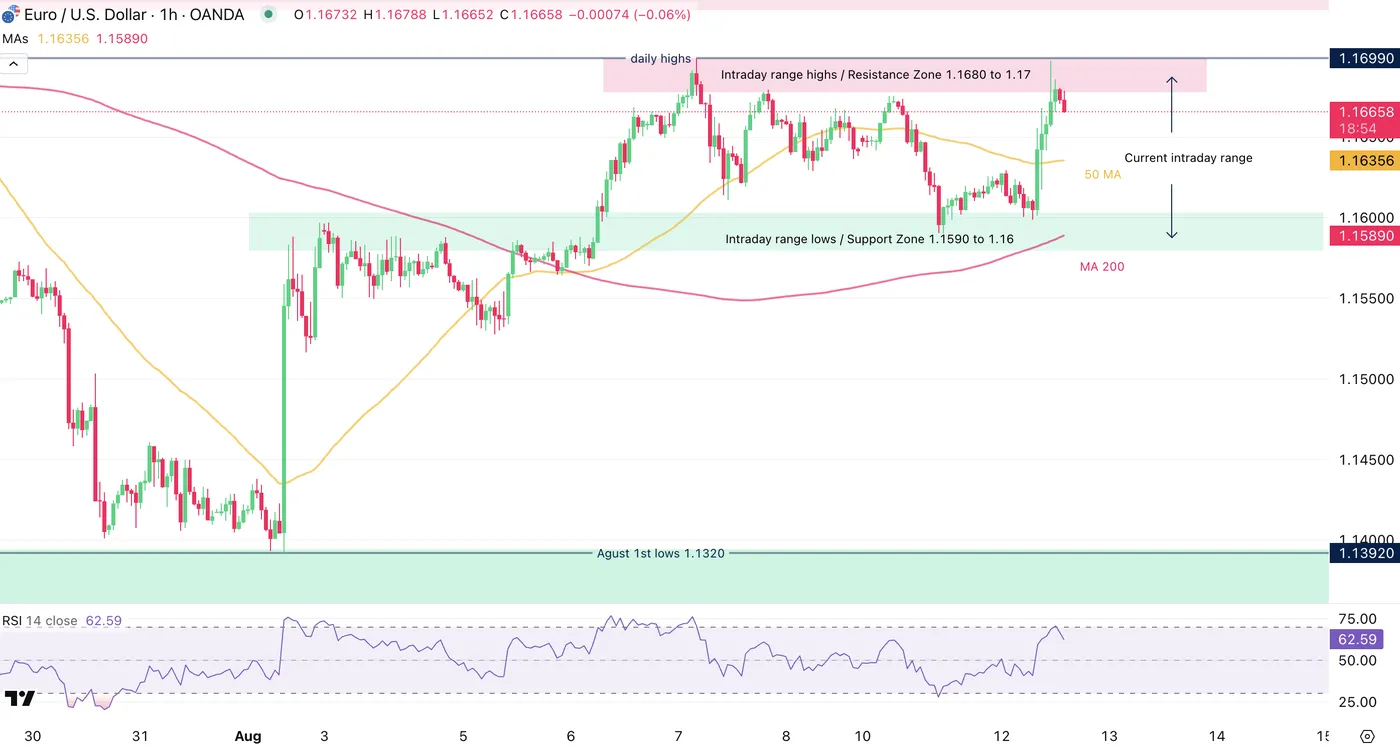
EURUSD 1H Chart, August 12, 2025 – Source: TradingView
Looking even closer to the hourly charts, we see how well defined the intraday range is between the 1.1590 to 1.16 range lows and the 1.1680 to 1.17 range highs.
Look for breakouts both ways to mark new momentum, however, the action looks more rangebound in the immediate picture.
Safe Trades!