Sample Category Title
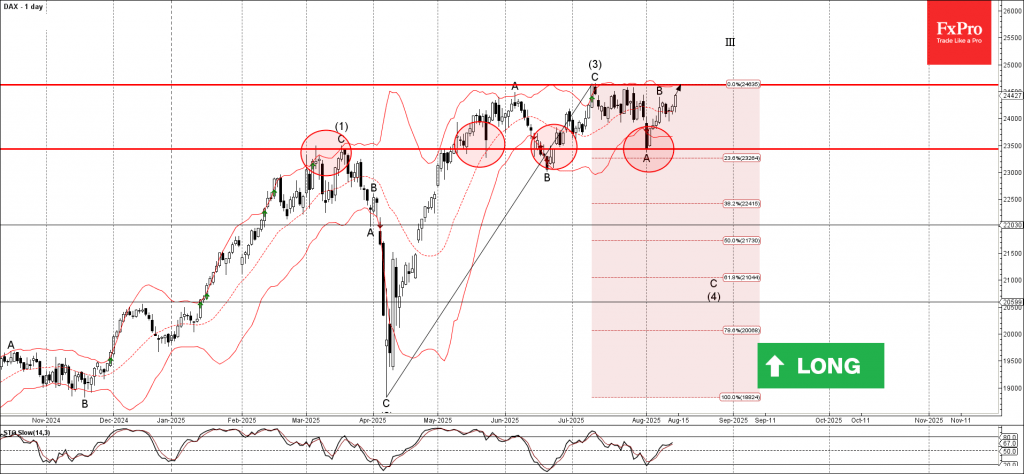
DAX Wave Analysis
DAX: ⬆️ Buy
- DAX reversed from the support level of 23500.00
- Likely to reach resistance level 24625.00
DAX index recently reversed up from the support level of 23500.00 (which has been reversing the price from May), standing near the lower daily Bollinger Band.
The upward reversal from the support level of 23500.00 started the active short-term impulse wave B.
Given the clear daily uptrend, the DAX index can be expected to rise to the next resistance level 24625.00, which stopped the previous impulse wave (3).
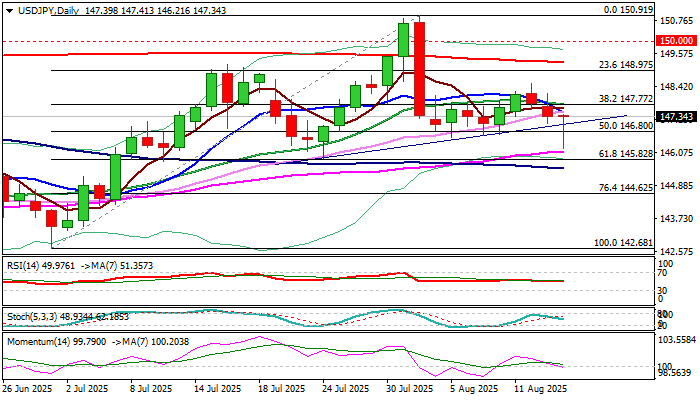
USD/JPY: Bearish Pressure Eases But Downside Still at Risk
USDJPY trends lower for the third consecutive day and accelerated losses on Thursday, hitting the lowest in three weeks.
Fresh bears spiked through pivotal supports at 146.80/70 (50% retracement of 142.68/150.91 / early Aug higher base) but need close below these levels to confirm bearish signal (also on completion on asymmetric Head & Shoulders pattern on daily chart) and open way for attack at 145.85/82 (July 24 higher low / Fibo 61.8%) and 145.50 (100DMA).
The dollar remains under pressure on growing expectations of Fed rate cut in September and probably another one or two by the end of the year.
However, bears may pause for further consolidation after today’s quick bounce from new low pointed to increased headwinds, as daily studies still lack clear direction signal (MA’s in mixed setup with conflicting 55/100DMA bull cross and 10/20 DMA bear cross, with 14d momentum being currently at the centreline.
Falling 10DMA (147.47) should cap and guard 20DMA (147.78) upper breakpoint.
Stronger signals to be expected from the outcome of Trump – Putin summit, with Monday’s market opening to be closely watched.
Res: 147.47; 147.78; 148.51; 148.97.
Sup: 147.09; 146.80; 146.12; 145.82.
Sunset Market Commentary
Markets
It’s back to the drawing board. July producer price inflation just killed this week’s market narrative. Tariff-induced inflation didn’t show up (yet) in consumer prices, but it did the more so in factory-gate prices. Both headline and core PPI rose by 0.9% M/M, beating 0.2% M/M consensus by a wide margin and sending annual PPI level respectively from 2.3% to 3.3% and from 2.6% to 3.7%; the highest levels since Q1 2025. More details showed core goods PPI rising by 0.4% M/M and services costs increasing by the most since March 2022 (1.1% M/M). The latter will feed through in the Fed’s preferred core PCE deflator and comes after core CPI earlier this week already rose somewhat more than expected. It’s the key reason by Chicago Fed Goolsbee (voter) overnight warned not to get automatically lurched into rate cuts. US money markets yesterday started contemplating for the first time the possibility of a 50 bps rate cut after Treasury Secretary Bessent’s suggestion that that should be the way forward. That door is closed now. Apart from the PPI numbers, SF Fed Daly also pushed back against such larger move as it would send a wrong, worrying, signal to the market about the strength of the labour market. The situation is different compared to a year ago when Summer payrolls reports triggered the “Sahm rule” early recession indicator (three month moving average of unemployment rate exceeding the lowest level of the past year by more than 0.5 percentage points). Currently, the Sahm metric only stands at 0.15. The US unemployment rate would have to rise by a full percentage point in August to set off similar alarm bells like last summer. Following today’s PPI numbers, it seems way less likely that markets will lean towards a 50 bps in September again even in case of disappointing activity data between now and the September FOMC meeting. Though if this week learnt something, than it’s too take nothing for granted in the current environment. Anyway, a 25 bps rate cut is the base case, with Fed Chair Powell in the position to give the nod at next week’s Kansas City Fed Jackson Hole symposium. Not ruling anything in or out will prolong the current extreme market sensitivity to US eco data with everyone eager to get the timing of the Fed’s normalization cycle right. US Treasuries underperform today with the curve bear flattening. Daily change vary between +4.9 bps (2-yr) and +1.6 bps (30-yr). German bunds shadow the move to lesser extent and in bear steepening fashion with yields currently rising by +1.3 bps (2-yr) to 2.9 bps (30-yr). The dollar finds a bid with EUR/USD returning below the 1.17 handle, currently changing hands around 1.1660. EUR/GBP today tested the neckline of a technical double top formation at 0.86. The move came somewhat counterintuitive after this morning’s Q2 GDP numbers. The headline number beat forecasts at 0.3% Q/Q (vs 0.1% consensus), but came on account of government spending (+1.2% Q/Q) with private consumption (+0.1% Q/Q) and gross fixed capital formation (-1.1% Q/Q) painting a dire picture.
News & Views
The Norwegian central bank (Norges Bank) kept its policy rate unchanged today at 4.25%. “The job of tackling inflation has not been fully completed. A restrictive monetary policy is still needed. At the same time, we do not want to restrain the economy more than needed. In June, we began a prudent easing of monetary policy, and it will likely be appropriate to continue with a cautious normalization of the policy rate ahead,” says Governor Ida Wolden Bache. She later specified that this implies one or two more 25 bps rate cuts this year. Norwegian markets expected a slightly more firm signal for the September meeting, which helped the Norwegian krone away from the EUR/NOK 12 resistance level. The overall outlook for the Norwegian economy appears to have remained broadly unchanged since the June Monetary Policy Report. Headline inflation was slightly higher while the krone weakened a little more than assumed.
USD/JPY Mid-Day Outlook
Daily Pivots: (S1) 146.92; (P) 147.55; (R1) 148.00; More...
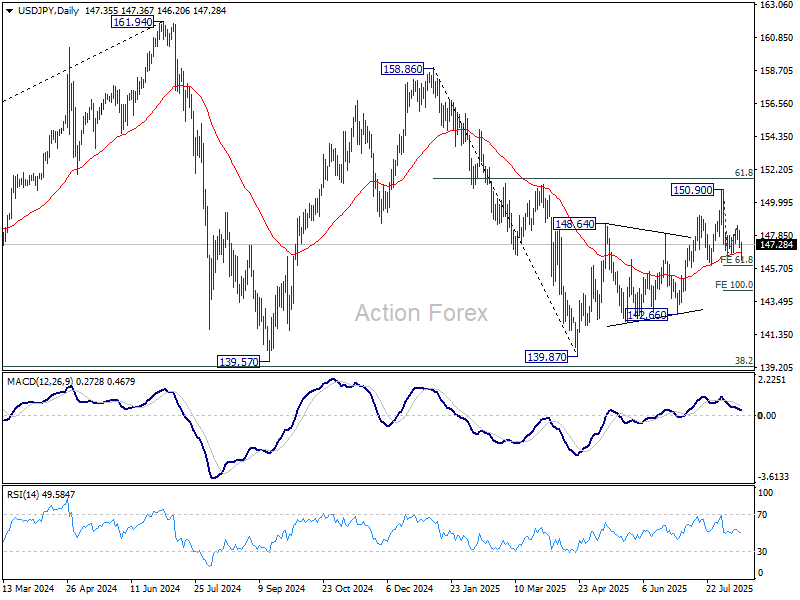
USD/JPY recovered notably after dipping to 146.20 and intraday bias is turned neutral first. Further decline is mildly in favor as long as 148.51 resistance holds. On the downside, firm break of 146.85 support will suggest that whole rebound from 139.87 has completed at 150.90, and turn outlook bearish. Next target is 100% projection of 150.90 to 146.41 from 148.51 at 144.22. On the downside, above 148.51 will bring retest of 150.90 instead.
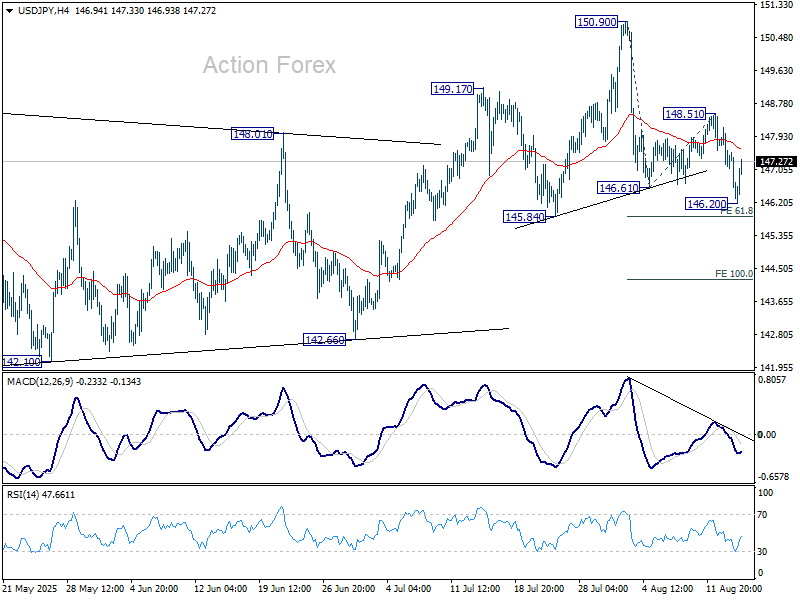
In the bigger picture, price actions from 161.94 (2024 high) are seen as a corrective pattern to rise from 102.58 (2021 low). Decisive break of 61.8% retracement of 158.86 to 139.87 at 151.22 will argue that it has already completed with three waves at 139.87. Larger up trend might then be ready to resume through 161.94 high. In case the corrective pattern extends with another fall, strong support is expected from 38.2% retracement of 102.58 to 161.94 at 139.26 to bring rebound.
USD/CHF Mid-Day Outlook
Daily Pivots: (S1) 0.8028; (P) 0.8051; (R1) 0.8081; More….
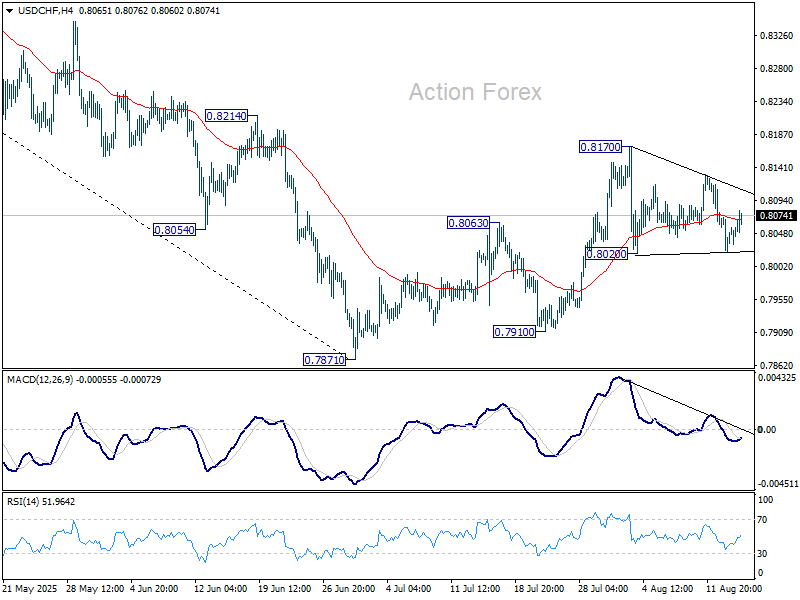
USD/CHF is still bounded in range of 0.8020/8170 and intraday bias stays neutral. On the downside, break of 0.8020 will revive that case that the corrective pattern from 0.7871 has completed, and target a retest on 0.7871 low. On the upside, firm break of 0.8710 will resume the corrective from 0.7871. Intraday bias will be back on the upside for 38.2% retracement of 0.9200 to 0.7871 at 0.8379.
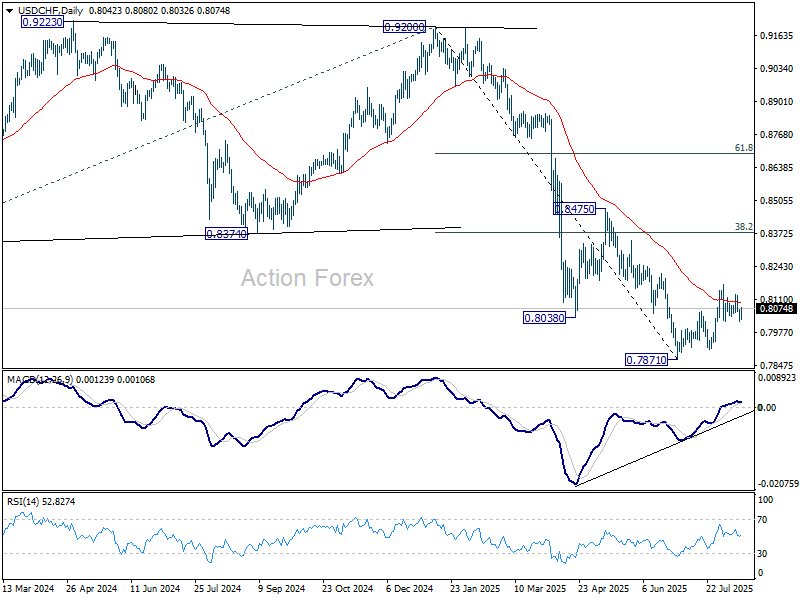
In the bigger picture, long term down trend from 1.0342 (2017 high) is still in progress. Next target is 100% projection of 1.0146 (2022 high) to 0.8332 from 0.9200 at 0.7382. In any case, outlook will stay bearish as long as 0.8475 resistance holds.
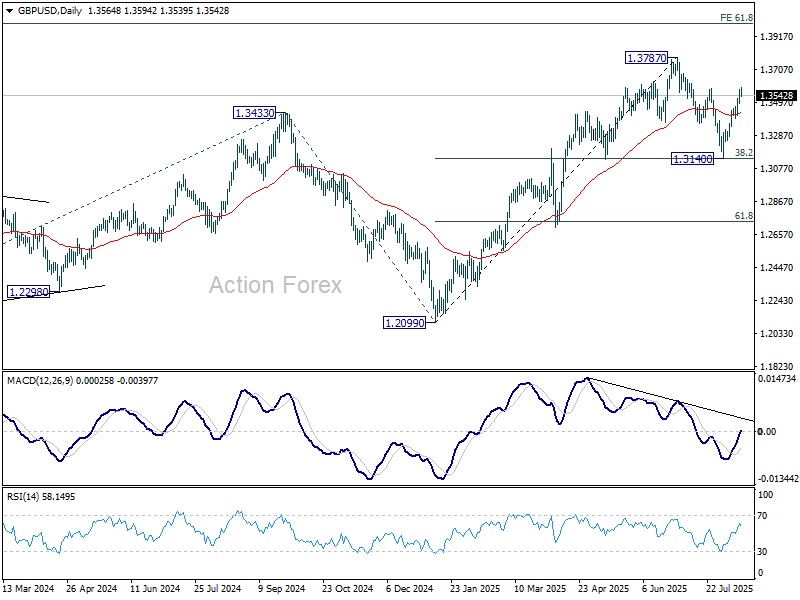
GBP/USD Mid-Day Outlook
Daily Pivots: (S1) 1.3518; (P) 1.3551; (R1) 1.3610; More...
Intraday bias in GBP/USD is turned neutral first with current retreat. Some consolidations would be seen below 1.3594 temporary top. But further rally is expected as long as 1.3398 support holds. Above 1.3594 will extend the rise from 1.3140 to retest 1.3787 high.
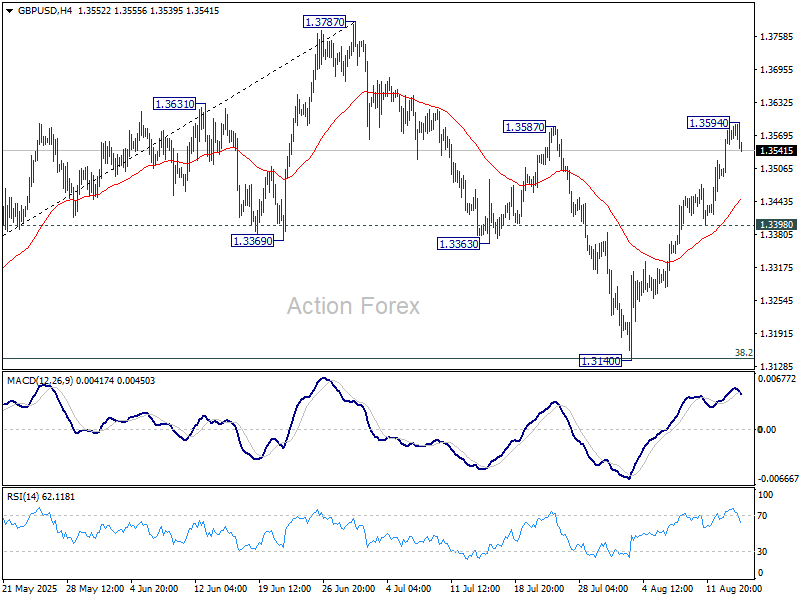
In the bigger picture, up trend from 1.3051 (2022 low) is in progress. Next medium term target is 61.8% projection of 1.0351 to 1.3433 from 1.2099 at 1.4004. Outlook will now stay bullish as long as 55 W EMA (now at 1.3068) holds, even in case of deep pullback.
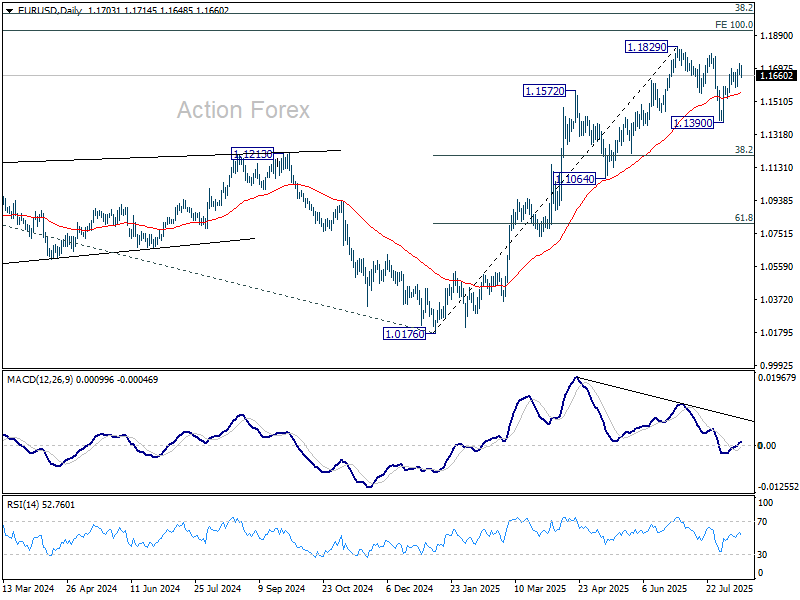
EUR/USD Mid-Day Outlook
Daily Pivots: (S1) 1.1673; (P) 1.1701; (R1) 1.1734; More...
Intraday bias in EUR/USD is turned neutral again with current retreat. Some consolidations would be seen below 1.1729. Further rise is expected as long as 1.1589 support holds. Above 1.1729 will target a retest on 1.1829 high. Firm break there will resume larger up trend to 1.1916 projection level. On the downside, however, break of 1.1589 support will delay the bullish case and extend the corrective pattern from 1.1829 with another falling leg.
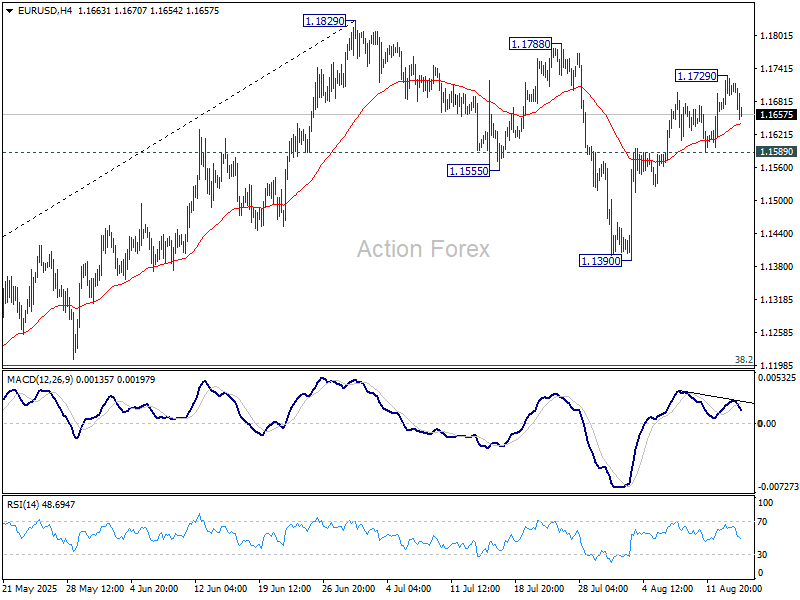
In the bigger picture, rise from 0.9534 long term bottom could be correcting the multi-decade downtrend or the start of a long term up trend. In either case, further rise should be seen to 100% projection of 0.9534 to 1.1274 from 1.0176 at 1.1916. This will remain the favored case as long as 1.1604 support holds.
Hot US PPI Lifts Dollar, Puts Brake on Big September Cut Calls
Dollar regained its footing in early US trade after much stronger-than-expected July PPI figures sharply reduced expectations for aggressive Fed easing. While a 25bps rate cut at the September FOMC meeting remains the market’s base case, the data has made a 50bps move far less likely.
Importantly, this PPI print captures only July’s data—before the August tariff escalation began impacting prices. That means upside risks to inflation could intensify over the coming months. Even if one takes the view that tariff-driven price gains are transitory, the duration of this “transition” is uncertain, making it difficult for policymakers to commit to deeper or faster cuts.
Labor market indicators offered little reason for the Fed to rush. Weekly jobless claims were steady. This stability highlights the Fed’s “luxury” of waiting for more data before making major moves, as Atlanta Fed’s Raphael Bostic noted earlier this week.
In currency markets, the Yen is holding as the day’s strongest performer. The -1.45% profit-taking pullback in the Nikkei triggered strong Yen buying, while a sharp drop in US equity futures after the PPI release further supported the safe-haven bid. Dollar ranks as the second strongest, followed by Sterling, which got an extra boost from much stronger-than-expected UK Q2 GDP data.
The UK growth figures, paired with this week’s labor data showing wage growth staying elevated despite some cooling, give the BoE little reason to deviate from its current pace of one rate cut per quarter. That policy stance, coupled with solid fundamentals, has kept Sterling well supported.
At the other end of the spectrum, risk-sensitive currencies are under pressure. Both Kiwi and Aussie are suffering from the risk sentiment turn, while Euro is among the day’s laggards, weighed down in part by a sharp selloff against Sterling. Swiss Franc and Loonie are trading in the middle of the pack.
In Europe, at the time of writing, FTSE is down -0.08%. DAX is up 0.40%. CAC is up 0.38%. UK 10-year yield is up 0.019 at 4.614. Germany 10-year yield is up 0.012 at 2.695. Earlier in Asia, Nikkei fell -1.45%. Hong Kong HSI fell -0.37%. China Shanghai SSE fell -0.46%. Singapore Strait Times fell -0.38%. Japan 10-year JGB yield rose 0.031 to 1.552.
US PPI surges 0.9% mom in July, undermining case for aggressive Fed easing
US producer prices surged in July, with final demand PPI jumping 0.9% mom, far exceeding expectations of a 0.2% rise and marking the sharpest monthly gain since mid-2022.
The increase was broad-based, with over three-quarters driven by final demand services, which climbed 1.1% mom, while goods prices rose 0.7% mom. The core measure excluding food, energy, and trade services climbed 0.6% mom, the largest increase since March 2022.
On an annual basis, headline PPI accelerated from 2.4% to 3.3% yoy, well above the 2.5% yoy forecast and the highest since February. PPI excluding food, energy, and trade services rose to 2.8% yoy.
The data may temper market enthusiasm for an aggressive September Fed rate cut, despite political pressure and calls from Treasury Secretary Bessent for a 50 bps move.
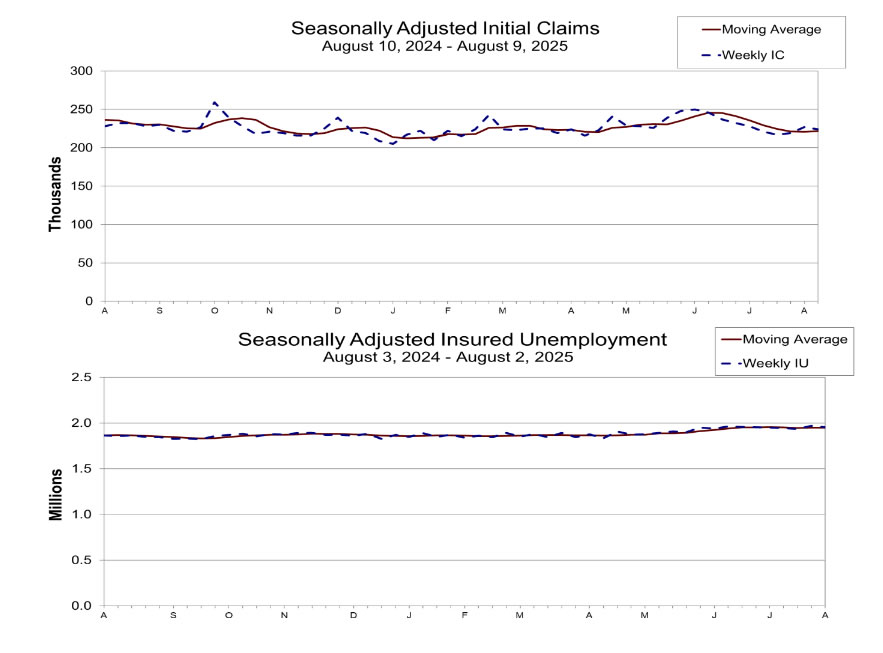
US initial jobless claims fall to 224k vs exp 227k
US initial jobless claims fell -3k to 224k in the week ending August 9, slightly below expectation of 227k. Four-week moving average of initial claims rose 750 to 222k.
Continuing claims fell -15k to 1953k in the week ending August 2. Four-week moving average of continuing claims rose 500 to 1951k.
Fed’s Daly: No case for 50bps urgent cut, dismisses ‘catch-up’ argument
San Francisco Fed President Mary Daly pushed back against the idea of a 50bps rate cut at the September FOMC meeting, a move strongly advocated earlier this week by Treasury Secretary Scott Bessent. In a Wall Street Journal interview, Daly said such a large cut would send an “urgency signal” that doesn’t match her view of the economy’s strength.
“I’m worried it would send an urgency signal that I don’t feel about the strength of the labor market,” she noted.
Daly stressed there’s no need to “catch up,” pointing to a still-solid job market. That's in contrast to Bessent's view that if the Fed had seen recent job market data sooner, it could have cut in June and July and now “needs to catch up.”
Eurozone industrial production falls -1.3% mom in June, broad weakness across sectors
Eurozone industrial production fell sharply by -1.3% mom in June, missing expectations of a -0.8% mom drop. The breakdown showed a mixed picture, with energy output up 2.9% mom, but declines in other categories: intermediate goods -0.2% mom, capital goods -2.2% mom, durable consumer goods -0.6% mom, and a steep -4.7% mom fall in non-durable consumer goods.
Across the EU, output slipped -1.0% mom. The largest monthly declines came from Ireland (-11.3%), Portugal (-3.6%), and Lithuania (-2.8%). On the upside, Belgium (+5.1%), France (+3.8%), Sweden (+3.8%), and Greece (+3.3%) posted notable gains
UK GDP beats forecasts with 0.3% growth in Q2, as June data delivers strong finish
UK GDP expanded 0.3% qoq in Q2, beating expectations of a 0.1% gain, though slowing sharply from Q1’s robust 0.7% pace. In output terms, growth was supported by a 0.4% qoq rise in services and a solid 1.2% qoq gain in construction, while the production sector contracted by -0.3% qoq. Real GDP per head grew 0.2% qoq over the quarter, underlining modest but broad-based expansion despite headwinds.
Some of the Q2 slowdown was likely due to front-loading in Q1, with activity pulled forward into February and March ahead of April’s stamp duty changes and US tariffs.
June posted a strong 0.4% mom rebound—double consensus, back-to-back declines in April and May. Within the monthly data, services output climbed 0.3% mom, production rose 0.7% mom, and construction gained 0.3% mom.
Australia jobs rebound with 24.5k growth in July, unemployment ticks lower
Australia’s labor market showed renewed strength in July, with employment rising by 24.5k, just shy of expectations for a 25.3k gain and a marked improvement from June’s tepid 1k increase. The headline was boosted by a sharp 60.5k jump in full-time positions, which more than offset a -35.9k drop in part-time jobs.
The unemployment rate eased from 4.3% to 4.2%, in line with forecasts, while the participation rate held steady at 67.0%. Signs of underlying resilience were also reflected in a 0.3% mom increase in total hours worked.
The strong full-time hiring points to ongoing momentum in higher-quality job creation, which could temper any immediate RBA shift toward further easing as policymakers weigh domestic strength against global uncertainties.
EUR/USD Mid-Day Outlook
Daily Pivots: (S1) 1.1673; (P) 1.1701; (R1) 1.1734; More...
Intraday bias in EUR/USD is turned neutral again with current retreat. Some consolidations would be seen below 1.1729. Further rise is expected as long as 1.1589 support holds. Above 1.1729 will target a retest on 1.1829 high. Firm break there will resume larger up trend to 1.1916 projection level. On the downside, however, break of 1.1589 support will delay the bullish case and extend the corrective pattern from 1.1829 with another falling leg.
In the bigger picture, rise from 0.9534 long term bottom could be correcting the multi-decade downtrend or the start of a long term up trend. In either case, further rise should be seen to 100% projection of 0.9534 to 1.1274 from 1.0176 at 1.1916. This will remain the favored case as long as 1.1604 support holds.
US initial jobless claims fall to 224k vs exp 227k
US initial jobless claims fell -3k to 224k in the week ending August 9, slightly below expectation of 227k. Four-week moving average of initial claims rose 750 to 222k.
Continuing claims fell -15k to 1953k in the week ending August 2. Four-week moving average of continuing claims rose 500 to 1951k.