Sample Category Title
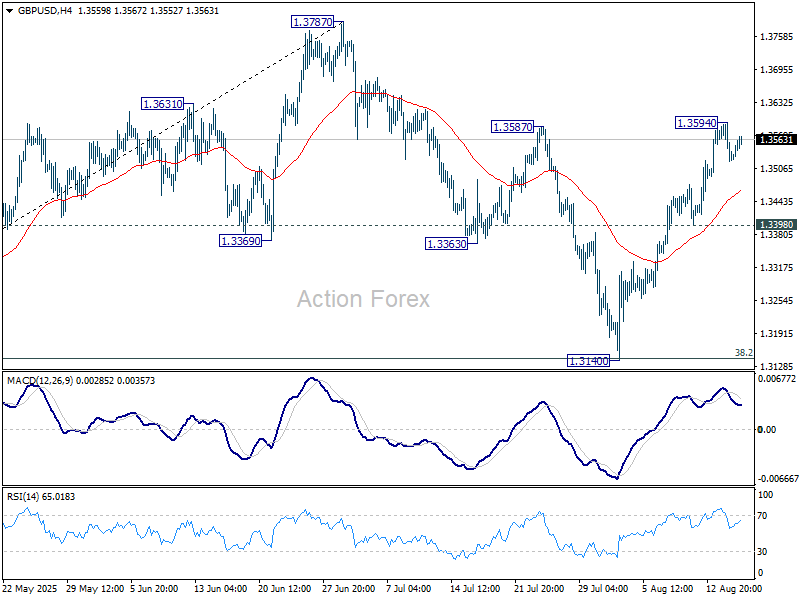
GBP/USD Mid-Day Outlook
Daily Pivots: (S1) 1.3502; (P) 1.3549; (R1) 1.3576; More...
GBP/USD is still extending consolidations below 1.3594 temporary top and intraday bias remains neutral. Further rally is expected as long as 1.3398 support holds. Above 1.3594 will extend the rise from 1.3140 to retest 1.3787 high.
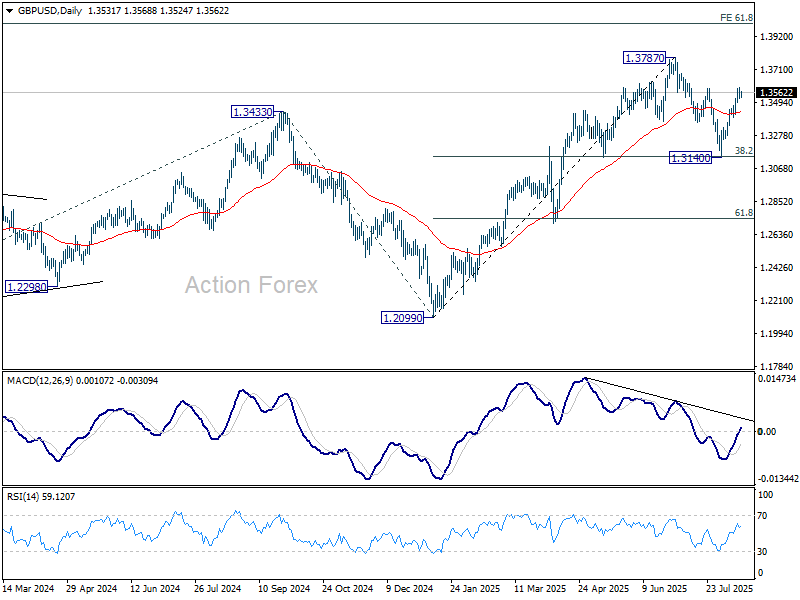
In the bigger picture, up trend from 1.3051 (2022 low) is in progress. Next medium term target is 61.8% projection of 1.0351 to 1.3433 from 1.2099 at 1.4004. Outlook will now stay bullish as long as 55 W EMA (now at 1.3068) holds, even in case of deep pullback.
EUR/USD Mid-Day Outlook
Daily Pivots: (S1) 1.1615; (P) 1.1665; (R1) 1.1700; More...
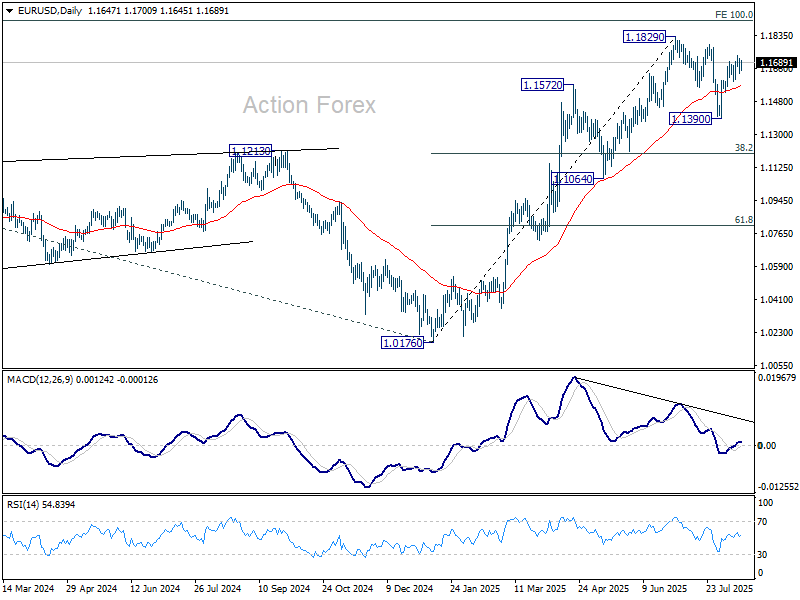
EUR/USD recovered after hitting 55 4H EMA but stays below 1.1.729 temporary top. Intraday bias remains neutral and more consolidations could be seen. But further rally is expected as long as 1.1589 support holds. Above 1.1729 will target a retest on 1.1829 high. Firm break there will resume larger up trend to 1.1916 projection level. On the downside, however, break of 1.1589 support will delay the bullish case and extend the corrective pattern from 1.1829 with another falling leg.
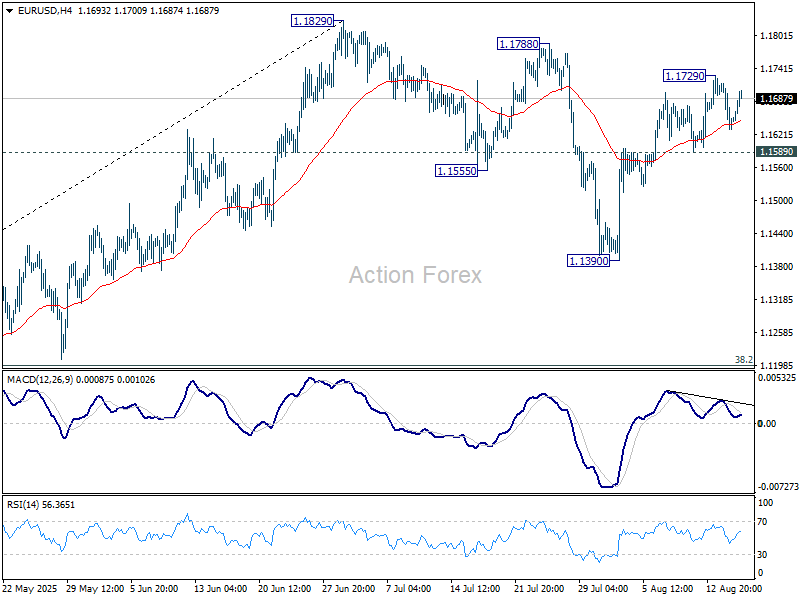
In the bigger picture, rise from 0.9534 long term bottom could be correcting the multi-decade downtrend or the start of a long term up trend. In either case, further rise should be seen to 100% projection of 0.9534 to 1.1274 from 1.0176 at 1.1916. This will remain the favored case as long as 1.1604 support holds.
Dollar Drifts Lower Despite Solid Retail sales, High-Stakes Alaska Summit Awaited
Dollar turned weaker in early US session on Friday despite solid US retail sales data that matched expectations. After a week packed with inflation reports and commentaries from Fed officials, traders are paring back some of their more aggressive Fed easing bets. However, this recalibration has offered little extra support to the greenback.
Market pricing now shows the odds of a September rate cut slipping below the 90% threshold. While a 25bps cut is still the firm consensus for the next FOMC meeting, conviction has softened, with traders looking for further confirmation before committing. Importantly, there’s still one more CPI and nonfarm payrolls print before policymakers gather in September, leaving the situation highly fluid.
The focus has shifted sharply toward Alaska, where US President Donald Trump meets Russian President Vladimir Putin later today. The summit is being closely watched for any breakthrough toward ending the war in Ukraine. Trump has publicly lowered expectations, framing the talks as exploratory, yet has repeated threats of “very severe consequences” if Moscow refuses to move toward a ceasefire. Markets will be alert to whether those threats take tangible form.
Ukraine and European allies, left out of the talks, remain doubtful. Kyiv warns that Russia’s gestures toward peace are disingenuous and claims fresh offensives are being prepared. These accusations, if validated by post-summit developments, could quickly sour global risk sentiment and drive safe-haven flows.
In weekly performance, Dollar’s weakness is most notable against Sterling and Yen, while Euro is also holding gains. Kiwi is the week’s laggard, followed by Loonie and Aussie. Swiss Franc and the greenback itself are stuck in the middle of the pack.
In Europe, at the time of writing, FTSE is down -0.14%. DAX is up 0.05%. CAC is up 0.52%. UK 10-year yield rose 0.016 to 4.664. Germany 10-year yield rose 0.045 to 2.760. Earlier in Asia, Nikkei rose 1.71%. Hong Kong HSI fell -0.98%. China Shanghai SSE rose 0.83%. Singapore Strait Times fell -0.61%. Japan 10-year JGB yield rose 0.014 to 1.566.
US retail sales match forecasts with 0.5% mom gain
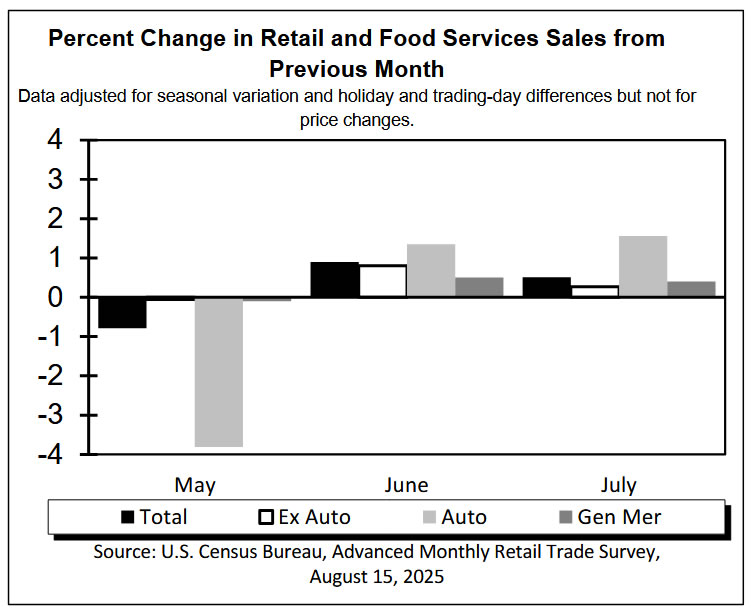
US retail sales rose 0.5% mom in July to USD 726.3B, in line with expectations, suggesting consumer spending momentum remains intact.
Excluding autos, sales rose 0.3% mom, also matching forecasts, while ex-gasoline sales climbed 0.5% mom. The narrower measure excluding both autos and gasoline advanced 0.2% mom.
Over the May–July period, total sales were 3.9% higher than a year ago, pointing to steady year-on-year growth despite elevated price pressures.
Separately, import prices rose 0.4% mom in July, beating expectations for no change. The gain hints at renewed external price pressures, which may partly reflect higher energy prices, but could also be linked to currency movements and tariffs.
Meanwhile, Empire State Manufacturing Index surprised sharply to the upside, jumping from 5.5 in July to 11.9 in August, far exceeding the expected -1.
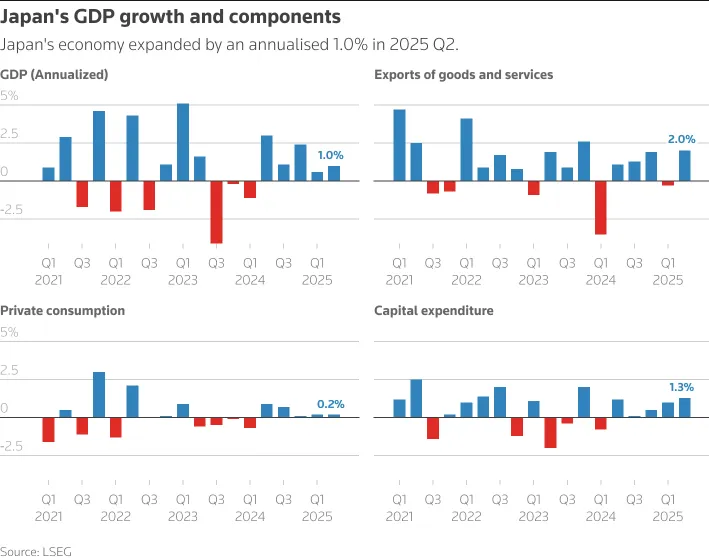
Japan's GDP extends growth streak to fifth quarter on strong investment and exports
Japan’s economy expanded 0.3% qoq in Q2, topping expectations of 0.1% qoq. Q1 figures were also revised up to 0.1% qoq growth from a prior estimate of contraction. On an annualized basis, GDP rose 1.0% , marking a fifth consecutive quarter of expansion—a sign of steady, if moderate, momentum.
Capital investment increased 1.3% qoq, extending its growth streak to five quarters, reflecting resilient corporate spending. Exports also provided a boost with a 2.0% rise, outpacing the 0.6% gain in imports, which act as a drag on GDP. The combination of solid external demand and firm investment highlights a balanced growth profile.
Private consumption, which accounts for more than half of Japan’s economic activity, inched up 0.2% qoq. The soft household spending highlights the need for wage growth and consumer confidence to strengthen if Japan is to build on its investment-led momentum and secure a more balanced recovery.
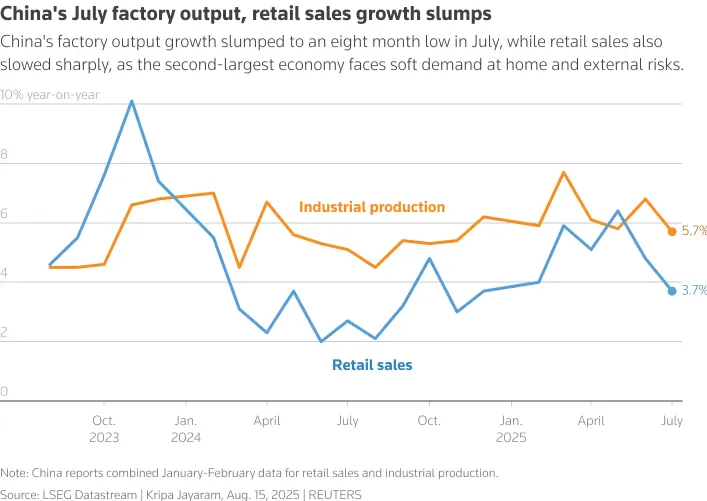
China’s growth momentum fades as July data misses forecasts
China’s July economic activity slowed more than expected, with industrial production rising 5.7% yoy, short of the 6.0% yoy forecast and easing from June’s 6.8% yoy. Retail sales growth also disappointed, up 3.7% yoy versus the 4.6% yoy expected, marking a slowdown from 4.8% yoy in the prior month.
From January to July, fixed asset investment grew just 1.6% yoy, well below the 2.7% yoy forecast and down from 2.8% previously yoy, marking the weakest pace since September 2000. The persistent downturn in the property sector remains a major drag, with property investment contracting -12% yoy over the first seven months.
NZ BNZ PMI back in growth zone as new orders surge
New Zealand’s manufacturing sector returned to growth in July, with the BusinessNZ Performance of Manufacturing Index rising from 49.2 to 52.8, moving back above the historical average of 52.5.
All five sub-indices registered expansion, led by New Orders at 54.2—its highest since March 2022—and Production at 53.6, the strongest since August 2022. Finished Stocks and Deliveries of Raw Materials also posted modest growth, while Employment (50.1) edged back above the no-change level after two months of contraction.
Despite this encouraging turnaround, sentiment among manufacturers remains guarded. The share of negative comments fell to 58.6% from June’s 65.5%.
Respondents continued to highlight weak demand, rising costs, and ongoing economic uncertainty. Tariffs, subdued construction activity, and soft consumer spending were cited as key headwinds, with many firms noting delayed projects and a tendency for customers to place only essential orders.
EUR/USD Mid-Day Outlook
Daily Pivots: (S1) 1.1615; (P) 1.1665; (R1) 1.1700; More...
EUR/USD recovered after hitting 55 4H EMA but stays below 1.1.729 temporary top. Intraday bias remains neutral and more consolidations could be seen. But further rally is expected as long as 1.1589 support holds. Above 1.1729 will target a retest on 1.1829 high. Firm break there will resume larger up trend to 1.1916 projection level. On the downside, however, break of 1.1589 support will delay the bullish case and extend the corrective pattern from 1.1829 with another falling leg.
In the bigger picture, rise from 0.9534 long term bottom could be correcting the multi-decade downtrend or the start of a long term up trend. In either case, further rise should be seen to 100% projection of 0.9534 to 1.1274 from 1.0176 at 1.1916. This will remain the favored case as long as 1.1604 support holds.
US retail sales match forecasts with 0.5% mom gain
US retail sales rose 0.5% mom in July to USD 726.3B, in line with expectations, suggesting consumer spending momentum remains intact.
Excluding autos, sales rose 0.3% mom, also matching forecasts, while ex-gasoline sales climbed 0.5% mom. The narrower measure excluding both autos and gasoline advanced 0.2% mom.
Over the May–July period, total sales were 3.9% higher than a year ago, pointing to steady year-on-year growth despite elevated price pressures.
Separately, import prices rose 0.4% mom in July, beating expectations for no change. The gain hints at renewed external price pressures, which may partly reflect higher energy prices, but could also be linked to currency movements and tariffs.
Meanwhile, Empire State Manufacturing Index surprised sharply to the upside, jumping from 5.5 in July to 11.9 in August, far exceeding the expected -1.
EUR/CHF Technical: Major Bullish Bottom Supported by European Stocks’ Outperformance
EUR/CHF continues to lag its major peer, EUR/USD. Since the May 2025 low, EUR/USD has surged 5.6%, while EUR/CHF has barely budged, posting just a 1.2% gain, highlighting the cross’s relative weakness in recent months.
Interestingly, several technical elements are now flashing signs of a potential medium-term (1to 3 weeks) bullish movement for the EUR/CHF as a catch-up tactical play.
Let’s dive deeper into it from a technical analysis perspective.
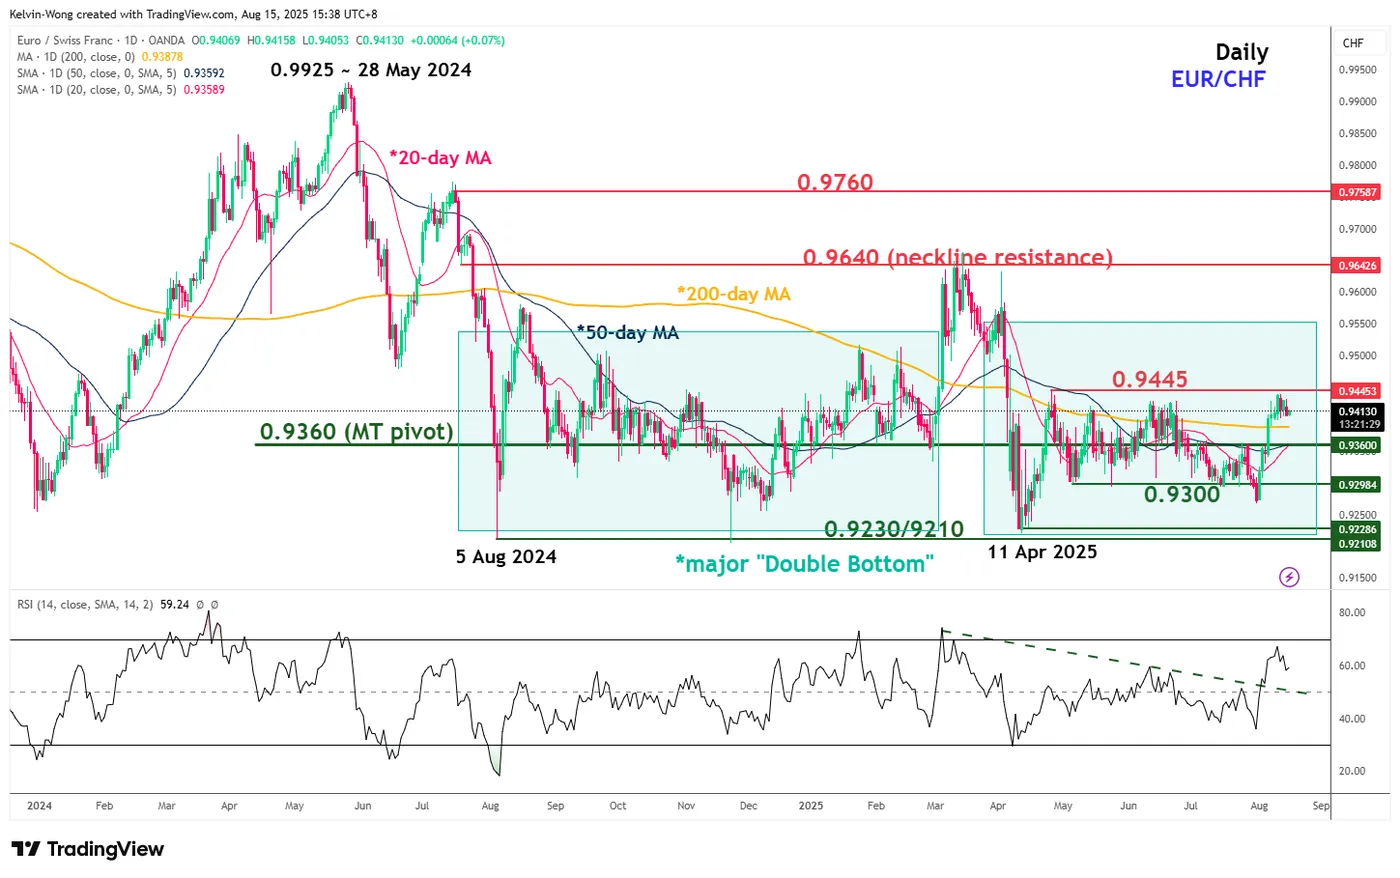
Fig. 1: EUR/CHF major & medium-term trends as of 15 Aug 2025 (Source: TradingView)
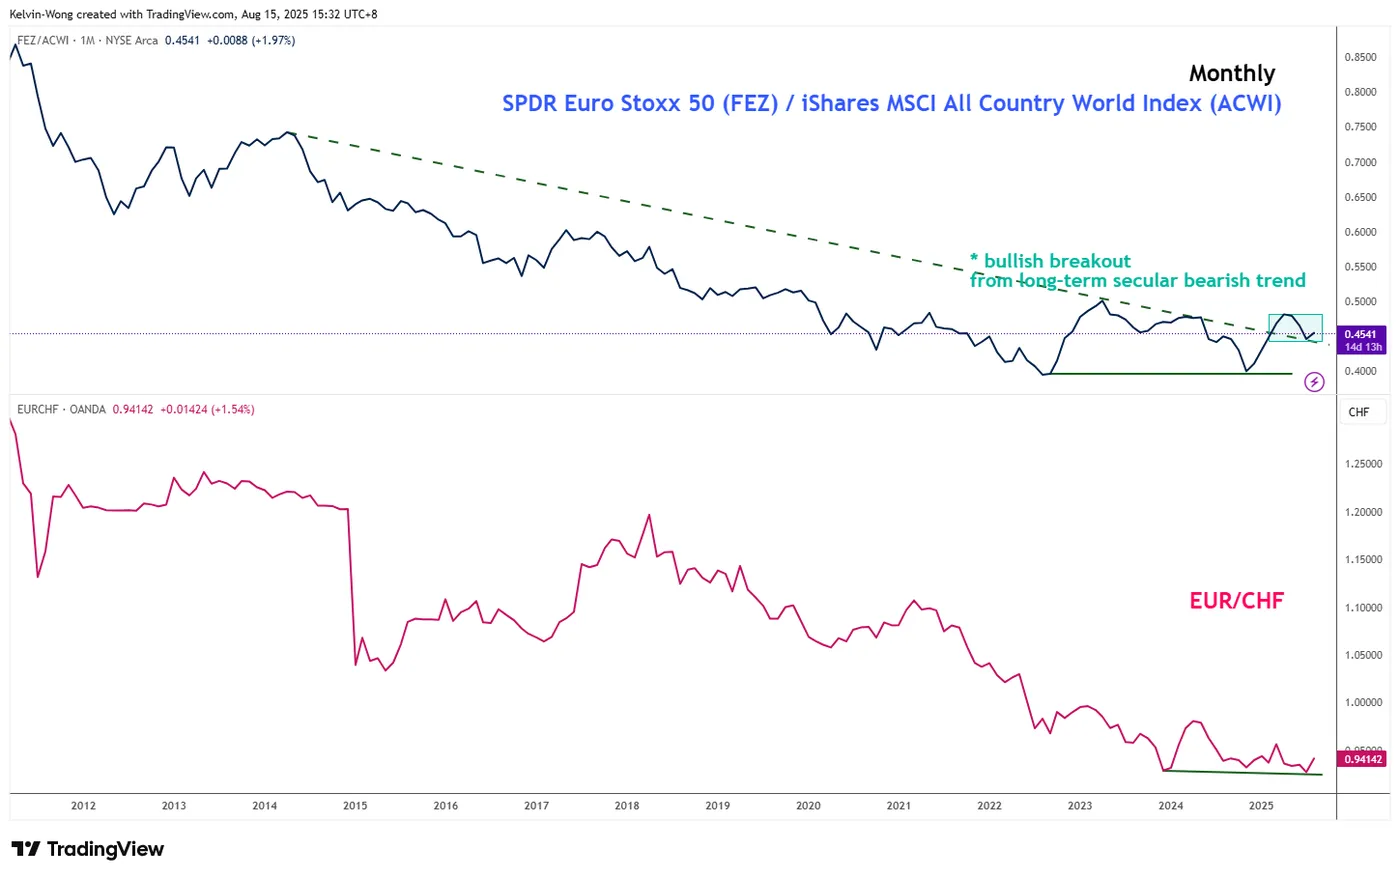
Fig. 2: Long-term secular trends of EUR/CHF & ratio of Euro Stoxx 50 ETF/MSCI All Country World Index ETF as of 14 Aug 2025 (Source: TradingView)
Preferred trend bias (1-3 weeks)
Bullish bias above 0.9360 key medium-term pivotal support (also the intersection points of the 20-day and 50-day moving averages), and clearance above 0.9445 sees the next medium-term resistance coming in at 0.9640 (neckline of the “Double Bottom”) in the first step (see Fig. 1).
Key elements
- EUR/CHF has regained upward traction, trading above its 20-, 50-, and 200-day moving averages following a -4.5% corrective decline from the 13 May 2025 high to the 11 April 2024 low. Technical structure indicates the cross may be progressing into the second upleg of a broader bullish bottoming formation that has been evolving since 3 August 2024 (see Fig.1).
- The daily RSI momentum indicator of the EUR/CHF remains in a medium-term bullish zone, holding above the 50 level while staying clear of overbought territory (above 70).
- The long-term secular trend of the EUR/CHF has a direct correlation with the ratio (relative strength) chart of the SPDR Euro Stoxx 50 over the iShares MSCI All Country World Index. The ratio chart has staged a major bullish breakout in April 2025, exiting its long-term secular bearish trend in place since April 2014 (see Fig. 2).
- This observation suggests that a major European stock market's outperformance (represented by the SPDR Euro Stoxx 50) against the rest of the world's stock markets is taking shape and may trigger a potentially significant bullish movement in the EUR/CHF cross pair.
Alternative trend bias (1 to 3 weeks)
Failure to hold at the 0.9360 support negates the bullish tone for a slide to expose 0.9300 and even the major support of 0.9230/9210.
EUR/USD Shows Optimism Ahead of Trump–Putin Meeting
The meeting between the Presidents of the United States and the Russian Federation, scheduled for today in Alaska, is a major geopolitical event with the potential to exert a significant influence on financial markets.
Expectations are mounting that the talks could lead to a cessation of hostilities in Ukraine – a prospect acting as a bullish factor for the euro. As a result, the EUR/USD chart has been displaying an upward trajectory this week (highlighted by the blue channel).
The blue arrow indicates that:
→ Yesterday’s release of the highest Producer Price Index (PPI) figures in three years triggered a sharp strengthening of the US dollar – possibly because market participants assumed the Federal Reserve might postpone monetary policy easing in light of rising producer prices (widely considered a consequence of Trump’s tariff measures).
→ However, the lower boundary of the upward channel prevented further decline, and today EUR/USD is showing optimism ahead of the presidential meeting.
EUR/USD Technical Analysis
On 7 August, we plotted a descending channel based on the sequence of lower highs and lows formed over the summer.
From the bearish perspective, the price is currently near a cluster of key resistance levels, which include:
→ the upper boundary of the descending (red) channel;
→ the 1.17145 level (a historical price interaction zone, as shown by the arrows on the left side of the chart);
→ the median line of the ascending (blue) channel.
Conversely, the bulls could be supported by:
→ the lower boundary of the blue channel;
→ the aggressive buying momentum evident in the sharp EUR/USD rally on 12 August (highlighted by the orange arrow).
The bullish case is further reinforced by the fact that buyers managed to fully recover from the decline that began on 28 July.
Given the above, we could assume some consolidation today as the market awaits the outcome of the presidential talks. The fact that the ADX indicator is hovering near its lows and trending downward underscores the current indecision and caution in the market.
However, Monday’s open could prove highly volatile. Be prepared for sharp EUR/USD movements in either direction, depending on statements made by the US and Russian leaders.
Trade over 50 forex markets 24 hours a day with FXOpen. Take advantage of low commissions, deep liquidity, and spreads from 0.0 pips. Open your FXOpen account now or learn more about trading forex with FXOpen.
This article represents the opinion of the Companies operating under the FXOpen brand only. It is not to be construed as an offer, solicitation, or recommendation with respect to products and services provided by the Companies operating under the FXOpen brand, nor is it to be considered financial advice.
Bear Attack on Bitcoin Frightening, But Not Break the Trend
Market Overview
The crypto market is clearly struggling to move upwards, as historic highs are also attracting sellers. On Friday morning, the total capitalisation of cryptocurrencies stood at $4.03 trillion, reflecting a 3.4% decline over 24 hours. Although this is unpleasant for bulls, it looks like a necessary correction to let off steam while the market remains above the July highs of $3.90-3.95 trillion, a break below which would signal a trend reversal.
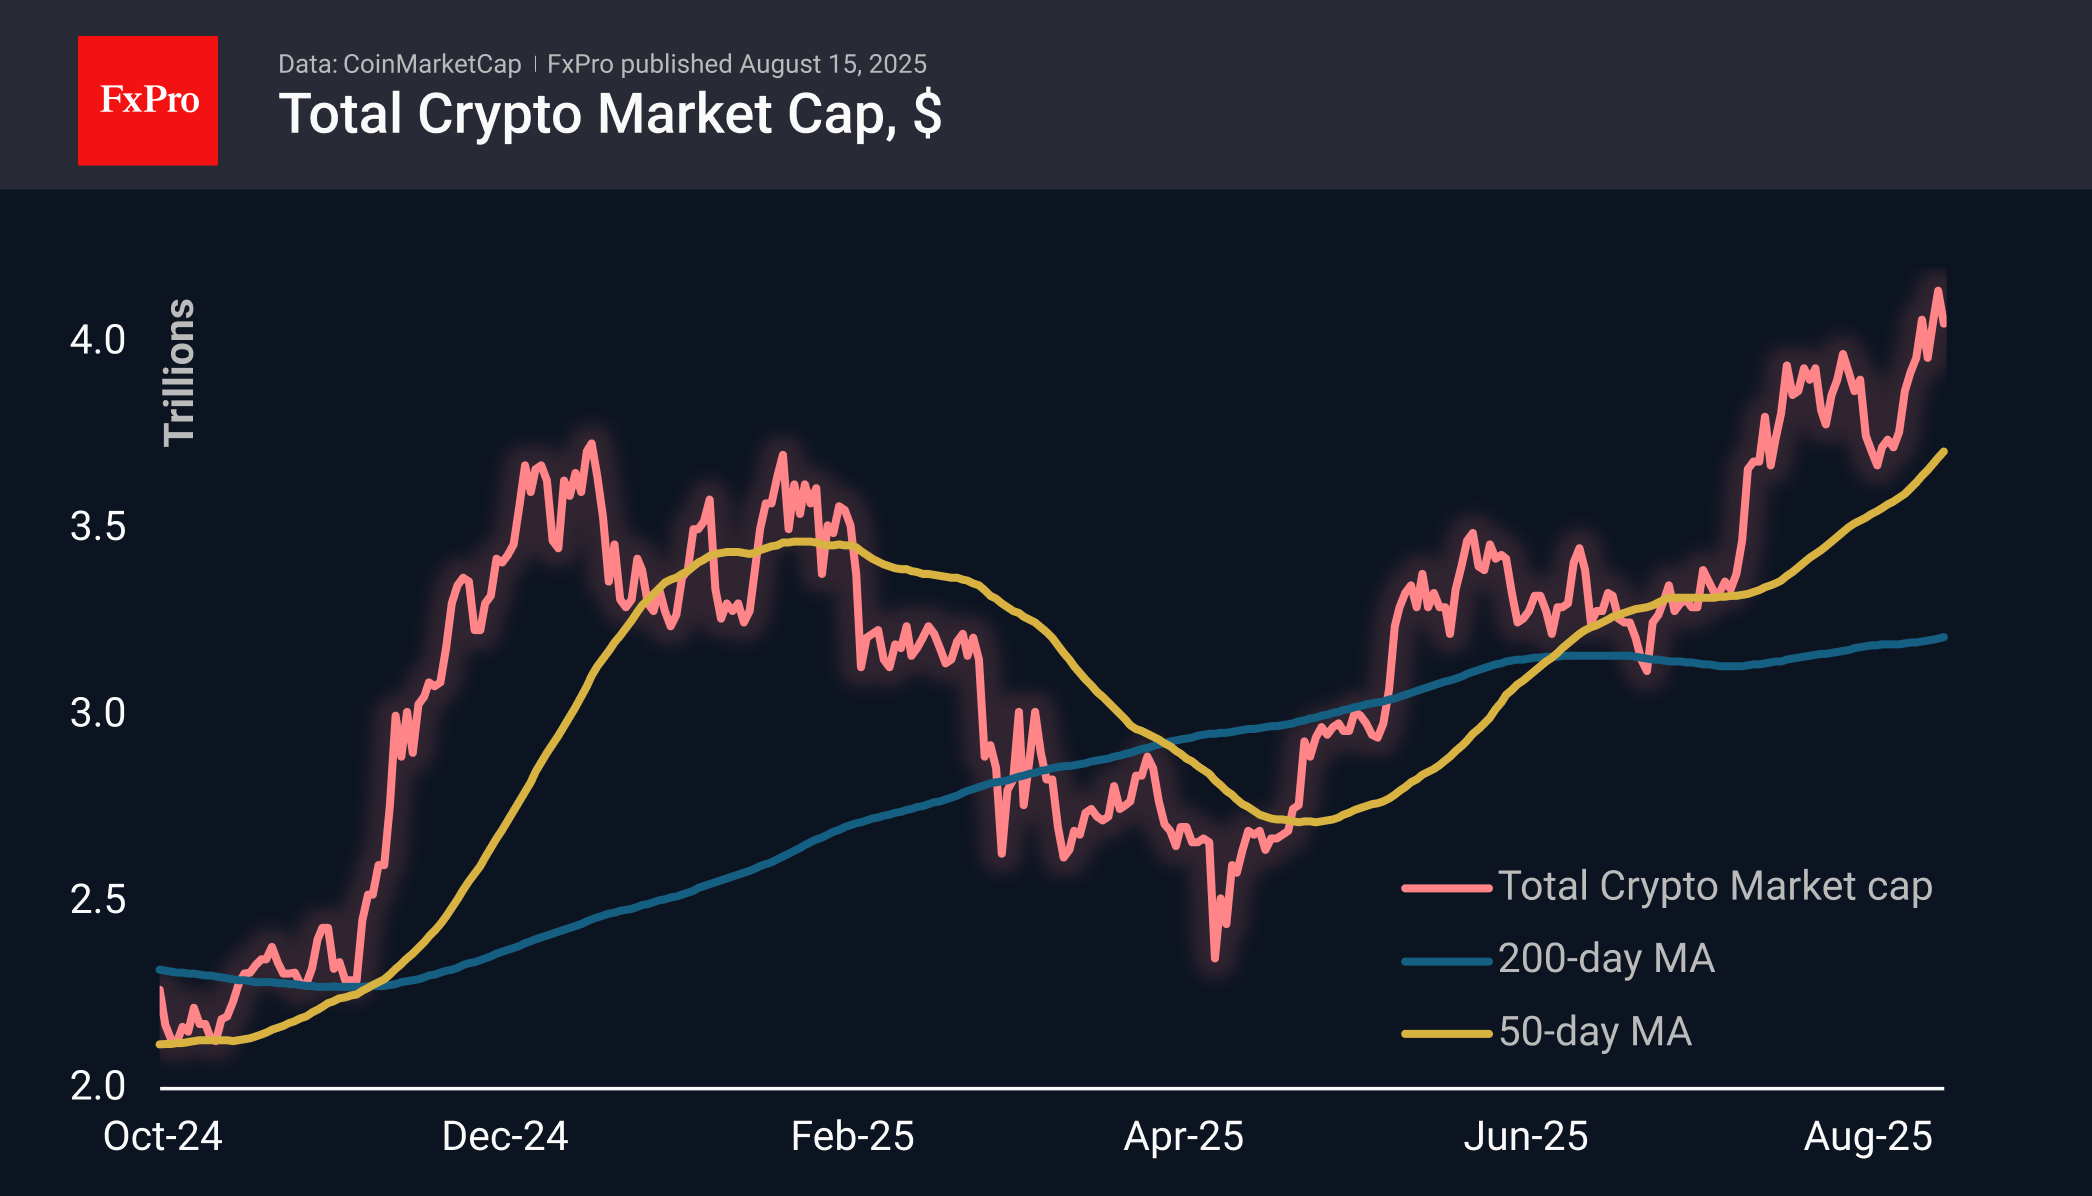
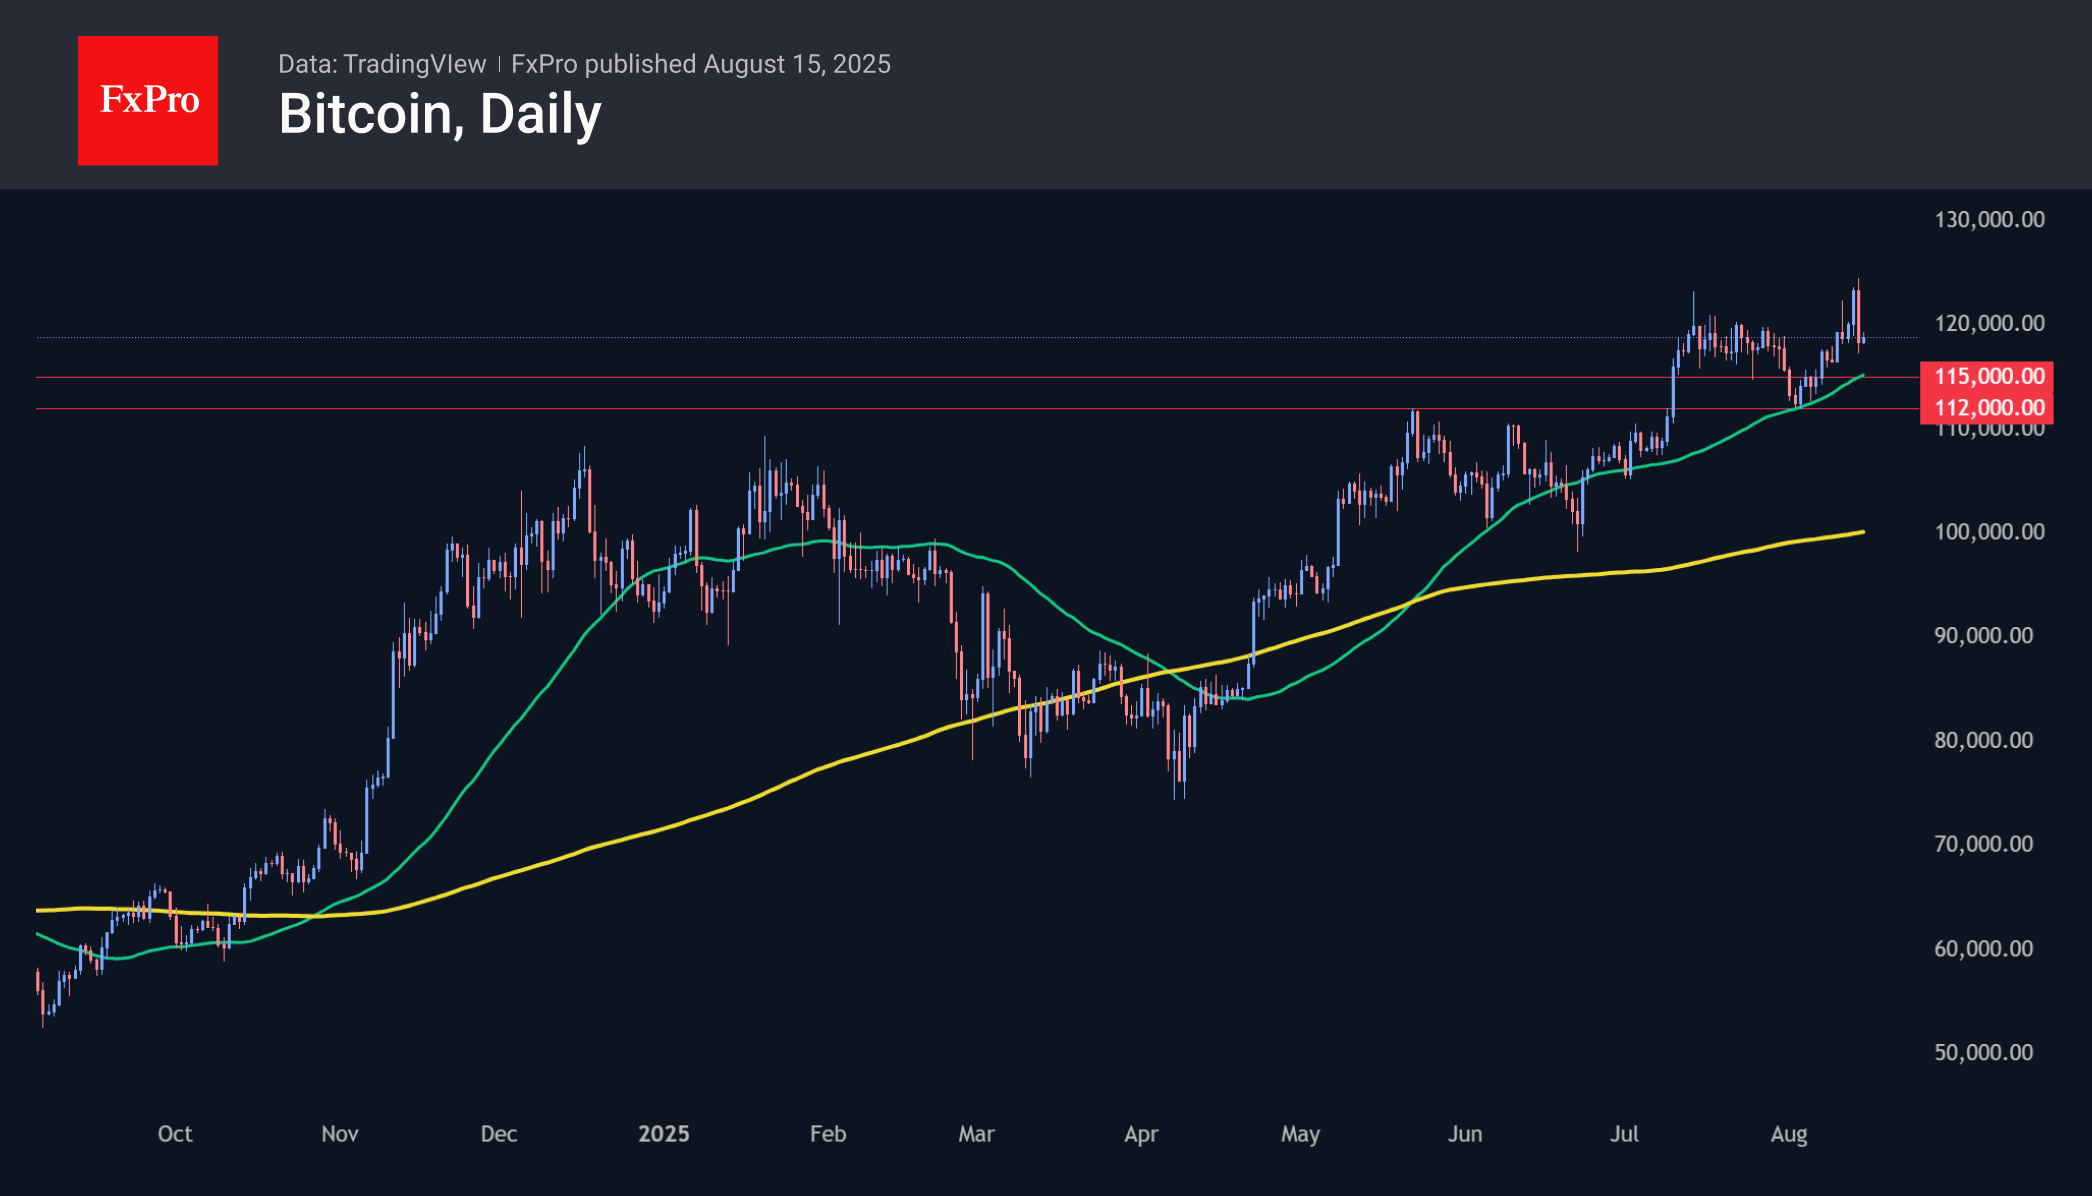
Bitcoin fell to $117K on Thursday, becoming the first domino to fall, which subsequently pulled down the entire cryptocurrency market. This is further evidence of increased selling pressure shortly after the historic highs were updated. We believe that the fairly coordinated attack by bears is a cover for careful but abundant purchases on dips. It is worth sounding the alarm if there is a break below the 50-day average at $115K and the area of recent lows at $112K.
News Background
The leading cryptocurrency is facing serious competition from Ethereum. The US Congress’s adoption of the stablecoin bill has opened the door to the mass adoption of these tokens. About half of them use the Ethereum blockchain.
The Ether rally is outpacing Bitcoin’s upward movement since it correlates more with US stock indices than Bitcoin. Specialised exchange-traded funds focused on Ether attracted $1.7 billion in August. During the same period, Bitcoin ETFs faced an outflow of $436 million. The reserves of crypto treasuries working with Ether grew to $17 billion.
The growing popularity of the second-largest digital asset has allowed Standard Chartered to raise its forecast for Ethereum from $4,000 to $7,500 by the end of the year.
The fate of cryptocurrencies still depends on changes in global risk appetite. Therefore, a continuation of the S&P 500 rally will push both Bitcoin and Ether to new record highs.
USD/JPY Declines as Yen Regains Strength
The USD/JPY pair dropped to 147.19 on Friday, clawing back losses from the previous session. The move followed stronger-than-expected GDP data and rising speculation that the Bank of Japan (BoJ) could hike interest rates.
Japan’s economy expanded by 0.3% in Q2, up from 0.1% in Q1, matching forecasts. The growth was primarily driven by net exports, which contributed 0.3 percentage points, despite pressure from US tariffs.
The yen drew further support from remarks by US Treasury Secretary Scott Bessent, who suggested the BoJ is falling behind in tackling inflation. Market pressure is also mounting on the central bank to abandon its inflation target—currently tied to domestic demand and wage growth—which could limit its ability to tighten monetary policy.
However, BoJ Governor Kazuo Ueda maintained a cautious stance, emphasising that core inflation remains below the 2% target.
Technical Analysis: USD/JPY
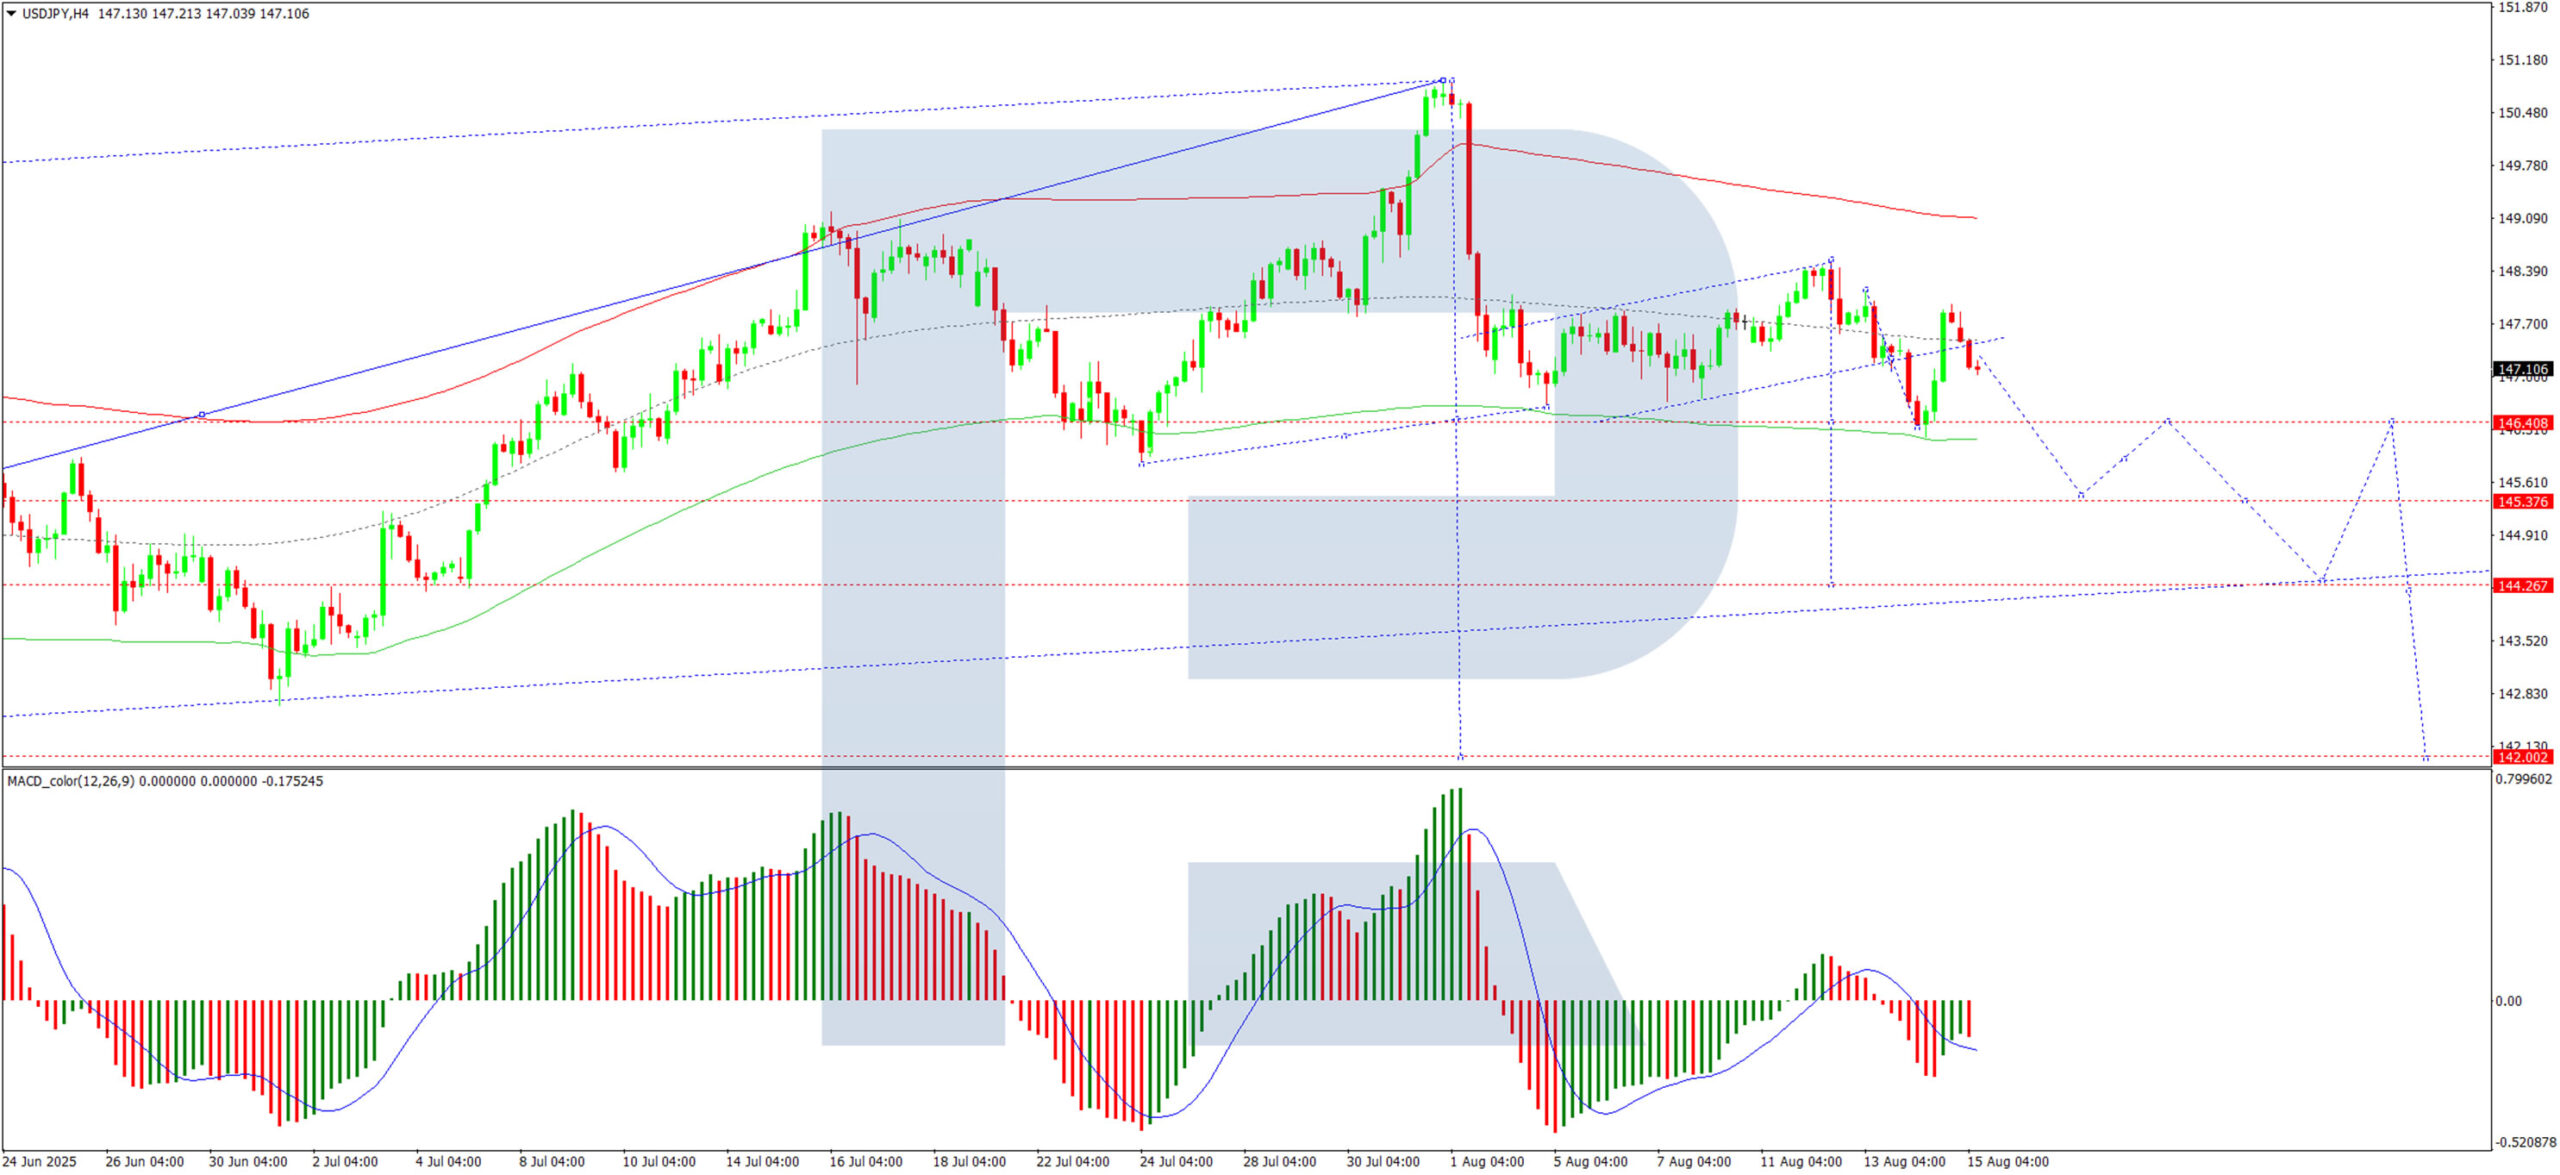
H4 Chart:
On the H4 chart, USD/JPY continues its downward trajectory, eyeing 146.14—a level likely to be tested today. A rebound to 147.30 is possible before another decline towards 145.45, with further downside potential to 144.30. This scenario is supported by the MACD indicator, where the signal line remains below zero and pointing sharply downward.
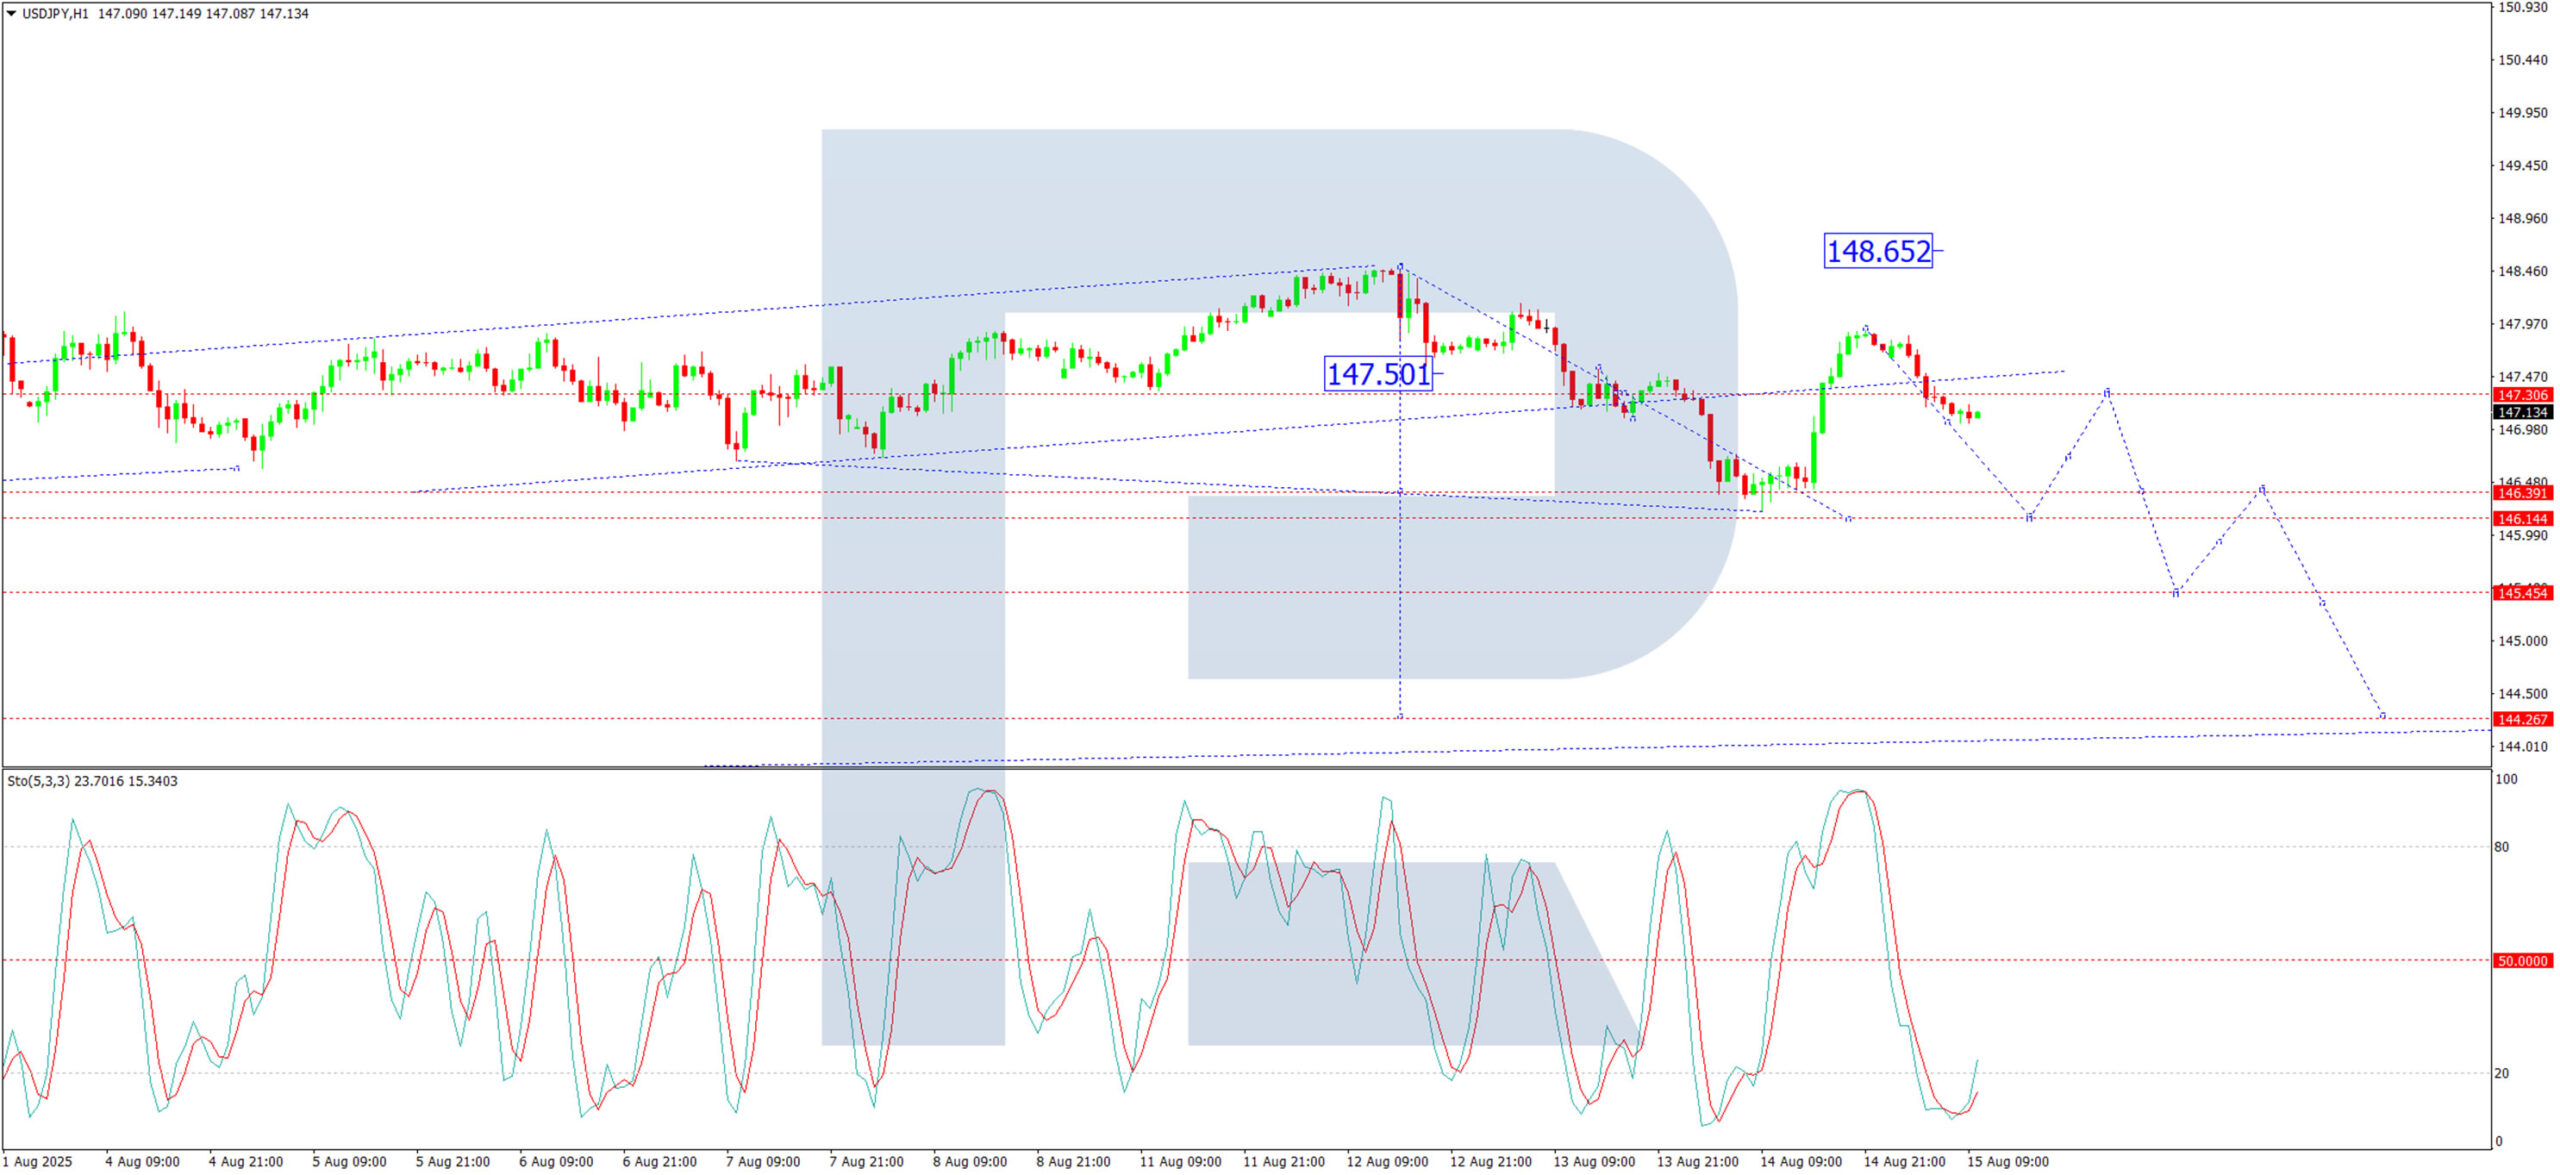
H1 Chart:
On the H1 chart, the pair is forming a descending wave structure, targeting 146.16. A corrective bounce to 147.30 may follow before the downtrend potentially resumes towards 145.45. The Stochastic oscillator reinforces this view, with its signal line below 50 and trending firmly downward.
Conclusion
The yen’s rebound reflects improving economic data and shifting BoJ rate expectations, while technical indicators suggest further downside for USD/JPY in the near term.
Japan GDP Surprise, China Data Disappoints, Trump-Putin Meeting in Focus as DAX Advances Following Breakout
Asia Market Wrap - Japan, China Data, Stocks Steady
Hong Kong stocks fell 1.2% after data showed China’s economy slowed in July, with weak factory activity and retail sales. This suggests Donald Trump’s trade war is affecting the world’s second-largest economy. Meanwhile, Japanese stocks rose 1% as the country’s economy grew faster than expected last quarter.
MSCI's broad Asia-Pacific index (outside Japan) dropped 0.2%. Japan's Nikkei 225 bounced back 1.6%, nearing a record high after a big drop on Thursday, which ended its six-day winning streak. Australian stocks rose 0.7%, while Hong Kong stocks fell 1.1%.
China's CSI 300 index went up 0.8% after weaker-than-expected July economic data, like retail sales and industrial production, raised hopes for new government stimulus. Markets in India and South Korea are closed for holidays.
Earlier, hopes for US monetary easing had boosted market confidence, with traders expecting a quarter-point rate cut. However, US wholesale inflation rose in July at its fastest pace in three years, causing traders to lower the chances of a September rate cut to 90%, down from being fully certain before.
Japan GDP Posts Upside Surprise
Japan's economy grew faster than expected in the second quarter, with GDP rising 1.0% annually, marking five straight quarters of growth. This was supported by strong exports and capital spending, despite US tariffs. The growth beat market expectations of 0.4% and followed a revised 0.6% rise in the previous quarter.
Source: LSEG
However, analysts warn that US tariffs and global uncertainties could hurt Japan's economy in the coming months, especially for automakers trying to keep prices low for US customers.
China Data Disappoints as Factory Output and Retail Sales Slump
China's factory output growth hit an eight-month low in July, and retail sales slowed sharply, increasing pressure on policymakers to boost the $19 trillion economy with more stimulus.
Challenges include US trade policies, extreme weather, tough domestic competition, and a weak property sector. Industrial output grew 5.7% in July, down from 6.8% in June and below the 5.9% forecast. Retail sales rose 3.7%, the slowest since December 2024, missing the expected 4.6% increase.
Source: LSEG
European Open - European Indexes Higher Ahead Trump-Putin Meeting
Heading into the European Open, Pan-region futures rose 0.5%, German DAX futures increased 0.5%, and FTSE futures also gained 0.5%.
Investors are keeping a close eye on US President Donald Trump's meeting with Russia's Vladimir Putin on Friday, aimed at ending the war in Ukraine.
There’s concern about how long any agreement might last, and European leaders worry the US and Russia could make big decisions that leave them out or pressure Ukraine into a bad deal.
If the Trump-Putin Alaska summit gets positive feedback, European stocks are likely to see a boost. The details matter, and Europe is unlikely to fully welcome Russia, even if peace is restored. This means defense stocks might slow down their steady rise but won’t face major setbacks.
On the FX front, The euro and British pound stayed mostly unchanged after dropping 0.5% and 0.3% in the previous session, ahead of US retail sales data.
The Japanese yen strengthened thanks to surprisingly strong economic growth, with exports holding up well against new US tariffs.
The Australian dollar remained steady, while the Chinese yuan fell from a two-week high due to weaker-than-expected economic data.
Currency Power Balance
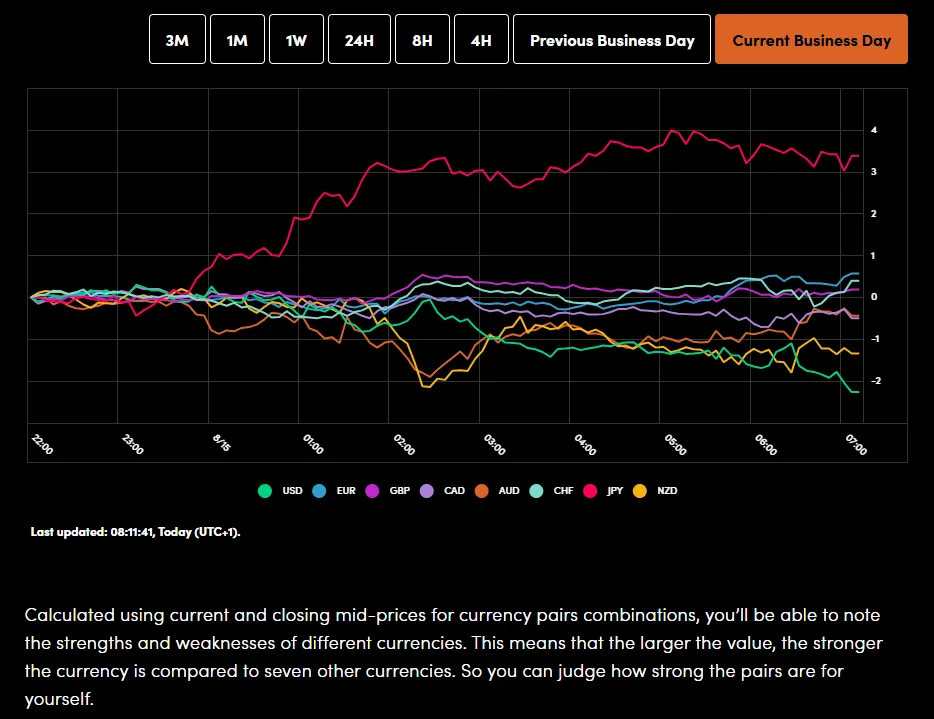
Source: OANDA Labs
For more on Gold, please read Gold's (XAU/USD) Recovers to $3350/oz After Mixed CPI Reaction. What Next?
Economic Data Releases and Final Thoughts
Looking at the economic calendar, a busy day lies ahead.
Geopolitics will be in the news as the Trump-Putin meeting gets underway while we also have the Jackson Hole Symposium where all eyes will be on Fed Chair Jerome Powell.
From a data perspective, the US session brings retail sales numbers will give a glimpse to consumer demand but the bigger one could be the Michigan Consumer Sentiment data.
It will be interesting to see where survey respondents see inflation expectations over the 12 months in particular.
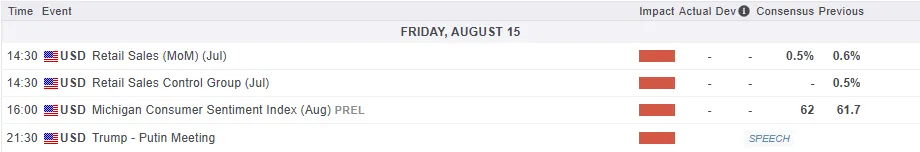
For all market-moving economic releases and events, see the MarketPulse Economic Calendar. (click to enlarge)
Chart of the Day - DAX Index
From a technical standpoint, the DAX index has continued to advance following yesterdays breakout.
DAX Index Two-Hour Chart, August 15. 2025
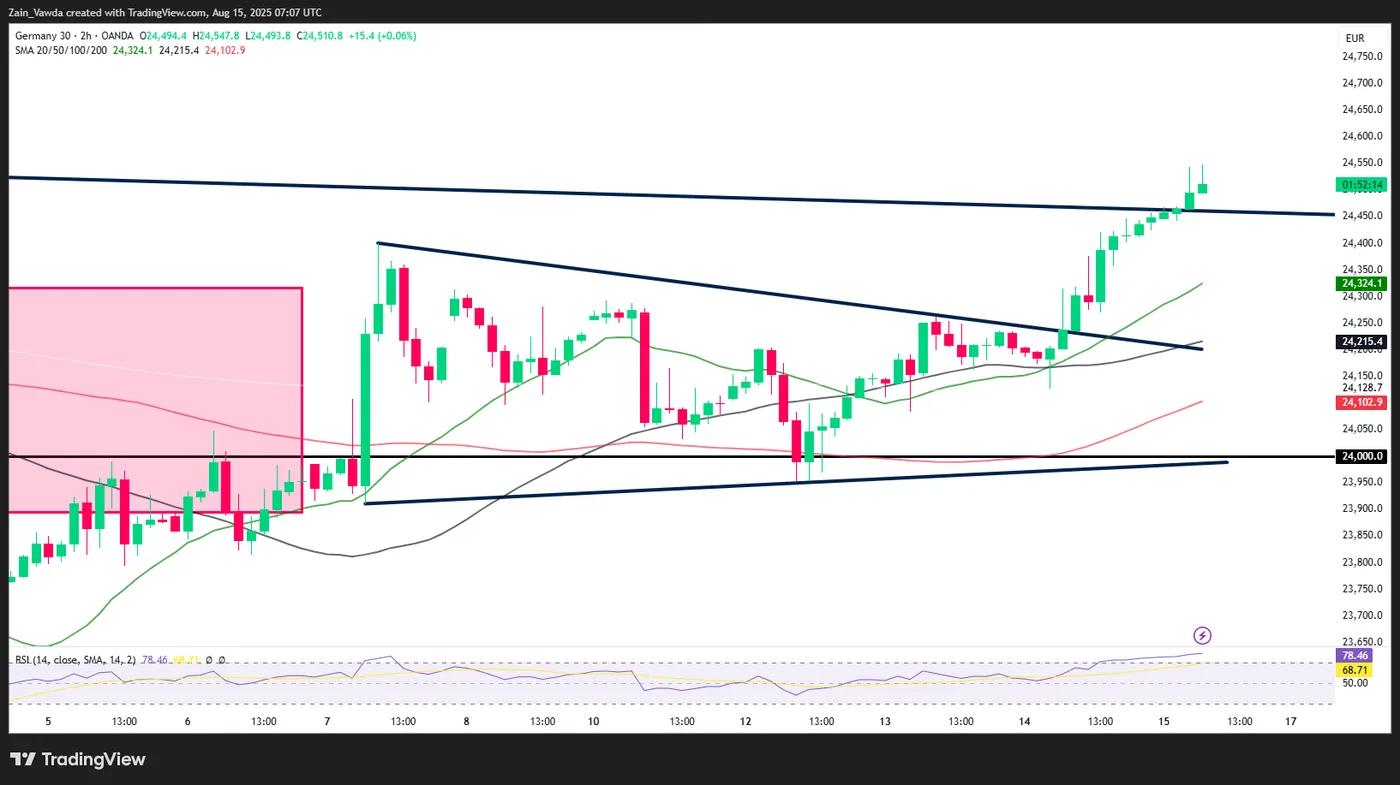
Source: TradingView.com (click to enlarge)
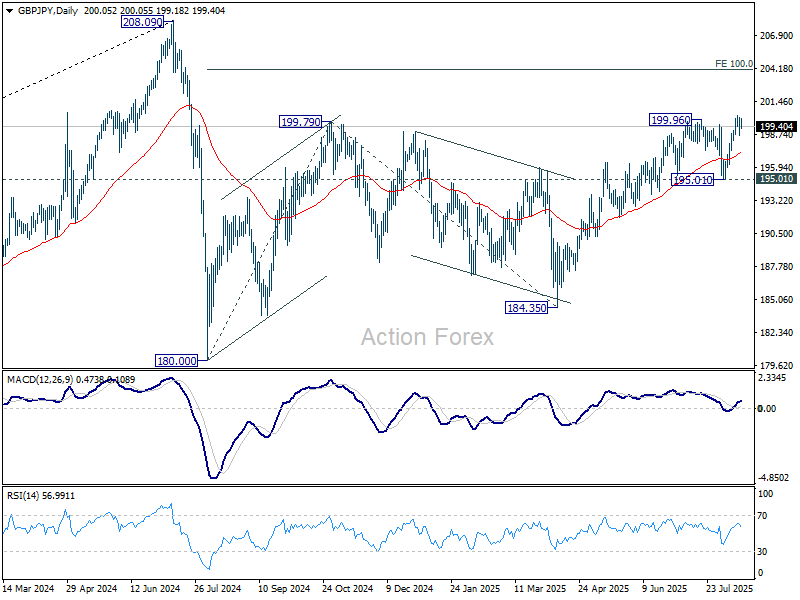
GBP/JPY Daily Outlook
Daily Pivots: (S1) 198.96; (P) 199.56; (R1) 200.53; More...
Intraday bias in GBP/JPY remains neutral and more consolidations could be seen below 200.26 temporary top. Near term outlook will stay bullish as long as 195.01 support holds. Above 200.26 will extend the rally from 180.00 to 100% projection of 180.00 to 199.79 from 184.35 at 204.14.
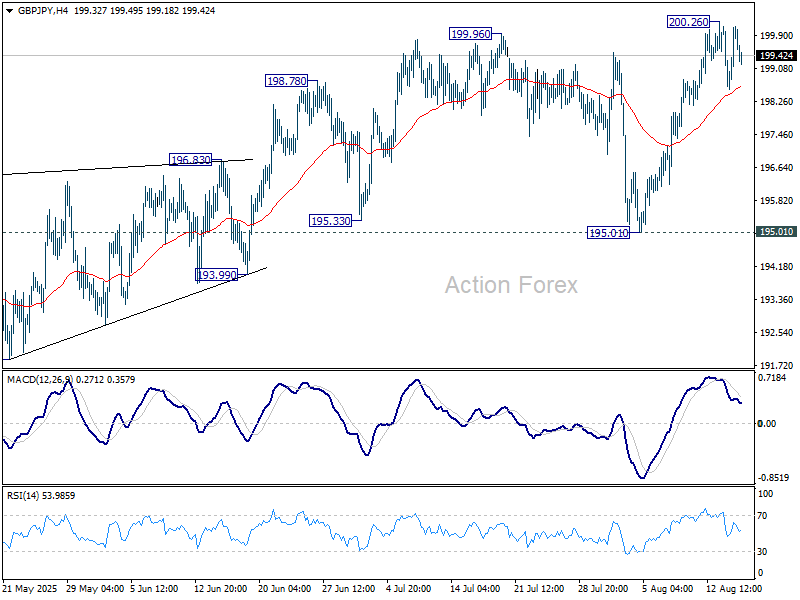
In the bigger picture, price actions from 208.09 (2024 high) are seen as a correction to rally from 123.94 (2020 low). The pattern might still extend with another falling leg. But in that case, strong support should be seen from 38.2% retracement of 123.94 to 208.09 at 175.94 to contain downside. Meanwhile, decisive break of 208.09 will confirm long term up trend resumption.