Sample Category Title
Summary 8/18 – 8/22
Monday, Aug 18, 2025
| GMT | Ccy | Events | Consensus | Previous |
|---|---|---|---|---|
| 22:30 | NZD | Business NZ PSI Jul | 47.3 | |
| 23:01 | GBP | Rightmove House Price Index M/M Aug | -1.20% | |
| 04:30 | JPY | Tertiary Industry Index M/M Jun | 0.30% | 0.60% |
| 09:00 | EUR | Eurozone Trade Balance (EUR) Jun | 17.5B | 16.2B |
| 12:15 | CAD | Housing Starts Jul | 259K | 284K |
| 14:00 | USD | NAHB Housing Market Index Aug | 33 | 33 |
| 22:45 | NZD | PPI Input Q/Q Q2 | 2.90% | |
| 22:45 | NZD | PPI Output Q/Q Q2 | 2.10% |
| GMT | Ccy | Events | |
|---|---|---|---|
| 22:30 | NZD | Business NZ PSI Jul | |
| Forecast: | Previous: 47.3 | ||
| 23:01 | GBP | Rightmove House Price Index M/M Aug | |
| Forecast: | Previous: -1.20% | ||
| 04:30 | JPY | Tertiary Industry Index M/M Jun | |
| Forecast: 0.30% | Previous: 0.60% | ||
| 09:00 | EUR | Eurozone Trade Balance (EUR) Jun | |
| Forecast: 17.5B | Previous: 16.2B | ||
| 12:15 | CAD | Housing Starts Jul | |
| Forecast: 259K | Previous: 284K | ||
| 14:00 | USD | NAHB Housing Market Index Aug | |
| Forecast: 33 | Previous: 33 | ||
| 22:45 | NZD | PPI Input Q/Q Q2 | |
| Forecast: | Previous: 2.90% | ||
| 22:45 | NZD | PPI Output Q/Q Q2 | |
| Forecast: | Previous: 2.10% | ||
Tuesday, Aug 19, 2025
| GMT | Ccy | Events | Consensus | Previous |
|---|---|---|---|---|
| 00:30 | AUD | Westpac Consumer Confidence Aug | 0.60% | |
| 08:00 | EUR | Eurozone Current Account (EUR) Jun | 30.3B | 32.3B |
| 12:30 | USD | Building Permits Jul | 1.39M | 1.40M |
| 12:30 | USD | Housing Starts Jul | 1.30M | 1.32M |
| 12:30 | CAD | CPI M/M Jul | 0.40% | 0.10% |
| 12:30 | CAD | CPI Y/Y Jul | 1.90% | |
| 12:30 | CAD | CPI Median Y/Y Jul | 3.10% | 3.10% |
| 12:30 | CAD | CPI Trimmed Y/Y Jul | 3.10% | 3.00% |
| 12:30 | CAD | CPI Common Y/Y Jul | 2.70% | 2.60% |
| 23:50 | JPY | Trade Balance (JPY) Jul | -0.08T | -0.24T |
| 23:50 | JPY | Machinery Orders M/M Jun | -0.50% | -0.60% |
| GMT | Ccy | Events | |
|---|---|---|---|
| 00:30 | AUD | Westpac Consumer Confidence Aug | |
| Forecast: | Previous: 0.60% | ||
| 08:00 | EUR | Eurozone Current Account (EUR) Jun | |
| Forecast: 30.3B | Previous: 32.3B | ||
| 12:30 | USD | Building Permits Jul | |
| Forecast: 1.39M | Previous: 1.40M | ||
| 12:30 | USD | Housing Starts Jul | |
| Forecast: 1.30M | Previous: 1.32M | ||
| 12:30 | CAD | CPI M/M Jul | |
| Forecast: 0.40% | Previous: 0.10% | ||
| 12:30 | CAD | CPI Y/Y Jul | |
| Forecast: | Previous: 1.90% | ||
| 12:30 | CAD | CPI Median Y/Y Jul | |
| Forecast: 3.10% | Previous: 3.10% | ||
| 12:30 | CAD | CPI Trimmed Y/Y Jul | |
| Forecast: 3.10% | Previous: 3.00% | ||
| 12:30 | CAD | CPI Common Y/Y Jul | |
| Forecast: 2.70% | Previous: 2.60% | ||
| 23:50 | JPY | Trade Balance (JPY) Jul | |
| Forecast: -0.08T | Previous: -0.24T | ||
| 23:50 | JPY | Machinery Orders M/M Jun | |
| Forecast: -0.50% | Previous: -0.60% | ||
Wednesday, Aug 20, 2025
| GMT | Ccy | Events | Consensus | Previous |
|---|---|---|---|---|
| 01:00 | CNY | 1-Y Loan Prime Rate | 3.00% | 3.00% |
| 01:00 | CNY | 5-Y Loan Prime Rate | 3.50% | 3.50% |
| 02:00 | NZD | RBNZ Interest Rate Decision | 3.00% | 3.25% |
| 06:00 | EUR | Germany PPI M/M Jul | 0.20% | 0.10% |
| 06:00 | EUR | Germany PPI Y/Y Jul | -1.30% | |
| 06:00 | GBP | CPI M/M Jul | 0.30% | |
| 06:00 | GBP | CPI Y/Y Jul | 3.70% | 3.60% |
| 06:00 | GBP | Core CPI Y/Y Jul | 3.70% | 3.70% |
| 06:00 | GBP | RPI M/M Jul | 0.40% | |
| 06:00 | GBP | RPI Y/Y Jul | 4.50% | 4.40% |
| 06:00 | GBP | PPI Input M/M Jul | 0.80% | |
| 06:00 | GBP | PPI Input Y/Y Jul | -0.10% | |
| 06:00 | GBP | PPI Output M/M Jul | 0.50% | |
| 06:00 | GBP | PPI Output Y/Y Jul | 0.30% | |
| 06:00 | GBP | PPI Core Output M/M Jul | 0.30% | |
| 06:00 | GBP | PPI Core Output Y/Y Jul | 1.50% | |
| 09:00 | EUR | Eurozone CPI Y/Y Jul F | 2.00% | 2.00% |
| 09:00 | EUR | Eurozone CPI Core Y/Y Jul F | 2.30% | 2.30% |
| 12:30 | CAD | New Housing Price Index M/M Jul | 0.10% | -0.20% |
| 14:30 | USD | Crude Oil Inventories | 3.0M | |
| 18:00 | USD | FOMC Minutes | ||
| 22:45 | NZD | Trade Balance (NZD) Jul | 142M | |
| 23:00 | AUD | Manufacturing PMI Aug P | 51.3 | |
| 23:00 | AUD | Services PMI Aug P | 54.1 |
| GMT | Ccy | Events | |
|---|---|---|---|
| 01:00 | CNY | 1-Y Loan Prime Rate | |
| Forecast: 3.00% | Previous: 3.00% | ||
| 01:00 | CNY | 5-Y Loan Prime Rate | |
| Forecast: 3.50% | Previous: 3.50% | ||
| 02:00 | NZD | RBNZ Interest Rate Decision | |
| Forecast: 3.00% | Previous: 3.25% | ||
| 06:00 | EUR | Germany PPI M/M Jul | |
| Forecast: 0.20% | Previous: 0.10% | ||
| 06:00 | EUR | Germany PPI Y/Y Jul | |
| Forecast: | Previous: -1.30% | ||
| 06:00 | GBP | CPI M/M Jul | |
| Forecast: | Previous: 0.30% | ||
| 06:00 | GBP | CPI Y/Y Jul | |
| Forecast: 3.70% | Previous: 3.60% | ||
| 06:00 | GBP | Core CPI Y/Y Jul | |
| Forecast: 3.70% | Previous: 3.70% | ||
| 06:00 | GBP | RPI M/M Jul | |
| Forecast: | Previous: 0.40% | ||
| 06:00 | GBP | RPI Y/Y Jul | |
| Forecast: 4.50% | Previous: 4.40% | ||
| 06:00 | GBP | PPI Input M/M Jul | |
| Forecast: | Previous: 0.80% | ||
| 06:00 | GBP | PPI Input Y/Y Jul | |
| Forecast: | Previous: -0.10% | ||
| 06:00 | GBP | PPI Output M/M Jul | |
| Forecast: | Previous: 0.50% | ||
| 06:00 | GBP | PPI Output Y/Y Jul | |
| Forecast: | Previous: 0.30% | ||
| 06:00 | GBP | PPI Core Output M/M Jul | |
| Forecast: | Previous: 0.30% | ||
| 06:00 | GBP | PPI Core Output Y/Y Jul | |
| Forecast: | Previous: 1.50% | ||
| 09:00 | EUR | Eurozone CPI Y/Y Jul F | |
| Forecast: 2.00% | Previous: 2.00% | ||
| 09:00 | EUR | Eurozone CPI Core Y/Y Jul F | |
| Forecast: 2.30% | Previous: 2.30% | ||
| 12:30 | CAD | New Housing Price Index M/M Jul | |
| Forecast: 0.10% | Previous: -0.20% | ||
| 14:30 | USD | Crude Oil Inventories | |
| Forecast: | Previous: 3.0M | ||
| 18:00 | USD | FOMC Minutes | |
| Forecast: | Previous: | ||
| 22:45 | NZD | Trade Balance (NZD) Jul | |
| Forecast: | Previous: 142M | ||
| 23:00 | AUD | Manufacturing PMI Aug P | |
| Forecast: | Previous: 51.3 | ||
| 23:00 | AUD | Services PMI Aug P | |
| Forecast: | Previous: 54.1 | ||
Thursday, Aug 21, 2025
| GMT | Ccy | Events | Consensus | Previous |
|---|---|---|---|---|
| 00:30 | JPY | Manufacturing PMI Aug P | 49.2 | 48.9 |
| 00:30 | JPY | Services PMI Aug P | 53.6 | |
| 01:00 | AUD | Consumer Inflation Expectations Aug | 4.70% | |
| 06:00 | GBP | Public Sector Net Borrowing (GBP) Jul | 1.9B | 20.7B |
| 07:15 | EUR | France Manufacturing PMI Aug P | 48.3 | 48.2 |
| 07:15 | EUR | France Services PMI Aug P | 48.6 | 48.5 |
| 07:30 | EUR | Germany Manufacturing PMI Aug P | 48.9 | 49.1 |
| 07:30 | EUR | Germany Services PMI Aug P | 50.8 | 50.6 |
| 08:00 | EUR | Eurozone Manufacturing PMI Aug P | 49.5 | 49.8 |
| 08:00 | EUR | Eurozone Services PMI Aug P | 50.6 | 51 |
| 08:30 | GBP | Manufacturing PMI Aug P | 48.3 | 48 |
| 08:30 | GBP | Services PMI Aug P | 52 | 51.8 |
| 12:30 | CAD | IPPI M/M Jul | 0.40% | |
| 12:30 | CAD | RMPI Jul | 2.70% | |
| 12:30 | USD | Initial Jobless Claims (Aug 15) | 227K | 224K |
| 12:30 | USD | Philadelphia Fed Manufacturing Aug | 8.1 | 15.9 |
| 13:45 | USD | Manufacturing PMI Aug P | 49.8 | |
| 13:45 | USD | Services PMI Aug P | 55.7 | |
| 14:00 | USD | Existing Home Sales Jul | 3.92M | 3.93M |
| 14:00 | EUR | Eurozone Consumer Confidence Aug P | -15 | -15 |
| 14:30 | USD | Natural Gas Storage | 56B | |
| 23:01 | GBP | GfK Consumer Confidence Aug | -19 | -19 |
| 23:30 | JPY | National CPI Y/Y Jul | 3.30% | |
| 23:30 | JPY | National CPI Core Y/Y Jul | 3.00% | 3.30% |
| 23:30 | JPY | National CPI Core-Core Y/Y Jul | 3.40% |
| GMT | Ccy | Events | |
|---|---|---|---|
| 00:30 | JPY | Manufacturing PMI Aug P | |
| Forecast: 49.2 | Previous: 48.9 | ||
| 00:30 | JPY | Services PMI Aug P | |
| Forecast: | Previous: 53.6 | ||
| 01:00 | AUD | Consumer Inflation Expectations Aug | |
| Forecast: | Previous: 4.70% | ||
| 06:00 | GBP | Public Sector Net Borrowing (GBP) Jul | |
| Forecast: 1.9B | Previous: 20.7B | ||
| 07:15 | EUR | France Manufacturing PMI Aug P | |
| Forecast: 48.3 | Previous: 48.2 | ||
| 07:15 | EUR | France Services PMI Aug P | |
| Forecast: 48.6 | Previous: 48.5 | ||
| 07:30 | EUR | Germany Manufacturing PMI Aug P | |
| Forecast: 48.9 | Previous: 49.1 | ||
| 07:30 | EUR | Germany Services PMI Aug P | |
| Forecast: 50.8 | Previous: 50.6 | ||
| 08:00 | EUR | Eurozone Manufacturing PMI Aug P | |
| Forecast: 49.5 | Previous: 49.8 | ||
| 08:00 | EUR | Eurozone Services PMI Aug P | |
| Forecast: 50.6 | Previous: 51 | ||
| 08:30 | GBP | Manufacturing PMI Aug P | |
| Forecast: 48.3 | Previous: 48 | ||
| 08:30 | GBP | Services PMI Aug P | |
| Forecast: 52 | Previous: 51.8 | ||
| 12:30 | CAD | IPPI M/M Jul | |
| Forecast: | Previous: 0.40% | ||
| 12:30 | CAD | RMPI Jul | |
| Forecast: | Previous: 2.70% | ||
| 12:30 | USD | Initial Jobless Claims (Aug 15) | |
| Forecast: 227K | Previous: 224K | ||
| 12:30 | USD | Philadelphia Fed Manufacturing Aug | |
| Forecast: 8.1 | Previous: 15.9 | ||
| 13:45 | USD | Manufacturing PMI Aug P | |
| Forecast: | Previous: 49.8 | ||
| 13:45 | USD | Services PMI Aug P | |
| Forecast: | Previous: 55.7 | ||
| 14:00 | USD | Existing Home Sales Jul | |
| Forecast: 3.92M | Previous: 3.93M | ||
| 14:00 | EUR | Eurozone Consumer Confidence Aug P | |
| Forecast: -15 | Previous: -15 | ||
| 14:30 | USD | Natural Gas Storage | |
| Forecast: | Previous: 56B | ||
| 23:01 | GBP | GfK Consumer Confidence Aug | |
| Forecast: -19 | Previous: -19 | ||
| 23:30 | JPY | National CPI Y/Y Jul | |
| Forecast: | Previous: 3.30% | ||
| 23:30 | JPY | National CPI Core Y/Y Jul | |
| Forecast: 3.00% | Previous: 3.30% | ||
| 23:30 | JPY | National CPI Core-Core Y/Y Jul | |
| Forecast: | Previous: 3.40% | ||
Friday, Aug 22, 2025
| GMT | Ccy | Events | Consensus | Previous |
|---|---|---|---|---|
| 06:00 | GBP | Retail Sales M/M Jul | 0.60% | 0.90% |
| 06:00 | EUR | Germany GDP Q/Q Q2 F | -0.10% | -0.10% |
| 12:30 | CAD | Retail Sales M/M Jun | 1.60% | -1.10% |
| 12:30 | CAD | Retail Sales ex Autos M/M Jun | 0.90% | -0.20% |
| GMT | Ccy | Events | |
|---|---|---|---|
| 06:00 | GBP | Retail Sales M/M Jul | |
| Forecast: 0.60% | Previous: 0.90% | ||
| 06:00 | EUR | Germany GDP Q/Q Q2 F | |
| Forecast: -0.10% | Previous: -0.10% | ||
| 12:30 | CAD | Retail Sales M/M Jun | |
| Forecast: 1.60% | Previous: -1.10% | ||
| 12:30 | CAD | Retail Sales ex Autos M/M Jun | |
| Forecast: 0.90% | Previous: -0.20% | ||
Markets Weekly Outlook – Jackson Hole, NZ Rate Decisions and UK/EU Inflation Data
After an already volatile trading week, next week will see a crossroad of data and geopolitical catalysts that may move currency, equity and crypto Markets.
Before looking at those, let's have a look at what happened this week.
Week in review: US mixed inflation data sending warning signs, RBA rate cut and Trump-Putin meeting
The US path to a much anticipated rate cut was well-drawn, particularly after Tuesday's CPI report coming along the FED's inflation target (2.5% y/y on the headline, 2.7% on the Core.)
However, Thursday's PPI data changed the narrative quite a lot.
Coming in at 0.9% vs 0.2% expected (and bringing the y/y Core to 3.7%!), Markets caught a bad surprise: Tariff-led inflation is making its way to the US Data.
With a mix of downward revised NFP data and a not-so-clear US inflation outlook, the September rate cut isn't going to be such a given.
There will still be one more NFP report and CPI report before the 17th of September Meeting happens.
In the meantime, risk-assets and sentiment have taken a hit from the tariff fears: Cryptos have taken a tough hit and US Indices are a bit more indecisive, yet still holding close to their recent highs.
Weekly Performance from different Asset classes
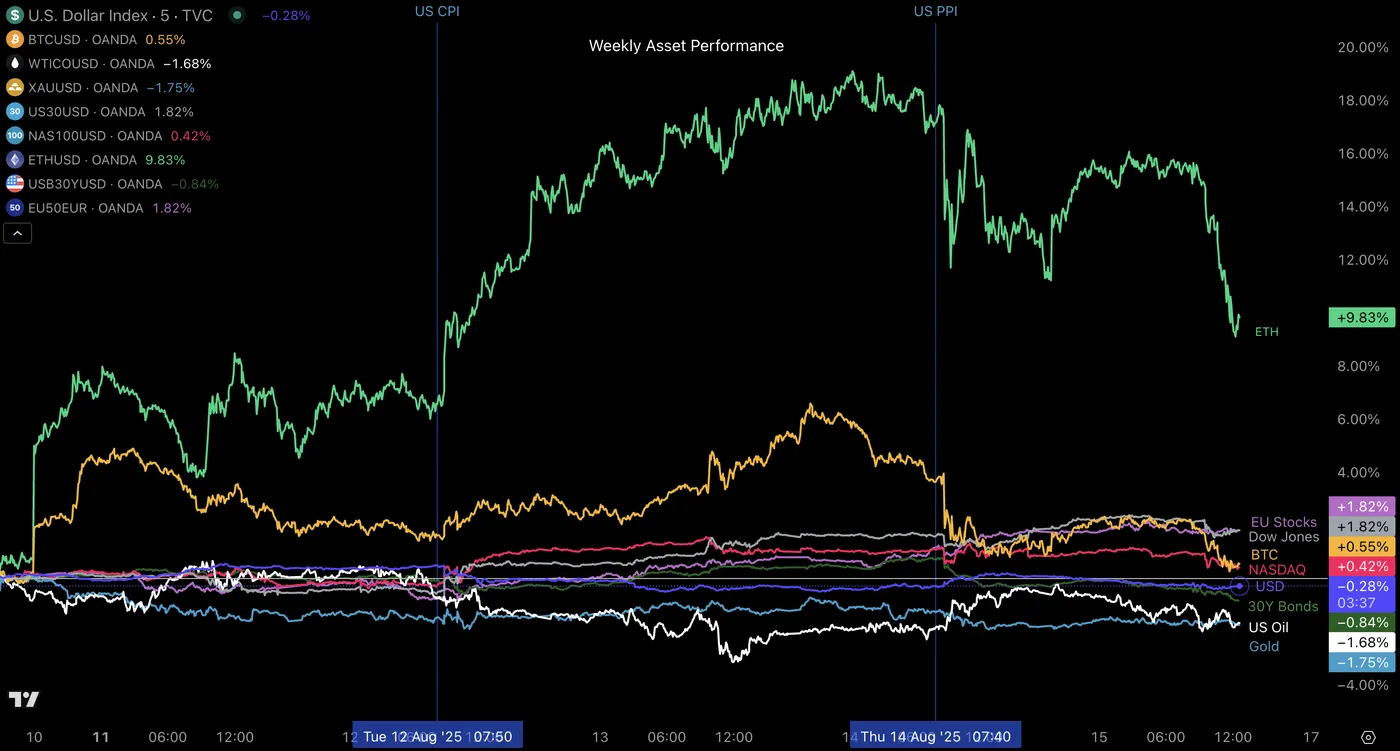
Weekly Asset Performance, look at how the US data changed the flows twice with commodities being the weekly losers – Source: TradingView
The Trump–Putin meeting should also be making headlines very soon, with the two presidents starting discussions in the afternoon.
The Kremlin spokesperson Dmitry Peskov expects a long meeting, saying that "In general, we can imagine that it will take at least 6-7 hours".
Access our WTI Oil analysis as some heightened volatility can be expected there in the afternoon, with volatility in the commodity possibly also spilling on Monday.
Elsewhere, Markets saw the Royal Bank of Australia cutting rates to 3.60% on mixed signals for the future RBA outlook.
The Week Ahead – Jackson Hole Symposium and a lot more
One of the key events concerning all types of Markets is the yearly Jackson Hole Symposium. A roadmap for the event just got published.
For those who don't know, the Jackson Hole Economic Policy Symposium is an annual gathering hosted by the Kansas City Fed, bringing together central bankers, policymakers, academics, and market participants to discuss key economic issues.
While the topics vary each year, it’s closely watched for views from Central Banks on the future outlook with the Tariff concerns and global growth.
One of the most memorable market-shaking moments from the yearly conference came in 2010, when then-Fed Chair Ben Bernanke used his Jackson Hole speech to signal a second round of quantitative easing (QE2).
The hint sent risk assets surging and Treasury yields lower, cementing Jackson Hole’s reputation as a stage for major policy signals.
Asia Pacific Markets - Royal Bank of New Zealand rate decision
Asian-Pacific Markets will not get too much in terms of key data, with the main event happening in New Zealand.
The RBNZ is widely expected to cut their rates to 3% from 3.25% – Keep an eye on our upcoming RBNZ meeting preview coming up on Monday.|
The rate decision is happening on Tuesday at 22:00 ET.
For the rest, mid-tier data releases include Japan and New Zealand's trade balance, the Japanese national CPI data and Australian PMIs.
Markets are also awaiting for the PBoC Rate decision, just before the RBNZ meeting. The Chinese economy has been stagnant for a while now except for the stimulus offered by the Central Bank.
Economists are waiting to see if there is more stimulus to come to boost notably APAC currencies (like AUD and NZD) and commodities' growth outlook.
US, Europe and UK Markets - PMI data, Canadian inflation and Eurozone & UK PPI releases
The week really starts on Tuesday with the Canadian inflation forecasted at 2% – We will see if the Loonie gets enough of a push to strengthen after a rough past week.
The CAD has been getting dragged around by US Dollar flows, with the USDCAD stuck in a consolidation.
Markets will also see if the UK inflation gets a boost which may confirm further the doubts of prolonged rate cuts from the Bank of England – The BoE conference on Thursday 7th of August had almost failed to deliver a cut.
In Europe, both the UK and Germany will release their PPI data on Wednesday where we will see how producer prices moved on the other side of the Atlantic.
They might be movers for European currencies after this week's market shaking US PPI.
The US doesn't have many economic releases per-se, but will still see a few events including the FOMC Minutes on Wednesday (14:00) and many key speeches from a divided Federal Reserve, including Jerome Powell in Jackson Hole scheduled at 10:00 A.M. on Friday.
Of course, don't forget to check all the different PMI releases expected from the Eurozone, the UK and finally the US (Thursday 9:45 for US global services PMI).
For all market-moving economic releases and events, see the MarketPulse Economic Calendar. (High-tier data only)
Safe Trades and enjoy your weekend!
The Weekly Bottom Line: Price Pressure Firms in July, Equity Markets Undeterred
Canadian Highlights
- After last week’s downbeat employment report, market watchers wait for an update on inflation next Tuesday.
- Data out this week suggest the housing market’s freeze is starting to thaw.
- The push (tariffs and trade) and pull (excess supply) on consumer prices is the focus in the coming months, with July’s inflation report hopefully providing a solid glimpse of what might be to come.
U.S. Highlights
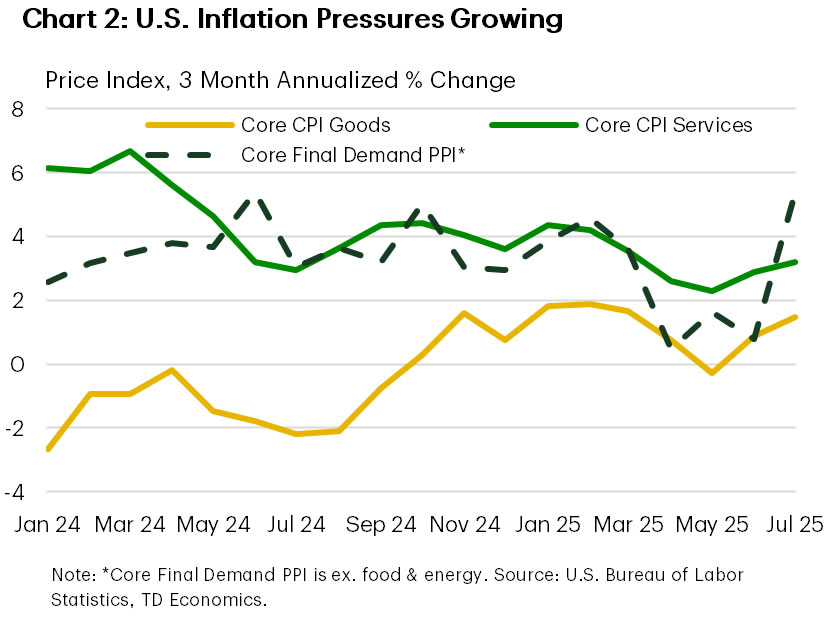
- Inflation pressures rose in July, with core CPI rising above 3% for the first time since February. Meanwhile the uptick in PPI suggests a shift to higher tariff passthrough by companies.
- Retail sales recorded healthy growth in July despite growing price pressures.
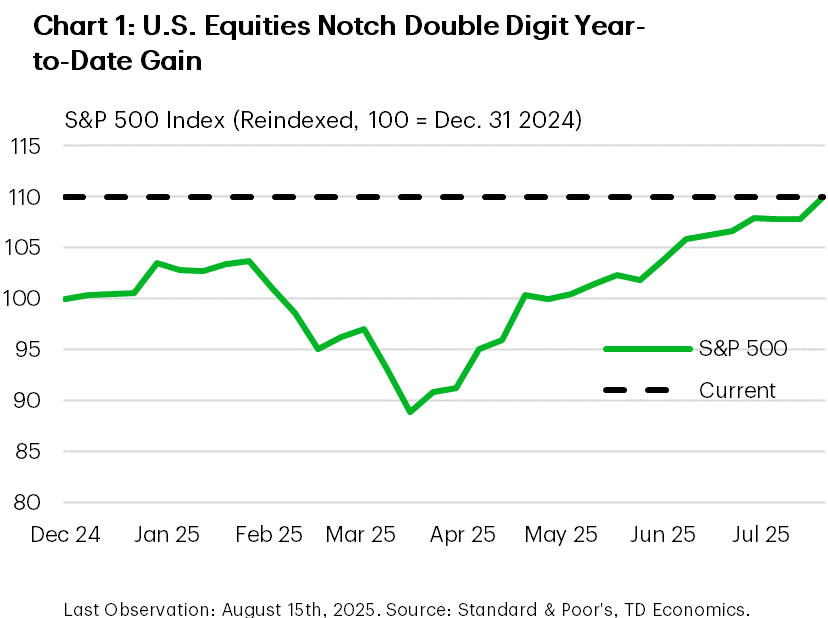
- The S&P 500 hit a double-digit year-to-date return after rising 1% on the week, which would mark the third consecutive annual double digit return if unconceded by year-end.
Canada – The Week Between Labour and Inflation
With an employment report in the rearview and an update on inflation due next Tuesday this was a quiet week for Canadian economic data. In terms of news, China updated tariffs on Canada’s canola, the Bank of Canada’s Summary of Deliberations doubled down on the wait-and-see approach, and we got a bit of good news from the housing market. With consumer and producer price inflation south of the border garnering attention this week, it’s worth taking stock of where things stand and what’re we’re looking for from the CPI report next week.
First things first, an update from the housing market. After some glimmers of hope in late 2024, the market was broadsided by tariff threats and the resulting economic uncertainty earlier this winter. Data out this week suggest this year’s freeze might just be starting to thaw. Sales rose again in July, with strength in Ontario showing that pent-up demand might be starting to soak up some of the ample supply on the market. That said, a signal that the housing market might be finding bottom is not the same as one that it is rising again. A gradual recovery remains our base case, with the associated impacts on housing costs, and inflation.
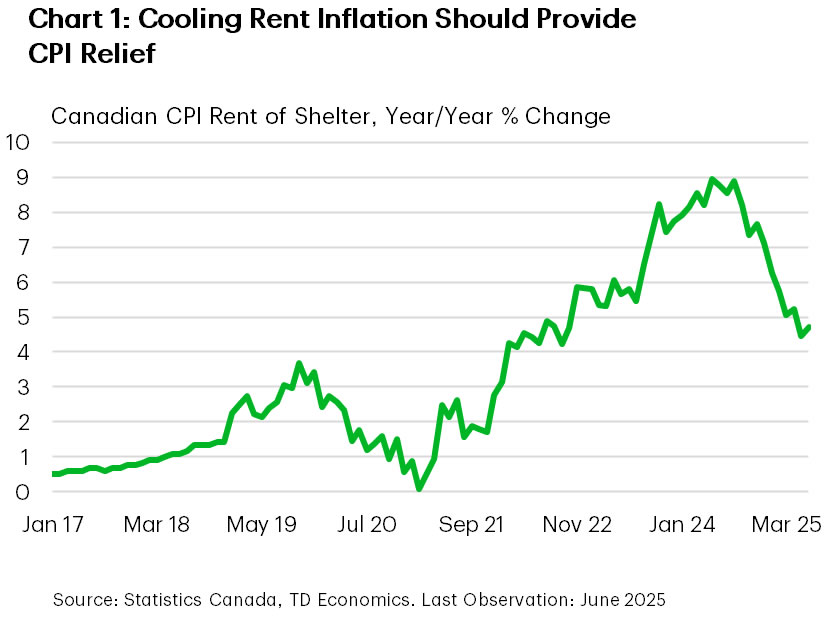
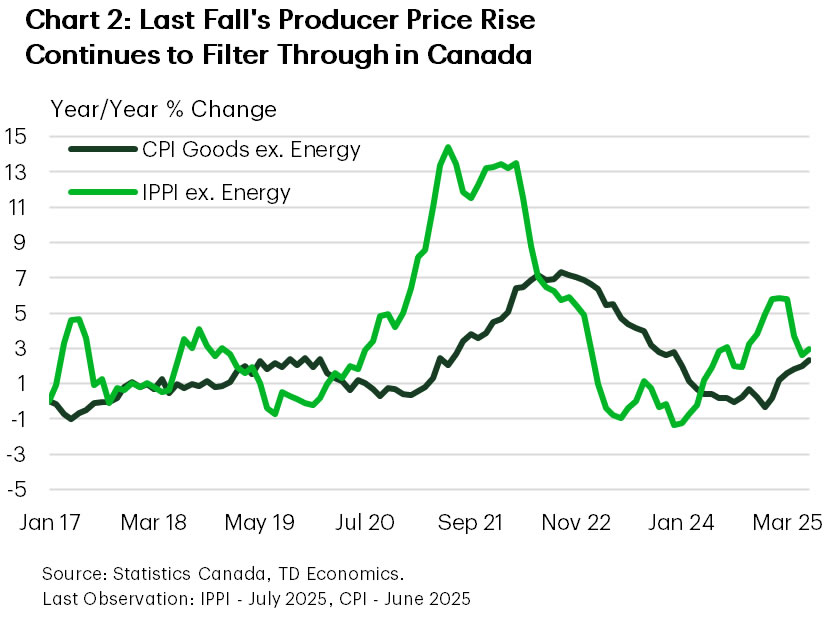
In particular, one key component we’re looking to is rent inflation. CMHC’s mid-year rental report cited the ongoing churn of tenants vacating rent controlled units that are then relisted at current market rates, contributing to propping up the month-on-month gains in average rents. This helps explain, in part, the still elevated readings in the CPI shelter component (Chart 1). That said, with supply on the market rising, falling asking rents should continue to exert influence on the metric, and as less of the rental stock is left to reset, help it continue moderating in the coming months. Beyond rents, we will also be looking for signs that inflation in cyclically sensitive services (excluding shelter) slowed in July.
These factors ultimately lead to the most important question, “What are we going to see from tariffed goods?” The Canadian government has imposed tariffs on a wide swath of imports from the U.S., and a run-up in producer prices last fall (Chart 2) suggests some degree of margin compression that firms could be looking to recoup. So, we’re going to be looking for evidence that higher prices are being passed on by firms, rather than absorbed.
There are, of course, complicating factors. The BoC’s monetary policy report noted past depreciation of the Canadian dollar as another factor in the current price gains, but given the recent rally vis-à-vis the U.S. dollar, and our outlook, a firmer currency should act as somewhat of a salve against faster inflation. Further complicating things is the chance that firms could opt to raise prices as their tariff-exposed competitors are forced to pass on higher costs. The push (tariffs and trade) and pull (excess supply) on consumer prices is the focus in the coming months for the BoC. For those of us watching, July’s inflation read will hopefully provide a solid glimpse of what might be to come.
U.S. – Price Pressure Firms in July, Equity Markets Undeterred
It has been one week since the full complement of reciprocal tariff policies went into effect. Those tariffs will not have an influence on the economic data for a few months, but the tariffs that prevailed through the first half of the year continued to show up in the July inflation readings released this week. This included the CPI and PPI, both of which showed signs of rising price pressures that are expected to trend higher over the coming months with the new tranche of tariffs now in effect. Largely undeterred, equity markets continued to probe record highs, with the S&P 500 rising 1.0% on the week and notching a double digit return year-to-date (Chart 1).
The first inflation report we received on Tuesday showed consumer price growth accelerating in July, with the annual percentage change in core CPI rising above 3% for the first time since February. This was driven by stronger core goods prices, largely related to higher tariff passthrough, while core services inflation also trended higher (Chart 2). Producer prices, which we received on Thursday and measure the prices charged by U.S. businesses, also began to trend notably higher in July with the monthly change hitting a 3-year high. This likely suggests that businesses are shifting to pass on more of the higher costs associated with tariffs to consumers after largely absorbing the costs in the first half of the year. Moving forward, with the effective U.S. tariff rate nearly 10 percentage-points higher after last week’s reciprocal tariffs came into force, inflationary pressures are expected to remain elevated through the second half of the year.
The Federal Reserve has been acutely attuned to these developments, with the central bank remaining on hold since the start of the year. Although a few Federal Reserve officials have advocated for rate reductions, the balance of the FOMC continues to voice caution regarding the uncertainty surrounding the outlook for inflation and the economy. The officials we heard from this week, including regional Fed presidents Schmid (Kansas City) and Goolsbee (Chicago) who are voting members of the FOMC this year, noted that caution was still warranted. Market pricing fluctuated this week, but currently has 90% odds for a rate cut in September. The annual Jackson Hole Symposium next week will be watched closely after this week’s inflation reports for any signs on the leanings of officials in the run-up to the next Federal Reserve decision in one month.
On a more positive note, retail spending appeared to remain healthy in July, growing 0.5% month-on-month. However, July also had Amazon’s multi-day Prime day event which tends to boost sales activity. A non-outsized reading could suggest that consumption is beginning to slow in line with the downward revisions to the labor market recorded in the second quarter. This is part of the reason why Federal Reserve officials have continued to advocate for caution, noting that it will take time to properly assess the state of the U.S. economy amid the fog of various shifts in trade policy.
Next week, we’ll receive the FOMC meeting minutes for July as well as the July reading for PCE inflation which should help formulate expectations for September’s Fed meeting. With trade policy uncertainty waning gradually, the attention of markets will shift back towards the Fed.
Weekly Economic & Financial Commentary: Signs of Higher Tariffs Filtering through to Selling Prices
Summary
United States: Can I Get a Price Check?
- The latest inflation data brought some signs of tariff-induced cost pressure, and July retail sales tell us consumers are still spending. But it remains to be seen to what extent firms pass costs on and how much price growth consumers can stomach today.
- Next week: Housing Starts (Tue.), Existing Home Sales (Thu.)
International: Policy Prognostications and Growth Surprises
- This week brought a range of economic developments and data releases across both G10 and emerging markets. In monetary policy announcements, the Reserve Bank of Australia delivered a rate cut while Norges Bank held rates steady. In both the UK and Japan, Q2 GDP surprised to the upside. In contrast, China’s July activity data disappointed, with retail sales and industrial production below expectations.
- Next week: Reserve Bank of New Zealand Policy Rate (Wed.), Riksbank Policy Rate (Wed.), Eurozone PMIs (Thu.)
Credit Market Insights: Young Borrowers: Another Crack in the Economy
- Even as overall borrowing expanded by 1% over the second quarter, cracks are beginning to emerge that reveal increasing vulnerabilities among certain households. Sharp rises in auto loan and credit card delinquencies over the past few years signal stress for young borrowers, a group which has reduced borrowing by 15% since 2023.
Topic of the Week: Signs of Higher Tariffs Filtering through to Selling Prices
- The Producer Price Index (PPI) for final demand rose 0.9% in July, handily beating expectations for a 0.2% increase. Elevated producer prices and wholesale and retail margins indicate firms may be less willing to absorb tariff costs.
Preview of RBNZ: One Final Cut?
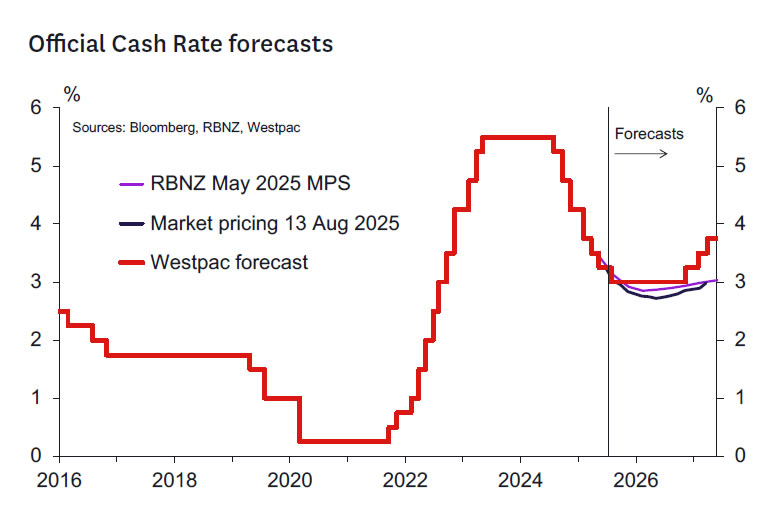
- We expect the RBNZ to cut the OCR by 25bp to 3%.
- We don’t expect a significant change in the RBNZ’s OCR profile, which is still likely to indicate a chance of a further cut in November.
- Beyond this meeting a data-dependent easing bias seems likely. A higher bar seems likely for an easing in October.
- We don’t expect a split vote, but we do expect to see evidence of debate among MPC members around the weight placed on high near-term inflation and rising expectations versus lower medium-term forecasts.
RBNZ decision and communication.
In its July review the RBNZ clearly indicated an easing to 3% was on the cards at the next meeting, assuming the dataflow between May and August went as expected. There’s nothing in the recent dataflow that should deter them from this course of action – even though there may be more debate on the outlook from August. The MPC member who voted for a pause in May had a different view on the timing of cuts and not the quantum in general. Hence, we anticipate a consensus decision this time around.
The focus will be on the forward outlook. In May, the view was a chance of easing in November – but not a full chance. Something like a 50:50 probability seemed to be in the tea leaves back then. There didn’t seem like a high chance of an October cut barring significantly adverse surprises. The view was that the OCR was on a glide path within the “neutral-ish” zone. There wasn’t much consideration of a move into stimulatory territory – even in the adverse scenario canvassed in the forecasts.
We don’t think that view will have changed much. Some domestic data has surpassed expectations (GDP, firmer CPI indicators) while other indicators may have disappointed (consumer spending, housing market indicators, PMI indices). In aggregate these don’t seem to have amounted to much. Hence if the forward track changes we expect it will be at the absolute margin – and such changes carry no policy information at all.
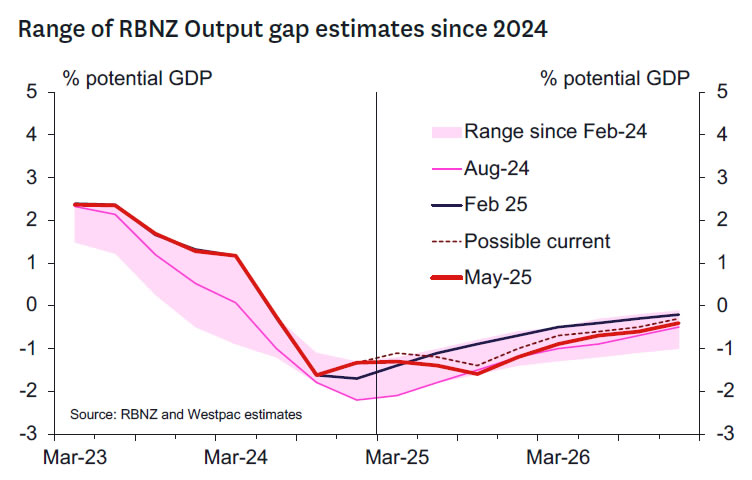
It’s useful to keep in mind that the RBNZ included a lot of weakness in their near-term output profile in their May forecasts. The weaker indicators seem to suggest that these adjustments were appropriate. We might see some adjustments at the margin to the timing of GDP growth. The RBNZ’s GDP Nowcast for the June quarter is lower than their previous forecast for 0.4% growth. So that might be revised down closer to our 0% q/q forecast for that quarter – incorporating the full impact of the residual seasonality that weighs down June quarters and boosts December quarters. The RBNZ’s forecast for the September quarter could be revised up from the 0.2% currently forecast. Hence, we might just see some subtle shifting in the profile as opposed to an aggregate marking down of 2024 growth (which at 1.8% y/y is low considering the 0.4% upside surprise the RBNZ got for March quarter GDP). We suspect the RBNZ’s output gap and short-term profile will be no weaker than presented in May and should be a touch less negative, implying less disinflation pressure in the medium term at the very margin.
The commentary on the labour market will be interesting but likely inconsequential. The RBNZ’s tendency is to start with their activity forecasts and develop an output gap estimate. The unemployment rate follows from that using an Okun’s law type relationship. Notwithstanding the substantial heat in the discourse around the Q2 labour market reports a week or so ago, it won’t change much for the RBNZ. We expect them to tweak the peak unemployment rate to reflect a higher peak than the optimistic 5.2% peak published in May. And we think they might push out the time over which the unemployment rate remains at the peak, so it lines up better with the output gap, assuming the expected lag between a pickup in quarterly growth and falling unemployment. None of this should impact the policy decision or OCR path at all. It’s all fine-tuning.
The commentary on the global outlook and tariffs will likely remain cautious and negative. The forecasts will reflect the increase in Consensus Forecasts since May. But we suspect the MPC will retain concerns that US trade policy has some twists and turns to go before the woods are formally cleared. We don’t expect the RBNZ to increase the indirect impacts of the external situation. Export prices have remained firm, and the global outlook isn’t weaker. NZ did end up with a larger tariff than was known in May. But the direct impacts of this were always likely to be negligible in aggregate. And hopefully the RBNZ’s business visits will have confirmed the view we have received from customers than it’s been generally OK to pass these direct costs through to US importers. And certainly, in aggregate the US import price data shows this seems to have been the case. Hence, we don’t expect much impact on the forecasts in the end.
The RBNZ expended a reasonable amount of capital in May shaping market expectations towards expecting OCR cuts at Monetary Policy Statements instead of at every meeting. In July, RBNZ Chief Economist Conway suggested that not much had changed for them since May. Hence, we think the strategy will remain the same. This will be to point markets to the data between now and November to support that last OCR cut. We don’t expect the RBNZ to reignite expectations of off-Monetary Policy Statement OCR changes unless something very untoward happens. And we haven’t seen that yet. That implies that the December 2025 OCR number of 2.92% looks about right. That’s about a 50:50 chance of a further cut in November. We don’t think the chances of a further cut are that high.
Could we get commentary raising the risks of a need to move the OCR into clearly stimulatory territory? We don’t think so, as to do so would invite markets to price such moves in quite soon and box the RBNZ in. Such a change in strategy would need to be supported by more substantive changes in the forecasts and risks. The global outlook might be such a pretext. But more likely would be an assessment that we need to see a decidedly stimulatory OCR relative to where the RBNZ thinks neutral is (currently RBNZ estimates range between 2.9-3.6%). Typical OCR cycles in non-crisis times often see the OCR bottom perhaps 50-125bp below neutral. Getting to that point might require knocking a substantial amount off the 2025 and 2026 growth forecast, presumably on the view that interest rate-sensitive segments of the economy won’t respond until an OCR in the 2-2.5% range is delivered. There’s been little evidence in support of that view emerging since May. There’s certainly plenty of exasperation as to how long it’s taking for the economy and labour market to pick up, hence the theme of our recent Economic Overview: “Are we there yet?” But central bankers know the lags are long and variable, so we doubt they will be too fazed yet. Especially with inflation knocking at the door of 3% for the next 5 months.
On inflation, we think they will boost their short-term forecasts such that annual inflation is forecast to be close to 3% for the remainder of this year (in the May MPS inflation was projected to be 2.7% and 2.4% respectively for the September and December quarters). That December quarter forecast looks particularly low and is a likely candidate for an upward revision, as it otherwise implies a sudden drop in quarterly inflation quite soon. We don’t think the medium-term forecasts will change much. Hence the mantra will be repeated where the MPC will retain confidence that inflation will head back towards 2% in the medium term.
Some alternative scenarios for the outcome of this meeting include:
- Hawkish scenario (10% probability) – a 25bp cut with a clear intent to pause. The RBNZ would note an intent to review things again in November but indicate a high hurdle for further cuts. This could happen if the RBNZ is losing confidence in where the CPI will peak, and how fast it will realistically fall in 2026. Rising inflation expectations would fuel that fire.
- Dovish scenario (10% probability)- a 25bp cut with a presumption of a further cut to 2.75% by November. The possibilities of a move lower still in the OCR towards 2-2.5% might also be discussed as a risk scenario. The RBNZ would be putting more weight on the downside growth and inflation scenario, with less regard for the short-term inflation picture.
Key developments since the May Monetary Policy Statement.
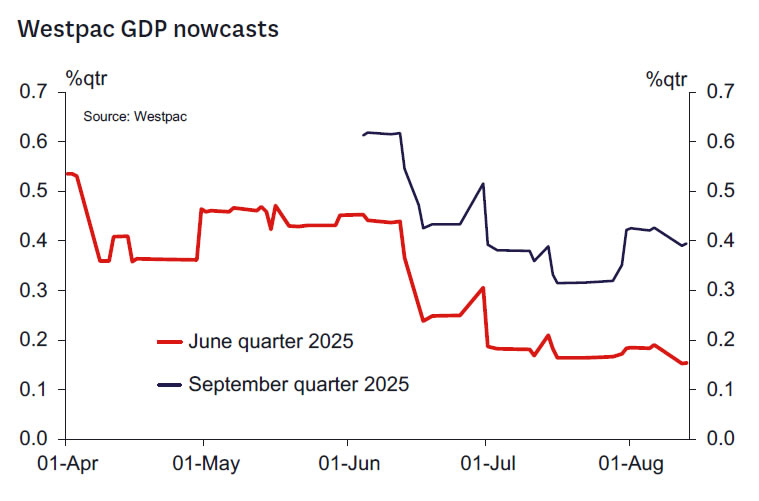
Activity: High-frequency economic data has generally been softer compared to the March quarter, though it’s more of a mixed tone rather than the broad-based downturn that we saw in mid-2024. The manufacturing PMI has dropped below the 50 mark again, and the comparable services index has remained soft. Retail card spending has lost some ground since the start of the year, although it recorded modest gains in the last two months. Westpac’s GDP Nowcast suggests an underlying growth pace of 0.1-0.2% for the June quarter. The actual GDP print is likely to come out lower than this, due to a seasonal distortion that has affected the figures recently, but the RBNZ had already made an allowance for this effect in its May forecasts.
Sentiment indicators: Forward-looking business confidence measures have generally held up at high levels, although the measures of current performance remain soft. The monthly ANZBO survey has picked up again after the initial shock of the ‘Liberation Day’ tariff announcement in April.
Global developments: Trump’s tariff announcements have been coming thick and fast in recent months, but as it currently stands, the weighted average US tariff rate is basically where it was at the time of the May MPS. There seems to be a growing acceptance of tariffs as the ‘new normal’, and Consensus forecasts of GDP growth for our main trading partners have been revised slightly higher again after the initial fall.
Inflation: June quarter inflation was close to the RBNZ’s forecast: annual inflation rose to 2.7% compared to their May forecast of 2.6%. The small upside surprise was likely due to the large increase in food prices. Swings in the prices of volatile items like food aren’t the focus for monetary policy. However, higher food prices and continued increases in administered costs (like rates) mean that inflation is likely to rise to around 3% before the end of this year – higher than the RBNZ had previously forecast. The RBNZ had noted this risk in their July policy review. Under the surface, core inflation remains within the target range and prices for more interest ratesensitive items have moderated.
Inflation expectations: We have seen a lift in some measures of expected inflation in surveys of households from both the RBNZ and ANZ. However, businesses’ expectations for inflation have remained well contained, as seen in both the RBNZ’s Survey of Expectations and in the ANZBO. Surveys of businesses’ plans for pricing from the ANZ and NZIER have been mixed.
Labour market: The unemployment rate rose to 5.2% in the June quarter, in line with the RBNZ’s forecast, although the 0.1% fall in employment was weaker than expected. The monthly filled jobs and vacancies data show that the current momentum remains weak, suggesting that the RBNZ will need to revise up its May forecast that the unemployment rate will peak at its current level.
Housing market: House sales and loan applications are running well ahead of year-ago levels. However, amidst a plentiful supply of dwellings, house prices have effectively been flat (and on the low side of the RBNZ’s forecast).
Commodity prices: Export commodity prices have generally held up over the last few months, with dairy prices coming off their recent highs while meat prices have made further gains. World oil prices have risen about 6% since May, against the RBNZ’s assumption of a slight fall.
Exchange rate: The current trade-weighted index (TWI) is only marginally below the 69.0 that the RBNZ assumed in its May Statement.
Kelly’s take.
There’s a decent case to remain on hold at this meeting and see how the economy progresses over the rest of the year. The building blocks of recovery are in place in the form of 225bp of interest rate cuts and very strong export returns that are not being meaningfully dented by the trade war.
A large part of the case for easier conditions in April and May was predicated on the global situation seriously spilling over to New Zealand. There might have been some of that in business and consumer sentiment in recent months. But mostly this hasn’t happened. Uncertainty will pass while the impact of commodity prices and interest rates will be more enduring. Market expectations of further OCR cuts increased the most recently when rate cut expectations in the US increased. This doesn’t seem like a good reason to ease more in New Zealand.
Given that view, what’s the case for cutting rates further when inflation is nearly 3% and forecasts suggest it might get to 2% but more likely somewhere between 2-2.5%? The policy lags are long and variable – that’s what we are seeing now. Raising expectations for 2-2.75% interest rates seems risky given where inflation is now. There’s plenty of scope to ease more down the road should low inflation rates become a more tangible reality. And it is an inflation mandate in the end.
Inflation Expected to Hold Steady in Canada Amid Resilient Consumer Spending
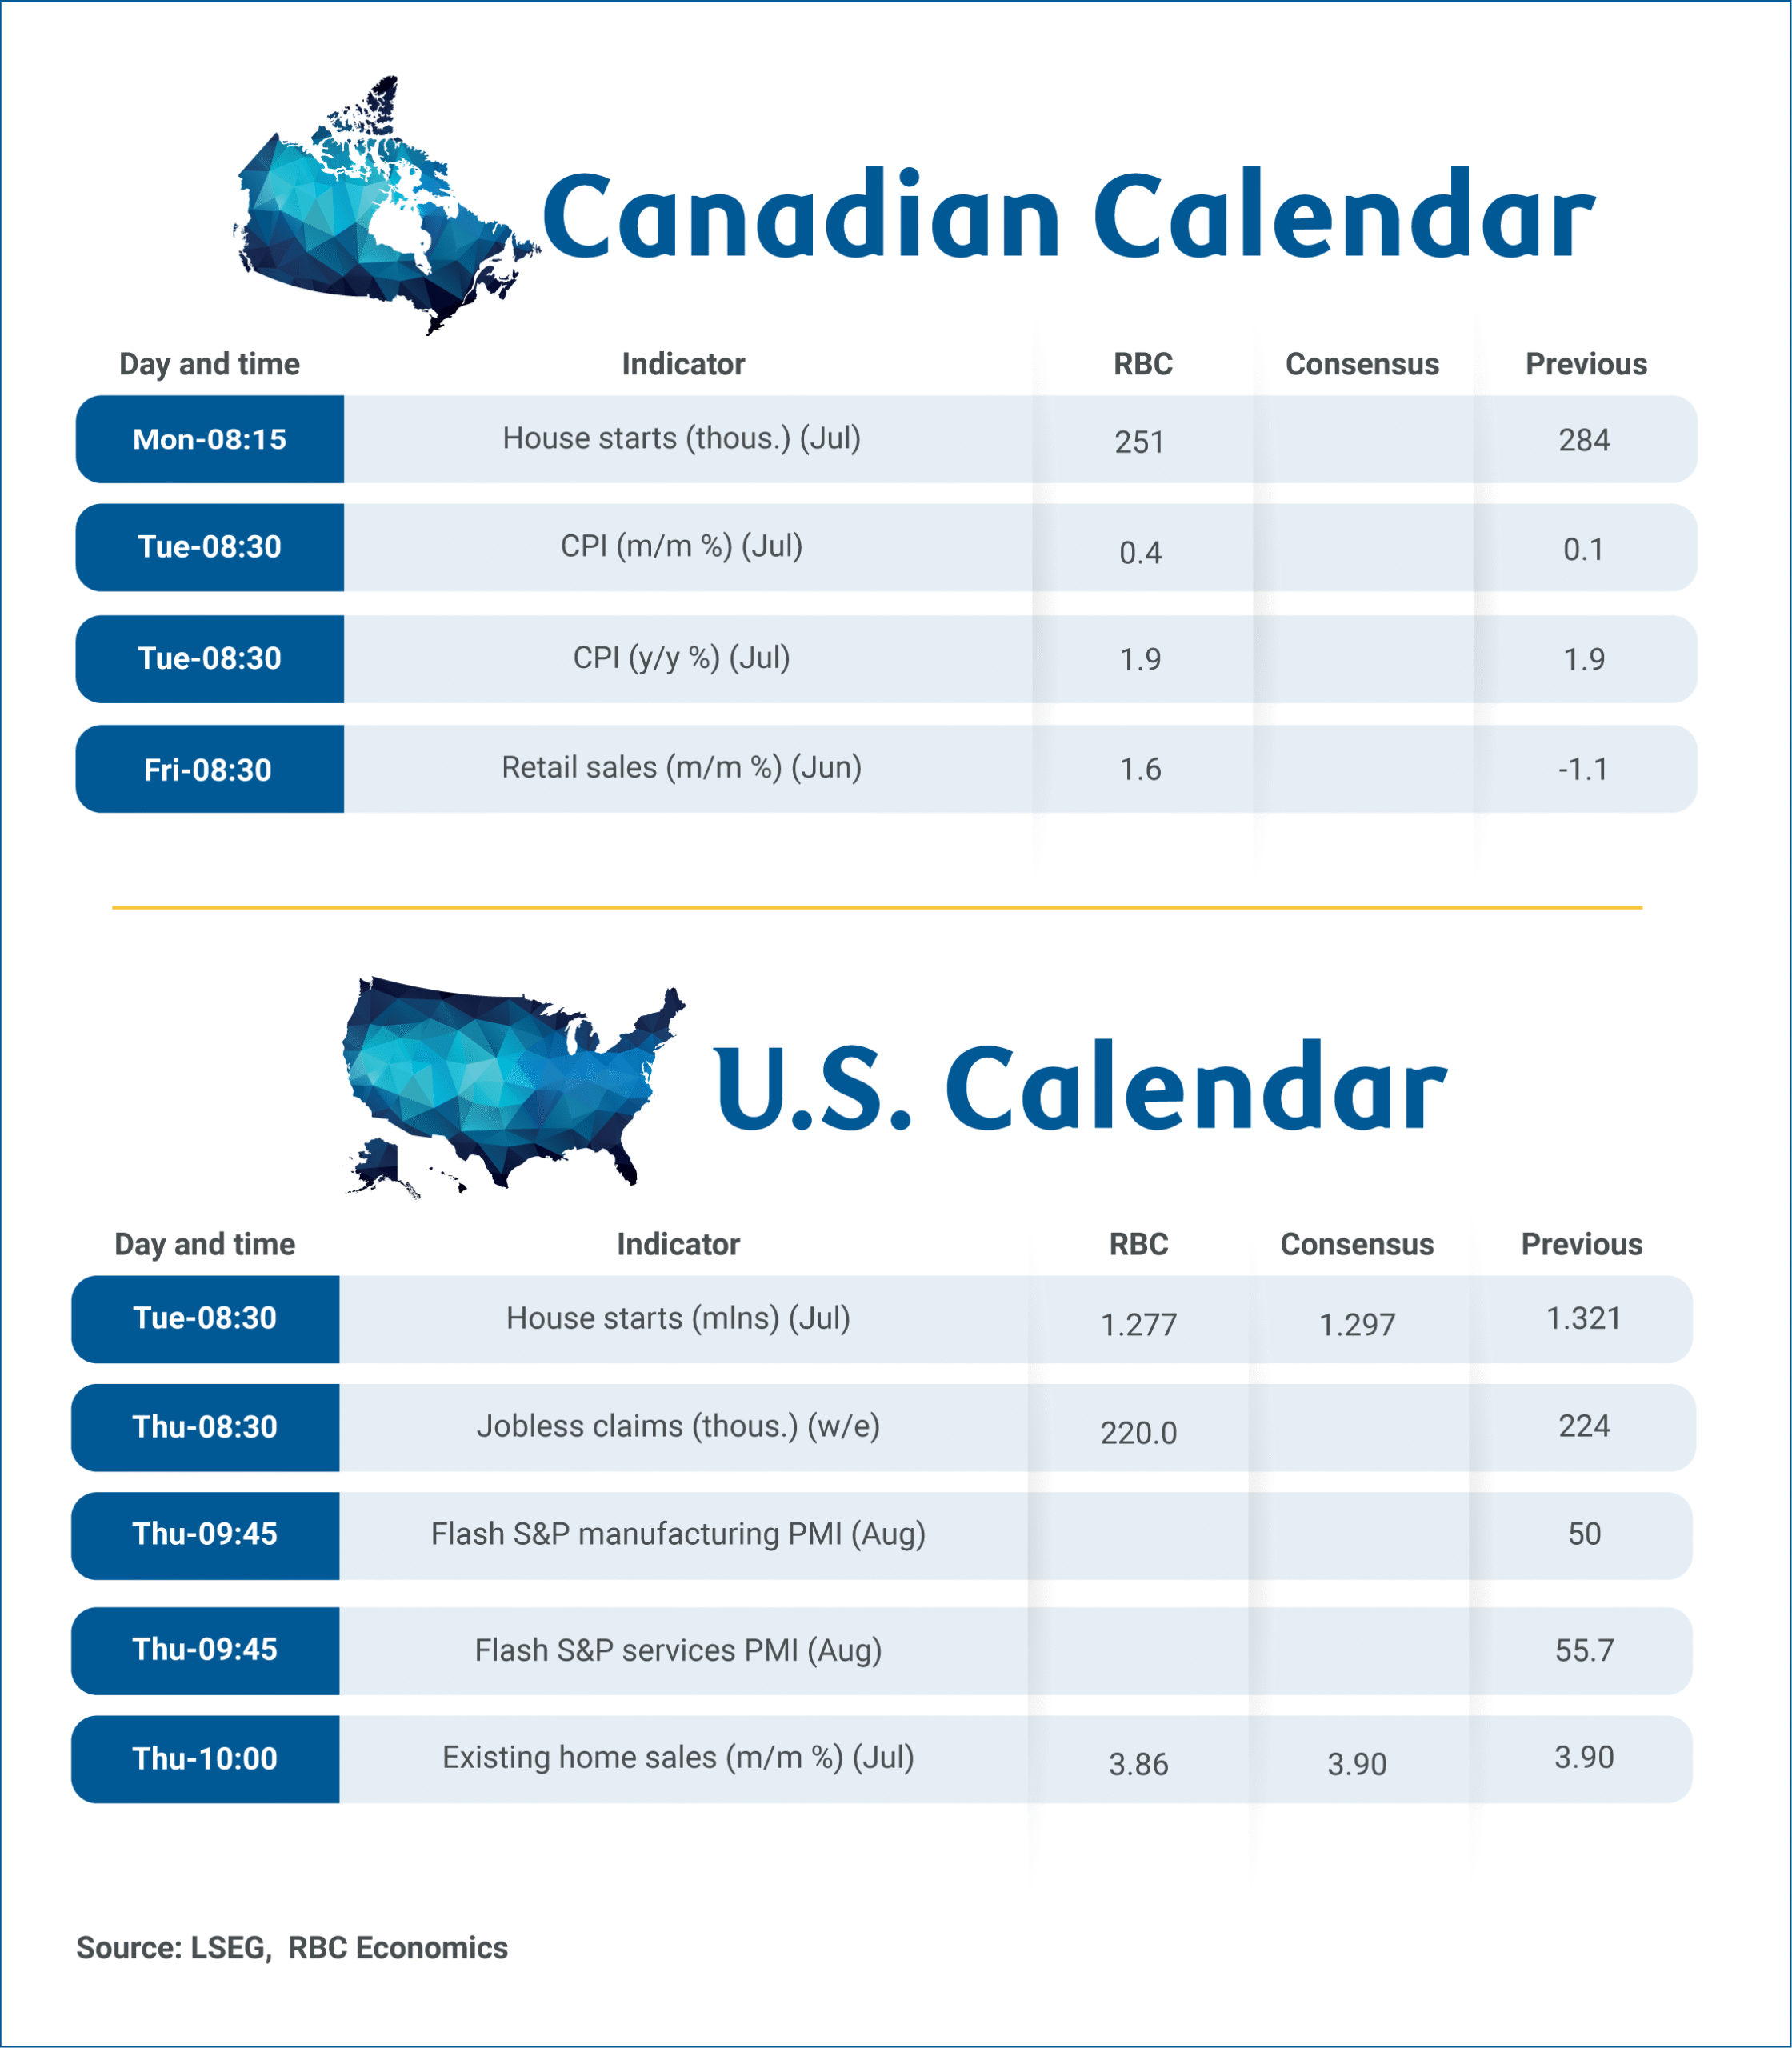
Canadian year-over-year consumer price index growth is expected to hold at 1.9% in July, matching June’s reading on Tuesday.
But, the details will be closely monitored by policymakers as the removal of the consumer carbon tax from most provinces in April continues to artificially lower headline inflation. Underlying trends have surprised upward this year, partly due to tariff impacts on products like food and vehicles, but also from higher prices for domestic services.
We expect these trends continued in July. Gasoline prices decreased 0.7% from June and 15% from July 2024. Food prices, affected by Canada’s retaliatory tariffs, likely remain about 3% above last year. Prices excluding food and energy are expected to have increased slightly to 2.7% year-over-year, up from June’s 2.6%.
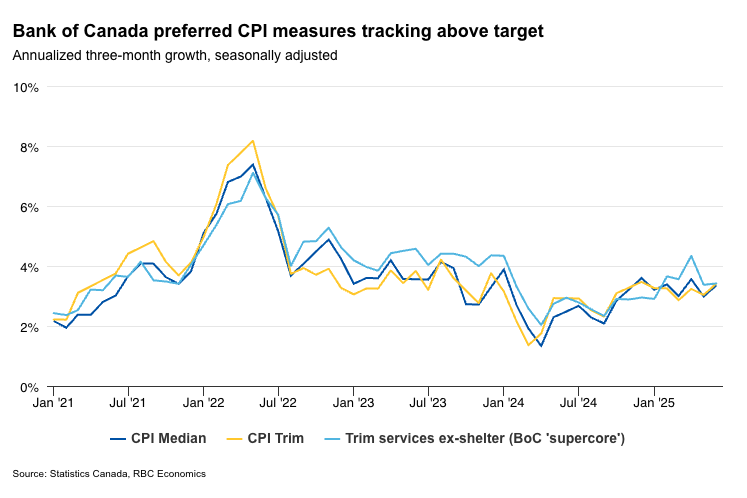
The Bank of Canada will focus on its preferred core measures that account for indirect tax changes. We expect CPI-trim and CPI-median measures to hold at approximately 3% year-over-year—still at the top end of the BoC’s 1% to 3% target range for inflation. But, the three-month rolling average growth should improve as a large increase in April falls out of that shorter time horizon calculation.
Overall, firm underlying inflation is likely connected to resilient Canadian consumer spending. Friday’s retail sales report is expected to confirm Statistics Canada’s advance estimate of a 1.6% increase in June after May’s 1.1% drop. Our RBC card transaction tracking indicates continued strength in July. Annual growth in CPI trim services excluding shelter was also running just above the target range in June.
We continue to expect the BoC will maintain current interest rates given limited further deterioration is expected in the labour market, additional fiscal stimulus will offset tariff impacts, and inflation is running at the upper limit of the central bank’s target range.
Week ahead data watch:
The advance estimate of a 1.6% increase in Canadian retail sales in June likely partially reflected a 2.2% rebound in auto prices. Sales at gas stations should be little changed with prices at the pumps not moving much from May. But, the advance estimate also implies an almost 2% jump in core sales (excluding gasoline and autos) in our estimates.
Weekly Focus – Mixed US inflation data
US inflation was the only tier-1 data point on the global front this week. While it was close to expectations it provided some relief in markets that there are still no strong signs of rising inflation from tariffs. Core CPI increased 0.3% m/m in line with expectations giving a small lift to the annual rate from 2.9% y/y to 3.1% y/y, see Global Inflation Watch - Still no clear signs of tariff-driven inflation, 12 August. Interestingly, it looks like the modest acceleration in core inflation was driven mostly by services (both shelter and non-shelter). A big upward surprise in PPI inflation on Thursday led to some reversal of the relief as it could suggest the tariff impact is simply just delayed.
Yields ended up broadly flat over the week while risk sentiment had another good week. A 25bp cut by the Fed is now fully priced in September and the market looks for another four 25bp cuts by the end of next year. It is partly fuelled by expectations that US President Donald Trump will select a dovish Fed governor in 2026 when Jerome Powell's term expires in May. Markets are now in line with our own Fed forecast and we see limited scope for further declines in bond yields. The list of candidates to replace Fed governor Powell widened this week with several private sector candidates now in the field. Treasury Secretary Scott Bessent said on Wednesday around ten candidates are considered.
Trump this week nominated a new head of Bureau of Labour Statistics replacing Erika McEntarfer who was fired after the recent labour market report showed weaker payrolls. Trump's candidate is E.J. Antoni, a conservative economist who has been highly critical of the payrolls data. Trump posted that "E.J. will ensure that the Numbers released are HONEST and ACCURATE."
In Europe it was quiet on the data front. The German ZEW expectations index dropped from 52.7 to 34.7 but this follows a period of steady increases, and the level is still solid. The Euro Economic Surprise Index is clearly in positive territory. Market expectations for the ECB rate this year did not change much with the market still seeing around a 50-50 chance of a further rate cut of 25bp from the current level of 2.0%. Long-term yields moved lower, though, driven by spill-over from the US. We expect the ECB is done easing and will be on hold for a long time now.
In China, credit data softened a bit but are overall still robust. The credit expansion is driven by government issuance, though, whereas private lending is weak. It underpins the picture that growth is held up by stimulus measures and still decent exports. Chinese leaders still struggle to lift private demand, and housing and consumption remains the weak links.
US and China extended a trade truce by another 90 days as widely expected and tensions between the two countries have eased somewhat. This contrasts with Trump's growing frictions with India and Brazil leaving him in confrontation with most of the BRICS countries. A meeting between Trump and Putin in Alaska on Friday has been widely anticipated but takes place after deadline of this publication.
Next week focus turns to Flash PMI data for August in US and euro zone as well as FOMC minutes, euro negotiated wages and Japan CPI.
US UoM consumer sentiment falls to 58.6 as inflation expectations reignite
US consumer confidence weakened in August, with University of Michigan Consumer Sentiment Index falling from 61.7 to 58.6, missing expectations of 62.1 and marking the first decline in four months. The drop was driven by a sharp fall in Current Economic Conditions Index to 60.9 from 68.0. Expectations Index edged down only slightly to 57.2 from 57.7.
While consumers are no longer bracing for the worst-case economic scenario feared in April at the height of tariff tensions, optimism remains fragile. Many still expect inflation and unemployment to worsen over the coming year, dampening any boost from earlier resilience in household sentiment.
Inflation expectations were particularly notable, with year-ahead projections rising from 4.5% to 4.9% and long-run expectations climbing from 3.4% to 3.9%. The rebound ends a multi-month easing trend and will likely catch the Fed’s attention, especially as it weighs the risk of entrenched price pressures against slowing growth.
US: Retail Sales Continued to Rise in July
Building on their gain in June, retail and food services sales continued to grow in July, advancing by 0.5% month-on-month (m/m). This was close to the market expectations for a 0.6% m/m increase, but slower than the upwardly revised 0.9% gain in June (previously reported as 0.6%).
A rebound in auto sales last month led to a healthy gain in the autos & parts category – up 1.2% on the month. Sales at gasoline stations were also higher, rising +0.7%. On the other hand, sales at the building materials and garden equipment & supplies stores declined by 1.0%.
Sales in the "control group", which excludes the three volatile components mentioned above (i.e., autos, gasoline and building supplies) as well as restaurants rose by 0.5% on the month and are up 4.8% from the year ago. Sales were higher across most other categories, with gains ranging from 0.8% for sporting goods, hobby and bookstores to 0.4% for health & personal care stores. Miscellaneous and electronics retailers were the only two categories where sales were lower.
Sales at bars and restaurants – the only service category in the report – declined by 0.4% partially reversing June's 0.6% gain.
Key Implications
This was a decent report: July's gain in the control group was slightly better than expected, while June's headline gain was also revised higher. Decent retail sales over the last couple of months suggest that consumer spending growth is likely to come in around 1% (annualized) in the third quarter. This is still modest growth, particularly when compared with the 3.5% pace seen in the second half of last year, but slightly better than our initial tracking of just 0.5%.
Retail sales are reported in nominal values, with price changes mudding the water. The latest inflation report has shown that core inflation is gathering momentum. Core goods prices continued to rise, with two-thirds of goods categories now seeing price gains over the last three months. Up until recently, businesses have tried to absorb higher costs and shield consumers, but the last few months have shown that some of the costs are now being passed on. We expect greater pass through of tariff-related price increases over the coming months. With the labor market downshifting and cost pressures heating up, consumer spending is likely to remain tepid through year-end.
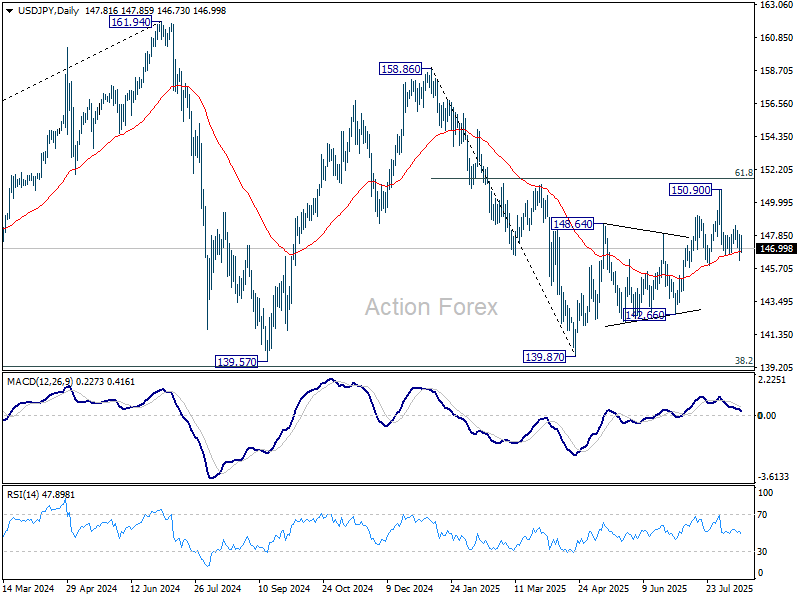
USD/JPY Mid-Day Outlook
Daily Pivots: (S1) 146.66; (P) 147.31; (R1) 148.40; More...
Intraday bias in USD/JPY stays neutral at this point and outlook is unchanged. Further decline is mildly in favor as long as 148.51 resistance holds. On the downside, firm break of 146.85 support will suggest that whole rebound from 139.87 has completed at 150.90, and turn outlook bearish. Next target is 142.66 support. On the upside, above 148.51 will bring retest of 150.90 instead.
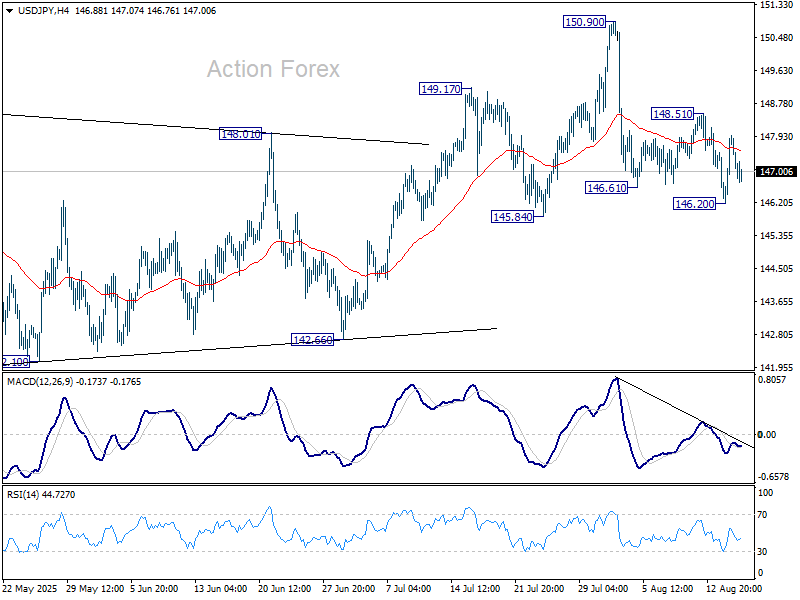
In the bigger picture, price actions from 161.94 (2024 high) are seen as a corrective pattern to rise from 102.58 (2021 low). Decisive break of 61.8% retracement of 158.86 to 139.87 at 151.22 will argue that it has already completed with three waves at 139.87. Larger up trend might then be ready to resume through 161.94 high. In case the corrective pattern extends with another fall, strong support is expected from 38.2% retracement of 102.58 to 161.94 at 139.26 to bring rebound.