Sample Category Title
Yen Dips in Sluggish Markets, Eyes on Trump-Zelenskyy Talks
Trading across global markets is subdued today, with Asia and the West pulling in different directions. Japan’s Nikkei hit a fresh record high, but European equities and US futures slipped modestly, leaving overall sentiment sluggish.
Some attention is turning to Washington, where US President Donald Trump hosts Ukrainian President Volodymyr Zelenskyy, followed by joint talks with European leaders. The effort is framed as a bid to advance toward ending the war in Ukraine, but expectations remain muted. Observers stress that negotiations involving Russia, Ukraine, Europe, and the US are still in their infancy. Trump’s recent meeting with Putin showed how entrenched positions remain, making it clear that the road to even a ceasefire will be long and fraught. Markets are tempering hopes accordingly.
In FX, Yen came under renewed selling pressure as the US session commences, making it the day’s weakest performer, followed by Euro and Sterling. A focus is on whether USD/JPY can break above 148.51 resistance, which would confirm the pullback from 150.90 has ended and open the way for a broader Yen decline. By contrast, Loonie is leading gains, followed by Kiwi and Aussie. Dollar and Swiss Franc are trading in the middle of the pack.
In Europe, at the time of writing, FTSE is down -0.09%. DAX is down -0.32%. CAC is down -0.80%. UK 10-year yield is up 0.002 at 4.698. Germany 10-year yield is down -0.029 at 2.761. Earlier in Asia, Nikkei rose 0.77%. Hong Kong HSI fell -0.37%. China Shanghai SSE rose 0.85%. Singapore Strait Times fell -1.02%. Japan 10-year JGB yield rose 0.006 to 1.572.
EU exports stagnate as US, China imports surge
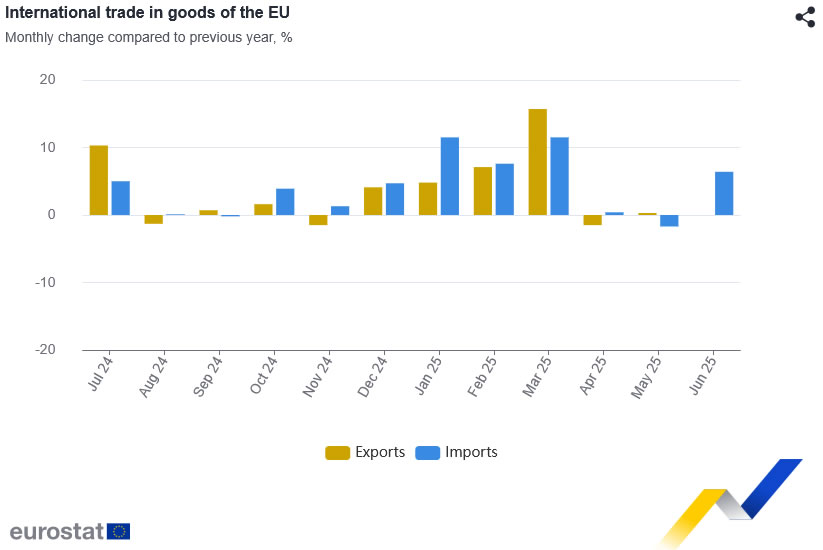
Eurozone recorded a EUR 7.0B surplus in goods trade in June, as modest export growth was outpaced by stronger imports. Exports ticked up 0.4% yoy to EUR 237.2B, while imports jumped 6.8% yoy to EUR 230.2B.
Across the EU as a whole, goods surplus narrowed to EUR 8.0B. Exports held steady at EUR 213.7B, but imports rose 6.4% yoy to EUR 205.7B.
Trade with major partners showed contrasting trends. EU exports to the US and China dropped sharply, down -10.3% yoy and -12.7% yoy, while exports to the UK grew 7.4% yoy.
At the same time, imports from the US and China surged by 16.4% yoy and 167% yoy respectively, while UK shipments into the EU declined -3.6% yoy.
NZ BNZ services uptick to 48.9, contraction persists
New Zealand’s BusinessNZ Performance of Services Index improved slightly in July, rising from 47.6 to 48.9. But the sector remained in contraction for the sixth consecutive month. Also, the latest reading is still well below the long-run survey average of 52.9.
Details showed mixed conditions. Activity/Sales stayed in contraction at 47.5, and New Orders stalled at 50.0. On the positive side, Inventories expanded for the second month at 51.4. Employment component slid to 47.1, extending its losing streak to 20 months.
Business sentiment, while slightly less negative, continued to reflect difficult conditions. Around 58.5% of comments were pessimistic, down from 66.2% in June. Firms pointed to declining sales, reduced spending, and persistent cost-of-living pressures. Inflation, high interest rates, weather disruptions, staffing shortages, and global uncertainty all weighed on confidence.
NZD/USD stuck in falling channel as RBNZ shadow board splits
NZD/USD is trading quietly within range, with investors cautious ahead of RBNZ’s policy decision this Wednesday. Market consensus is for a 25bps cut, though the NZIER Shadow Board revealed a broad spread of opinions, from a 50bps reduction to no move at all. The diversity highlights some uncertainty surrounding the policy outlook.
According to the Shadow Board, the case for a cut is backed by persistent slack in the labor market and subdued domestic activity. Still, near-term inflation pressures complicate the picture. While one board member argued for a more aggressive 50bps cut to support growth, two stressed the risks of loosening again with price pressures still elevated.
Looking further ahead, views on the OCR in 12 months are diverse, from no additional easing to further cuts required. One member sees strong commodity prices and lower rates supporting activity, with inflation potentially rising toward the top of the RBNZ’s 1–3% target band. That backdrop suggests patience may be prudent. Though, two members maintain the economy will still need further stimulus beyond August.
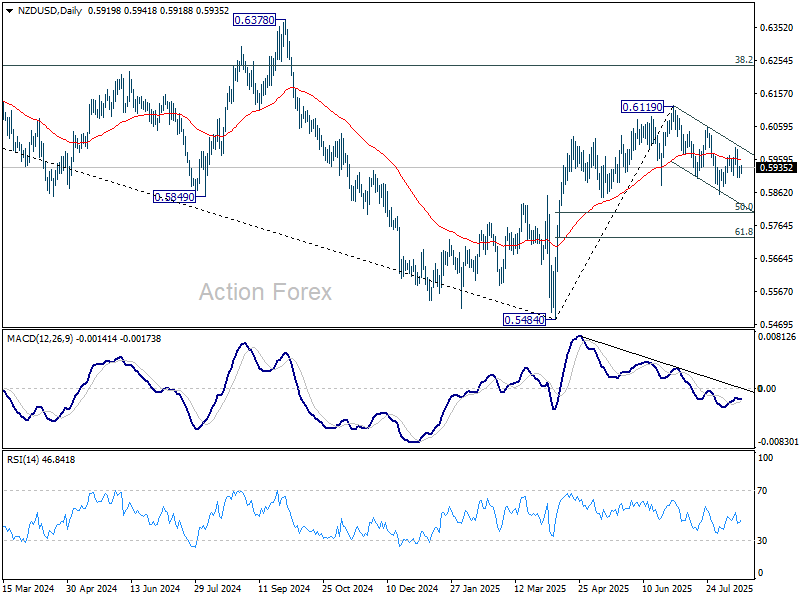
Technically, NZD/USD remains mildly bearish as its stays confined within the near-term falling channel. Rebound from 0.5855 appears to have topped out at 0.5995. Fall from there is seen as another leg of the decline from 0.6119.
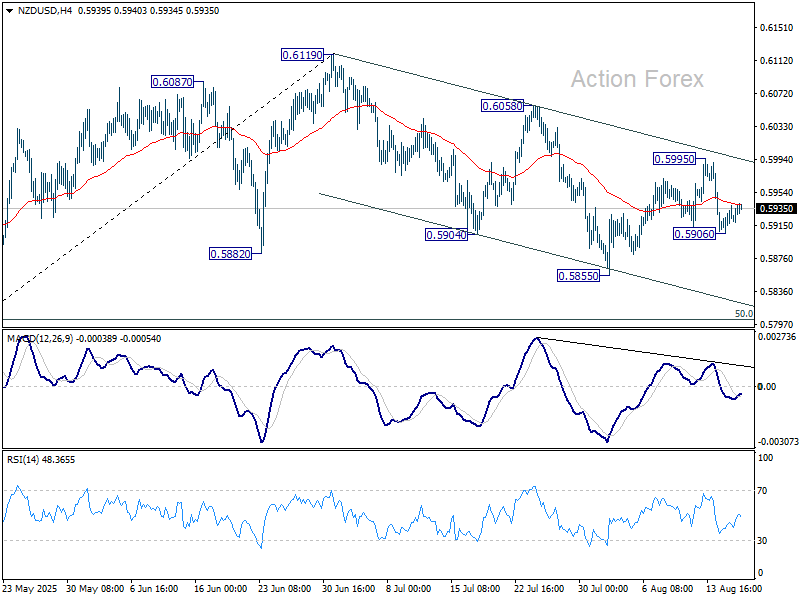
Structurally, while the pullback from 0.6119 looks corrective, risks are skewed toward another dip. A slide to 50% retracement of 0.5484 to 0.6119 at 0.5802 is in favor before NZD/USD finds a firmer base.
USD/JPY Mid-Day Outlook
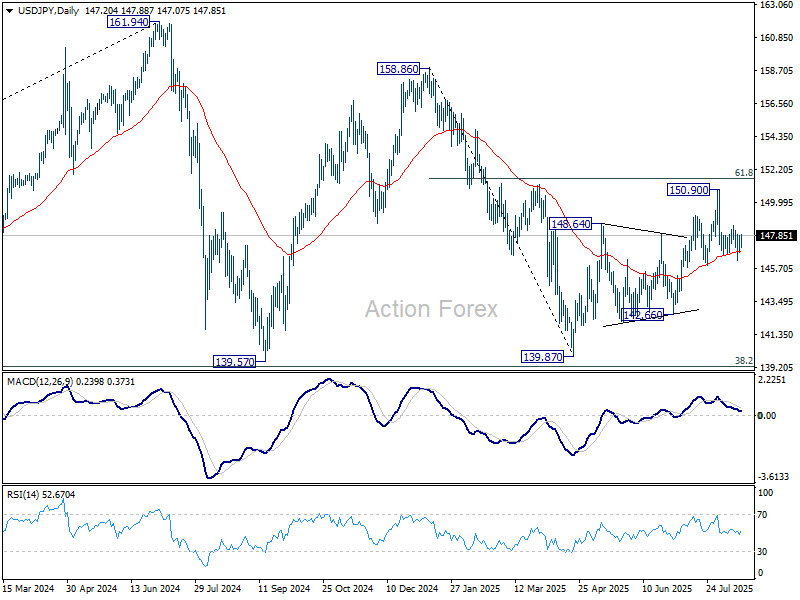
Daily Pivots: (S1) 146.61; (P) 147.29; (R1) 147.83; More...
USD/JPY recovers notably in early US session but stays well inside range of 146.20/148.51. Intraday bias remains neutral. On the upside, break of 148.51 will indicate that the pullback from 150.90 has completed, and bring retest of this high. This will also keep the whole rise from 139.87 alive. However, firm break of 145.84 support will argue that the rebound from 139.87 has completed, and turn near term outlook bearish.
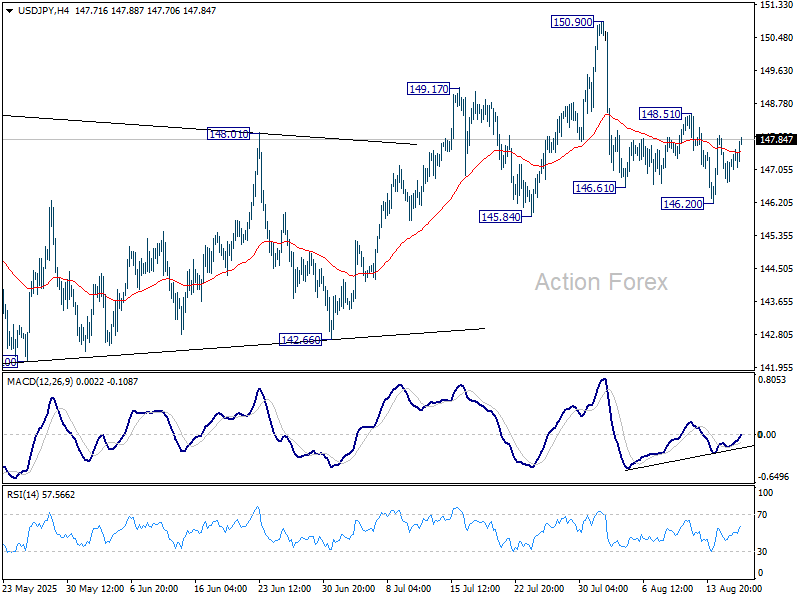
In the bigger picture, price actions from 161.94 (2024 high) are seen as a corrective pattern to rise from 102.58 (2021 low). Decisive break of 61.8% retracement of 158.86 to 139.87 at 151.22 will argue that it has already completed with three waves at 139.87. Larger up trend might then be ready to resume through 161.94 high. In case the corrective pattern extends with another fall, strong support is expected from 38.2% retracement of 102.58 to 161.94 at 139.26 to bring rebound.
WTI Crude Technical: Bearish Tone Intact as Trump-Zelenskiy Meeting Looms
West Texas Oil CFD (a proxy for WTI crude futures) fell as expected, dropping -3.2% to a three-month low of US$62.19 on Wednesday, 13 August 2025. The decline came ahead of the Trump-Putin meeting on Friday, 18 August, where talks are set to focus on a potential ceasefire to end the three-year Russia-Ukraine war.
West Texas Oil CFD extended its decline in today’s Asia session, slipping -0.7% intraday following last Friday’s Trump–Putin meeting in Alaska to print a current intraday low of US$62.47 at this time of writing.
While President Trump described the talks as “productive,” he provided no details on a potential Russia–Ukraine ceasefire. Markets now turn their focus to today’s meeting between Ukrainian President Zelenskiy, several European leaders, and Trump for further developments.
Let’s examine the latest short-term technical elements in the West Texas Oil CFD and its short-term directional bias (1 to 3 days) from a technical analysis perspective.
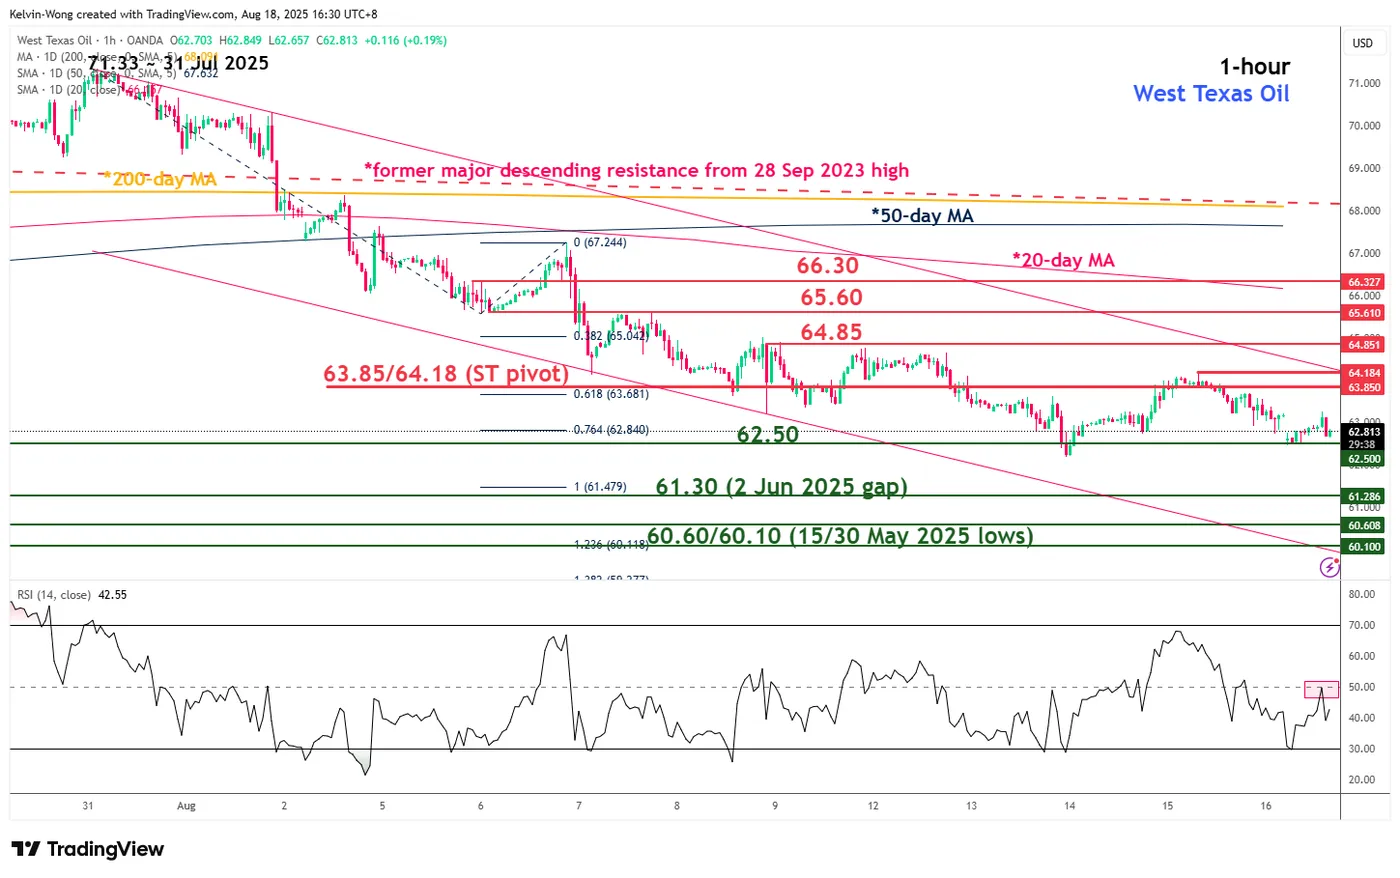
Fig. 1: West Texas Oil CFD minor trend as of 18 Aug 2025 (Source: TradingView)
Preferred trend bias (1-3 days)
Bearish bias in West Texas Oil CFD with key short-term pivotal resistance at US$63.85/64.18 and break below US$62.50 reinforces the continuation of a potential bearish impulsive down move sequence to expose the next intermediate supports at US$61.30 (gap of 2 June 2025) and US$60.60/60.10 (Fibonacci extension and lower boundary of minor descending channel from 31 July 2025 high).
Key elements
- Price actions of the West Texas Oil CFD have continued to oscillate within a minor descending channel from the 31 July 2025 swing high of US$71.33, which suggests a minor downtrend phase remains intact.
- The upper boundary of the minor descending channel is acting as a key intermediate resistance at US$54.18.
- The hourly RSI momentum indicator has not flashed out any bullish divergence condition in today’s Asia session and has just staged a retreat right at the 50 level. These observations suggest that short-term bearish momentum remains intact.
Alternative trend bias (1 to 3 days)
A clearance above US$64.18 invalidates the bearish scenario and triggers a possible mean reversion rebound towards the next intermediate resistances at US$64.85, US$65.60, and US$66.30 (also the downward sloping 20-day moving average).
Gold: Bullish Bias Above Daily Cloud, All Eyes on Trump’s Meetings with Political Leaders
Gold price edged higher in early Monday, as uncertainty grows ahead of today’s meeting between President Trump and leaders of Ukraine and some European countries.
The US President sent a strong signal that the US wants to end war in Ukraine, following Friday’s Trump-Putin summit in Alaska, which many analysts described as the most significant political event in 21st century.
Although Trump’s rhetoric is still rough in some cases and includes threats to both sides, it looks that the story may accelerate towards the peace agreement as Trump sees restoring of ties with Russia and new business deals as better solution than to continue to confront them.
The Europe and Ukraine’s space to maneuver has narrowed further, mainly due to their high dependence of US help, which could be reduced or stopped in case they reject Trump’s suggestions.
However, we may see a clearer picture probably by Tuesday morning, when results of top-level meeting (due later today) come out.
Gold price would come under pressure if the outcome of today’s meeting signals a peace deal on horizon, while prevailing hawkish tones would likely boost safe-haven demand and lift metal’s price.
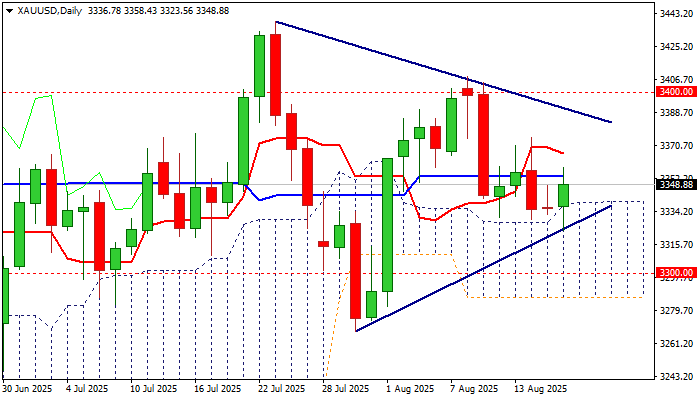
Technical picture on daily chart remains bullishly aligned as near-term price action continues to float above the top of daily Ichimoku cloud ($3337), also supported by ascending trendline lower boundary ($3327).
Momentum indicator is in positive territory and adds to bullish bias, although near term action needs to see lift above $3365/74 zone (daily Tenkan-sen / Friday’s peak) to strengthen bulls for attack at $3391 (upper triangle boundary) and unmask upper breakpoint at $3400 zone (psychological / Aug 8 high).
Conversely, penetration and closing within daily cloud (below triangle support line) would weaken near term structure and bring in focus key supports at $3300 (psychological) and $3286 (daily cloud top).
Interesting situation could be also seen on monthly chart, where three consecutive long-legged monthly Dojis and four strong upside rejections generate signals of high uncertainty, but also warn that larger bulls might be running out of steam.
Markets will be also focusing on Jackson Hole symposium which starts later this week and look for more signals about Fed’s interest rate path.
Res: 3353; 3366; 3375; 3391.
Sup: 3337; 3327; 3321; 3307.
Bitcoin Deepens Its Decline, Causing Concern for the Uptrend
Market Overview
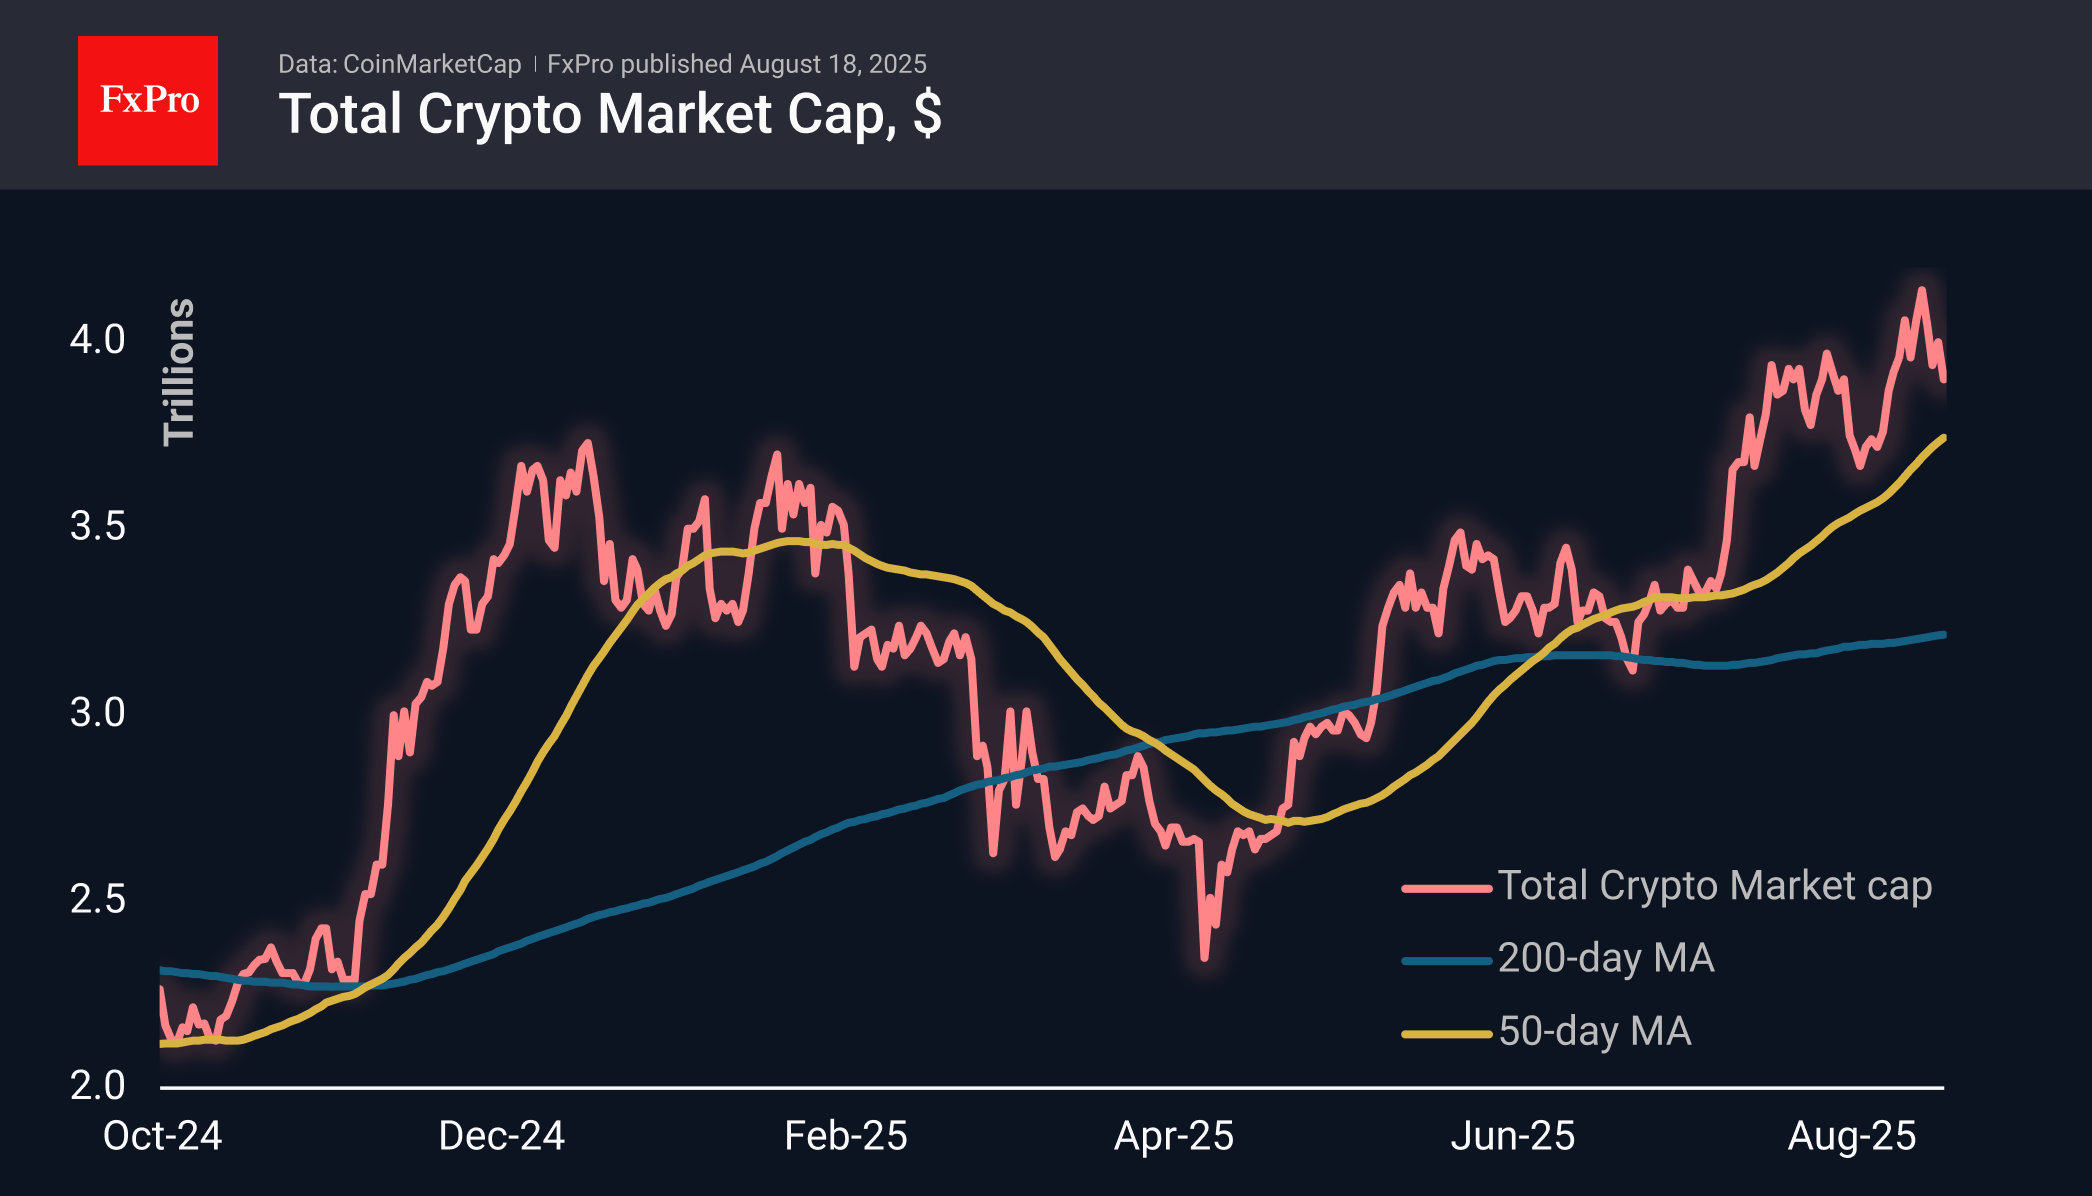
The crypto market continued its decline on Monday after a pause over the weekend. The total capitalisation fell back to $3.88 trillion, reaching its lowest level in more than two weeks. As expected, altcoins are falling the hardest, with Ethereum and XRP losing about 5% in the last 24 hours, twice as much as Bitcoin. The crypto market has returned to the area that acted as resistance in July. Will it become support this time?
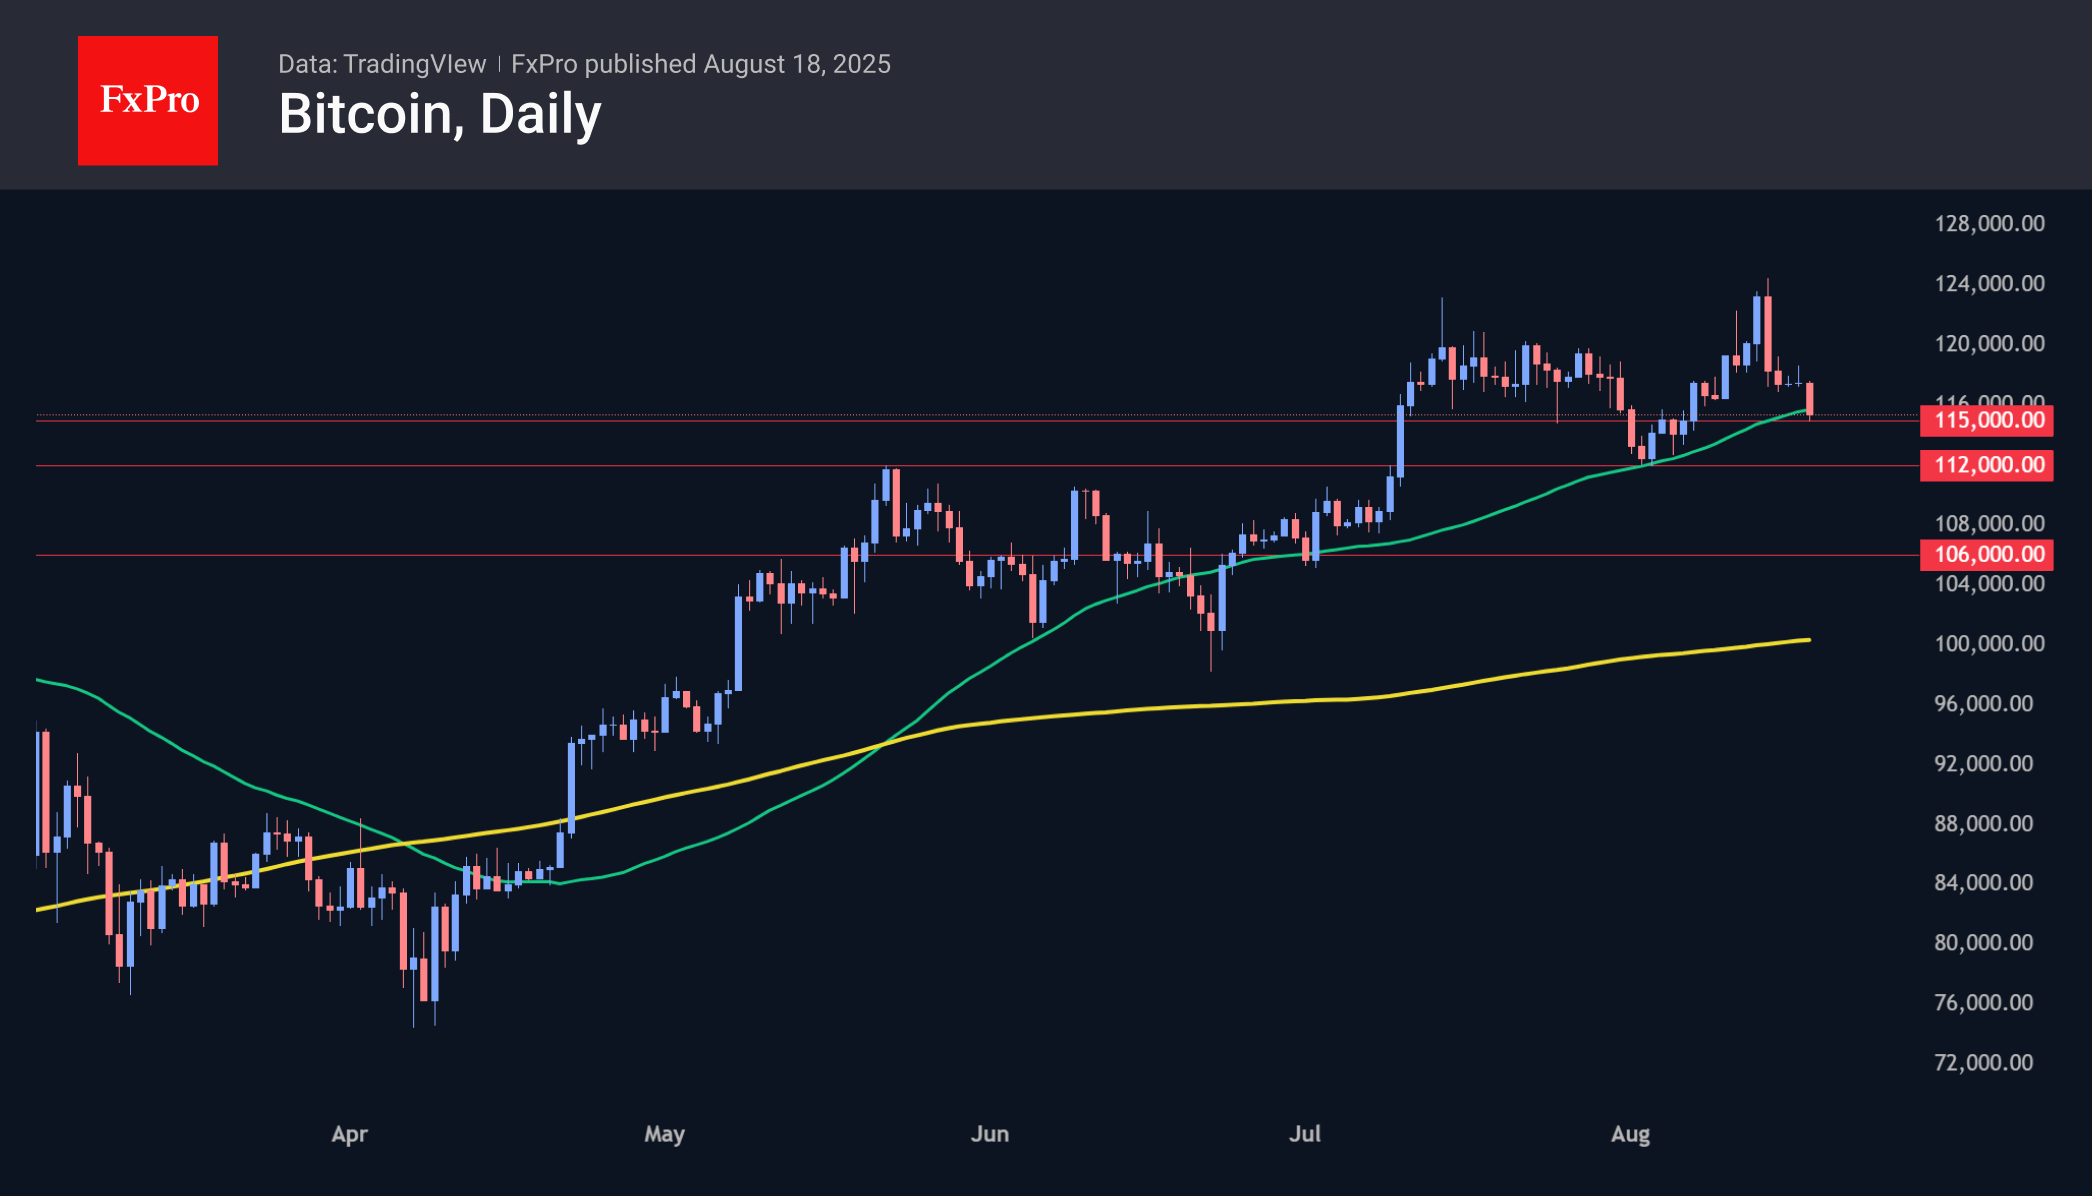
Bitcoin fell to $115K, the lowest level in the last 11 days. It is now testing the 50-day moving average, which has been the bullish trend line since April. A consolidation below it will sharply increase the chances of a deeper correction, and a failure below $112K — the area of recent lows — will confirm the correction, opening the potential for a decline to $105-107K.
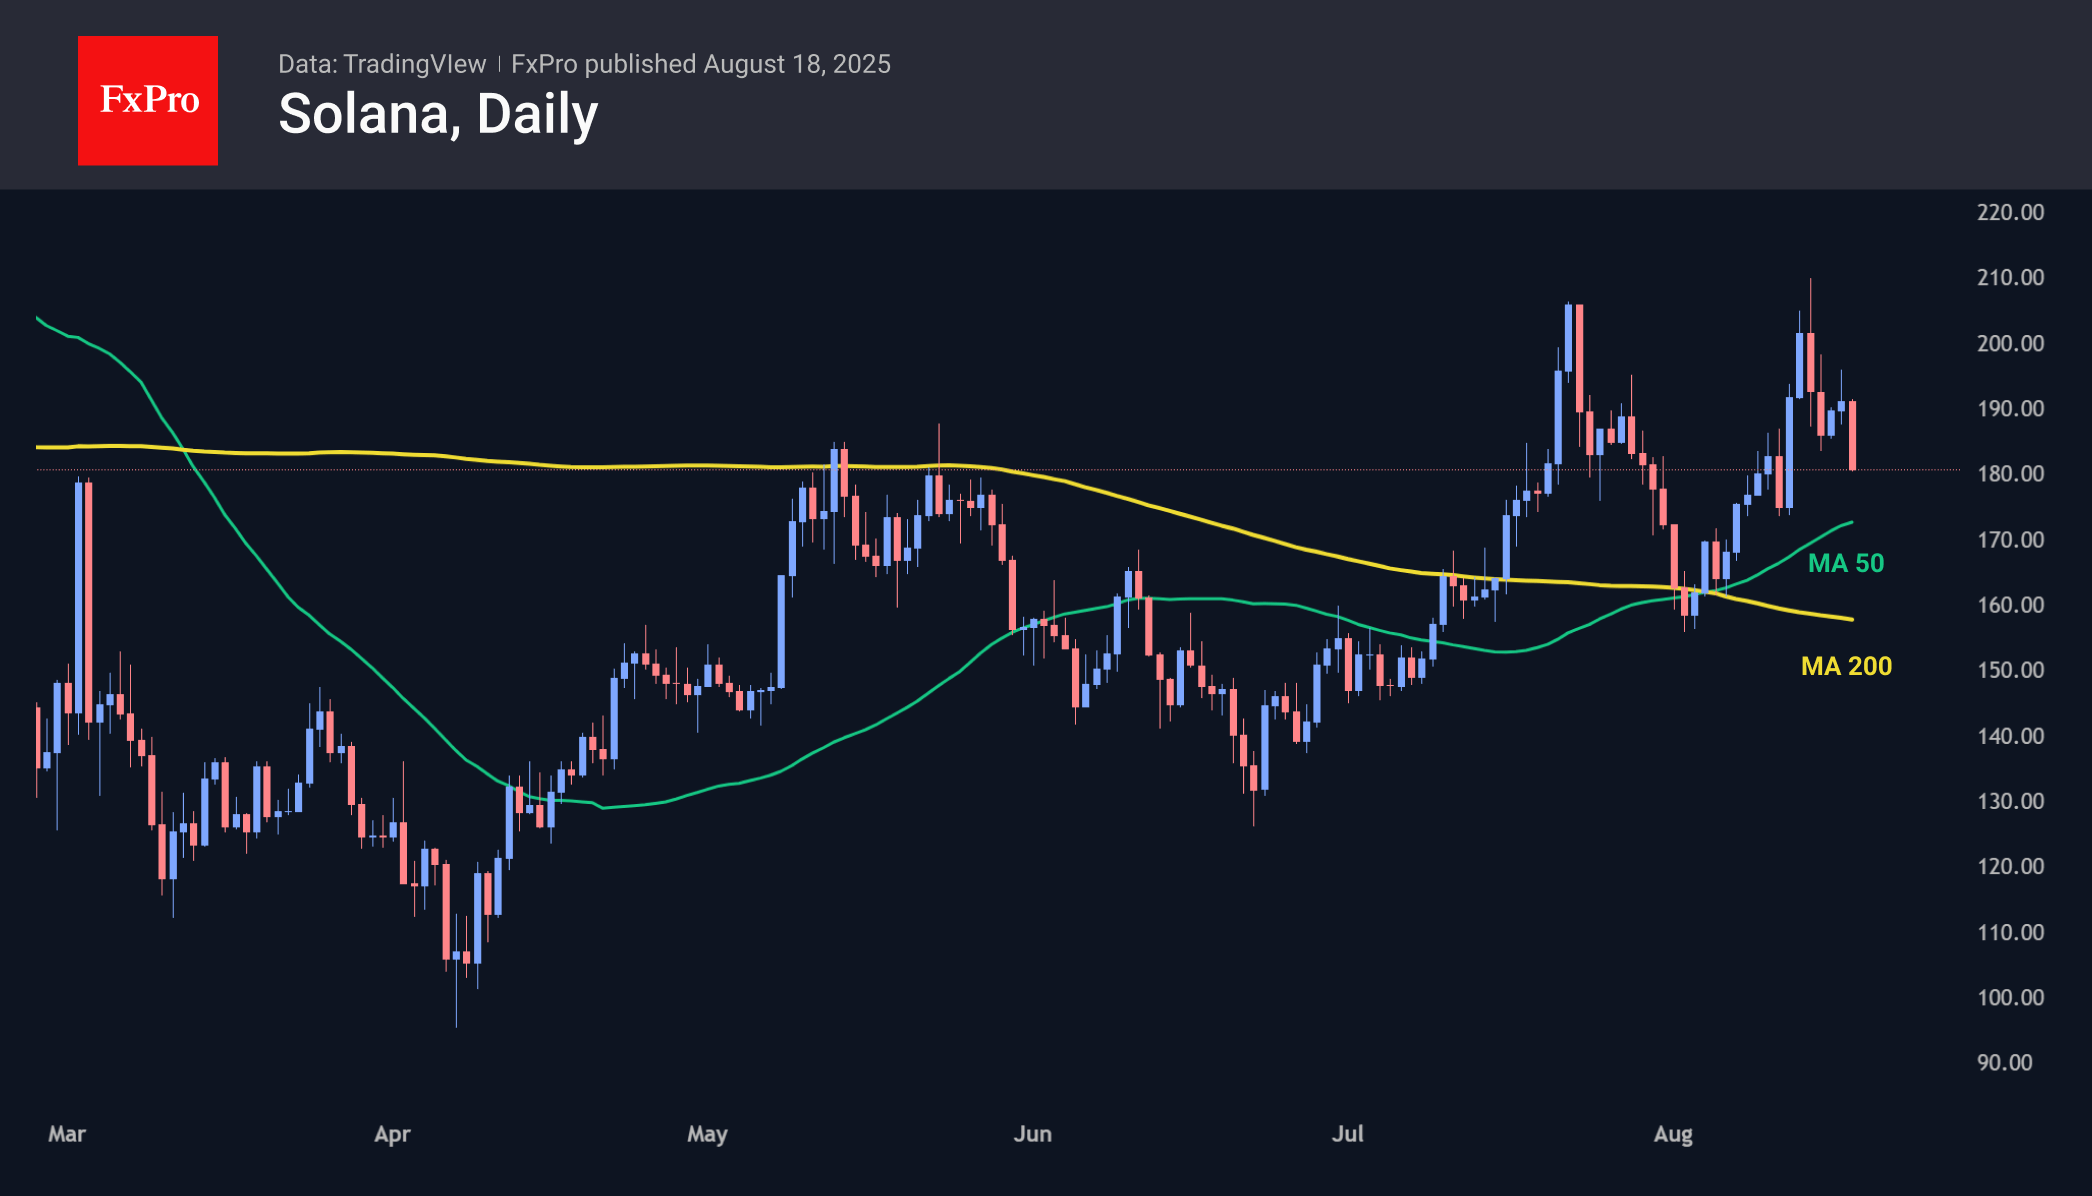
Solana is trading at $180, failing to consolidate above $210 for the second time in the last 30 days. Technically, it is worth watching the coin’s dynamics near the $170 and $160 levels, where the 50- and 200-day moving averages are located, respectively. A rebound from these levels could restore bullish sentiment, while a failure to break above them would signal internal weakness in the crypto market.
News Background
According to SoSoValue, net inflows into spot BTC ETFs rose to $547.8 million last week. Total inflows since the approval of Bitcoin ETFs in January 2024 have increased to $54.97 billion.
Weekly inflows into spot Ethereum ETFs in the US rose sharply to $2.85 billion, breaking the mid-July record. The positive trend has continued for 14 consecutive weeks. Total net inflows since the ETF’s launch in July 2024 have increased to $12.67 billion.
According to CryptoQuant, the inflow of stablecoins to Binance from large investors and institutions has reached one of the highest levels in recent months. This may indicate expectations of a new rally.
MN Trading founder Michael van de Poppe suggests that Bitcoin may decline a little further before consolidating. The key resistance level for a resumption of growth is $121,000. Glassnode considers $127,000 to be the key resistance level for BTC after it updated its highs.
Trader Nebraskangooner notes that the Bitcoin chart repeats the situation in November 2021, when the asset reached an all-time high of $69,000. Analyst Benjamin Cowen also believes that BTC shows the same pattern every year after halving: growth to the peak of the market cycle in the fourth quarter, followed by a bear market.
NZD/USD stuck in falling channel as RBNZ shadow board splits
NZD/USD is trading quietly within range, with investors cautious ahead of RBNZ’s policy decision this Wednesday. Market consensus is for a 25bps cut, though the NZIER Shadow Board revealed a broad spread of opinions, from a 50bps reduction to no move at all. The diversity highlights some uncertainty surrounding the policy outlook.
According to the Shadow Board, the case for a cut is backed by persistent slack in the labor market and subdued domestic activity. Still, near-term inflation pressures complicate the picture. While one board member argued for a more aggressive 50bps cut to support growth, two stressed the risks of loosening again with price pressures still elevated.
Looking further ahead, views on the OCR in 12 months are diverse, from no additional easing to further cuts required. One member sees strong commodity prices and lower rates supporting activity, with inflation potentially rising toward the top of the RBNZ’s 1–3% target band. That backdrop suggests patience may be prudent. Though, two members maintain the economy will still need further stimulus beyond August.
Technically, NZD/USD remains mildly bearish as its stays confined within the near-term falling channel. Rebound from 0.5855 appears to have topped out at 0.5995. Fall from there is seen as another leg of the decline from 0.6119.
Structurally, while the pullback from 0.6119 looks corrective, risks are skewed toward another dip. A slide to 50% retracement of 0.5484 to 0.6119 at 0.5802 is in favor before NZD/USD finds a firmer base.
EU exports stagnate as US, China imports surge
Eurozone recorded a EUR 7.0B surplus in goods trade in June, as modest export growth was outpaced by stronger imports. Exports ticked up 0.4% yoy to EUR 237.2B, while imports jumped 6.8% yoy to EUR 230.2B.
Across the EU as a whole, goods surplus narrowed to EUR 8.0B. Exports held steady at EUR 213.7B, but imports rose 6.4% yoy to EUR 205.7B.
Trade with major partners showed contrasting trends. EU exports to the US and China dropped sharply, down -10.3% yoy and -12.7% yoy, while exports to the UK grew 7.4% yoy.
At the same time, imports from the US and China surged by 16.4% yoy and 167% yoy respectively, while UK shipments into the EU declined -3.6% yoy.
GBP/USD Pushes Higher While EUR/GBP Attempts to Find Support
GBP/USD is showing strength above 1.3450 and 1.3500. EUR/GBP declined and is now consolidating losses above 0.8600.
Important Takeaways for GBP/USD and EUR/GBP Analysis Today
- The British Pound is attempting a fresh increase above 1.3500.
- There is a key bullish trend line forming with support near 1.3550 on the hourly chart of GBP/USD at FXOpen.
- EUR/GBP is trading in a bearish zone below the 0.8650 pivot level.
- There is a connecting bearish trend line forming with resistance near 0.8635 on the hourly chart at FXOpen.
GBP/USD Technical Analysis
On the hourly chart of GBP/USD at FXOpen, the pair remained well-bid above 1.3400. The British Pound started a decent increase above 1.3475 against the US Dollar.
The bulls were able to push the pair above the 50-hour simple moving average and 1.3500. The pair even climbed above 1.3550 and traded as high as 1.3594. Recently, there was a pullback below 1.3575 and the 23.6% Fib retracement level of the upward move from the 1.3399 swing low to the 1.3594 high.
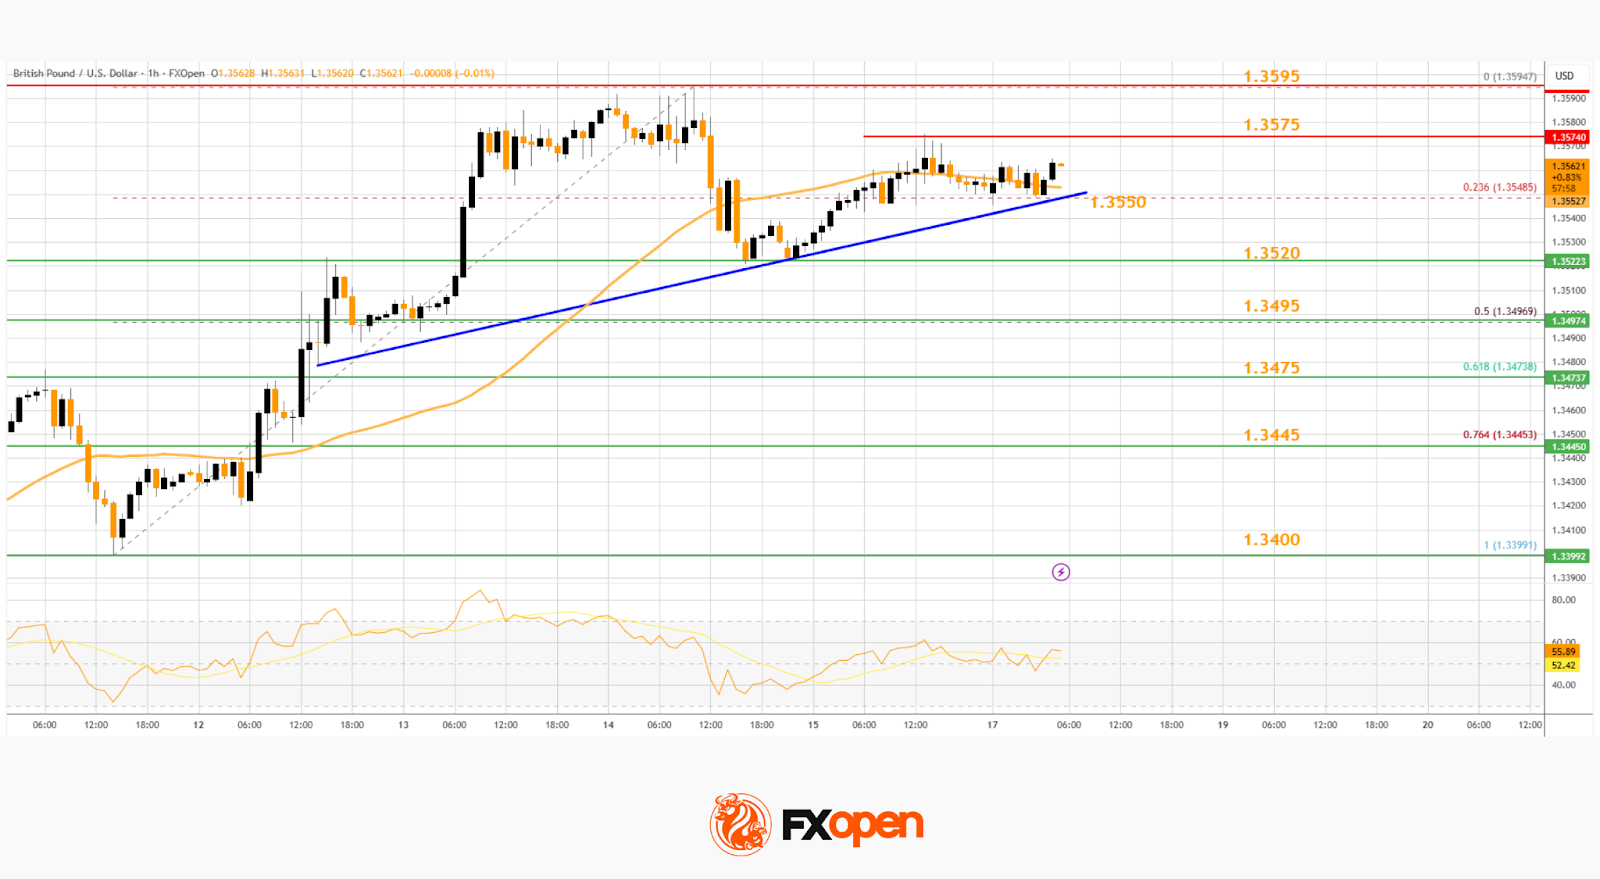
However, the bulls were active near the 1.3520 support. The pair is again rising above 1.3540. There is also a key bullish trend line forming with support near 1.3550.
On the upside, the GBP/USD chart indicates that the pair is facing resistance near 1.3575. The next hurdle for the bulls could be 1.3595. A close above 1.3595 could open the doors for a move toward 1.3640.
Any more gains might send GBP/USD toward 1.3720. On the downside, the bulls might remain active near the same trend line at 1.3550. If there is a downside break below 1.3550, the pair could accelerate lower.
The first major support is at 1.3520, below which the pair could test the 50% Fib retracement at 1.3495. The next key area for the bulls could be 1.3475, below which the pair could test 1.3445. Any more losses could lead it toward 1.3400.
EUR/GBP Technical Analysis
On the hourly chart of EUR/GBP at FXOpen, the pair started a steady decline from well above 0.8700. The Euro traded below 0.8650 against the British Pound.
The EUR/GBP chart shows that the pair even declined below 0.8620 and the 50-hour simple moving average. A low was formed at 0.8596 and the pair is now consolidating losses. There was a move above 0.8620 and the 23.6% Fib retracement level of the downward move from the 0.8743 swing high to the 0.8596 low.
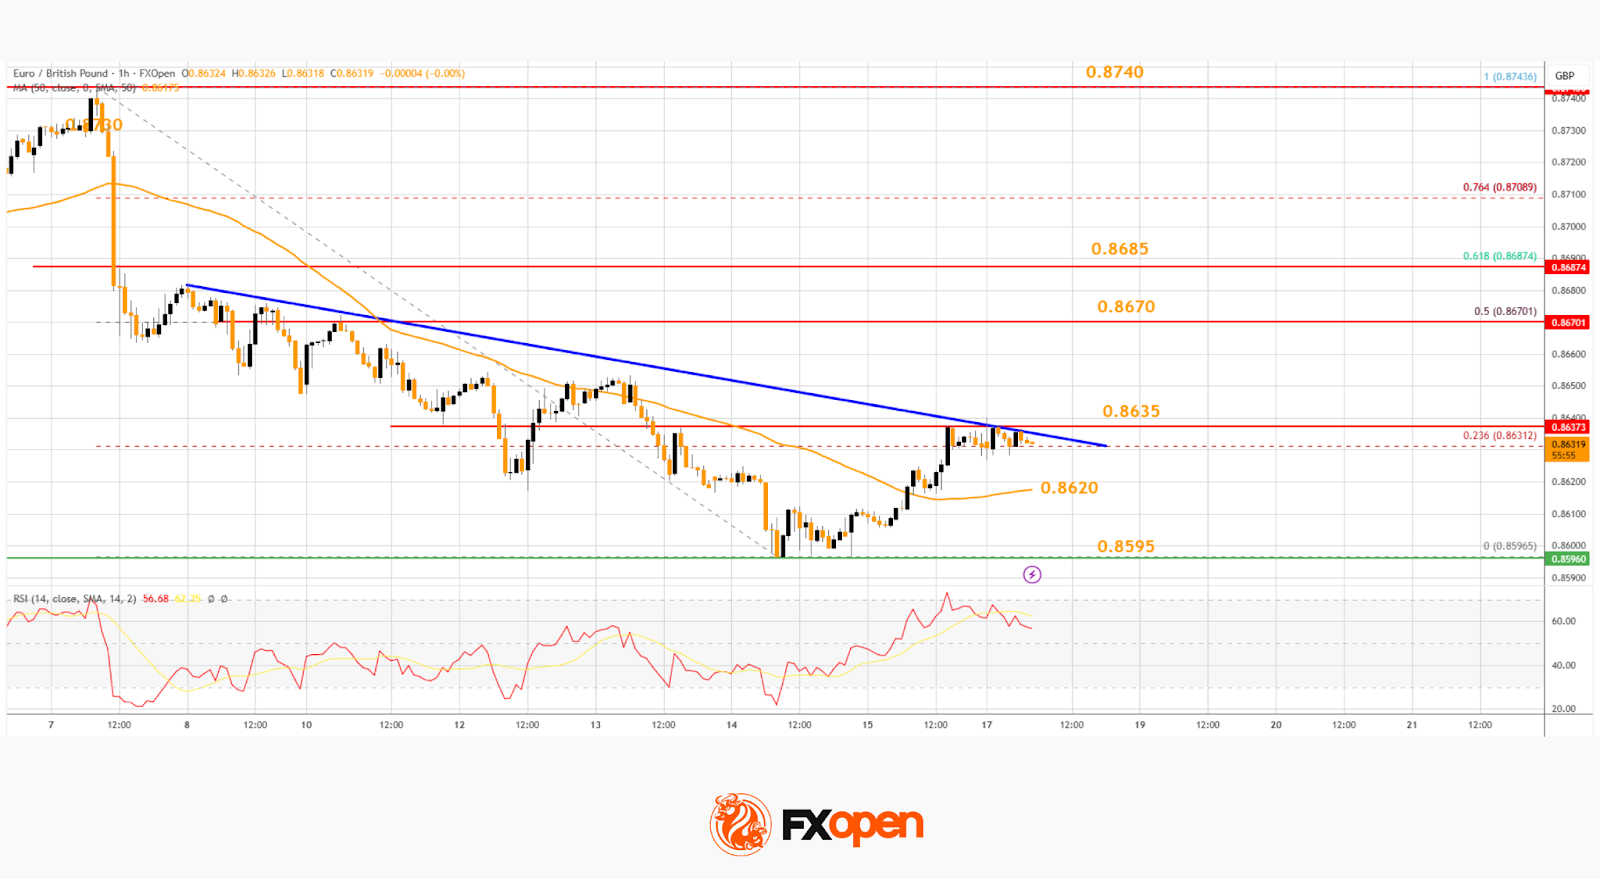
The pair is now facing resistance near a connecting bearish trend line at 0.8635. The next major barrier for the bulls could be the 50% Fib retracement at 0.8670.
A close above 0.8670 might accelerate gains. In the stated case, the bulls may perhaps aim for a test of 0.8685. Any more gains might send the pair toward the 0.8740 pivot.
Immediate support sits near 0.8620. The first key zone sits at 0.8595. A downside break below 0.8595 might call for more downsides. In the stated case, the pair could drop toward 0.8550.
Trade over 50 forex markets 24 hours a day with FXOpen. Take advantage of low commissions, deep liquidity, and spreads from 0.0 pips. Open your FXOpen account now or learn more about trading forex with FXOpen.
This article represents the opinion of the Companies operating under the FXOpen brand only. It is not to be construed as an offer, solicitation, or recommendation with respect to products and services provided by the Companies operating under the FXOpen brand, nor is it to be considered financial advice.
Dollar Index (DXY) in Balance Ahead of Key Events
In our previous analysis of the US Dollar Index (DXY), we:
→ outlined a descending channel (red) based on a sequence of lower highs and lows;
→ anticipated a move towards the median line of this channel.
As of 18 August, the DXY is trading around the median of the channel and is forming a contracting triangle pattern (blue). The RSI remains close to the neutral 50 level, indicating equilibrium between supply and demand.
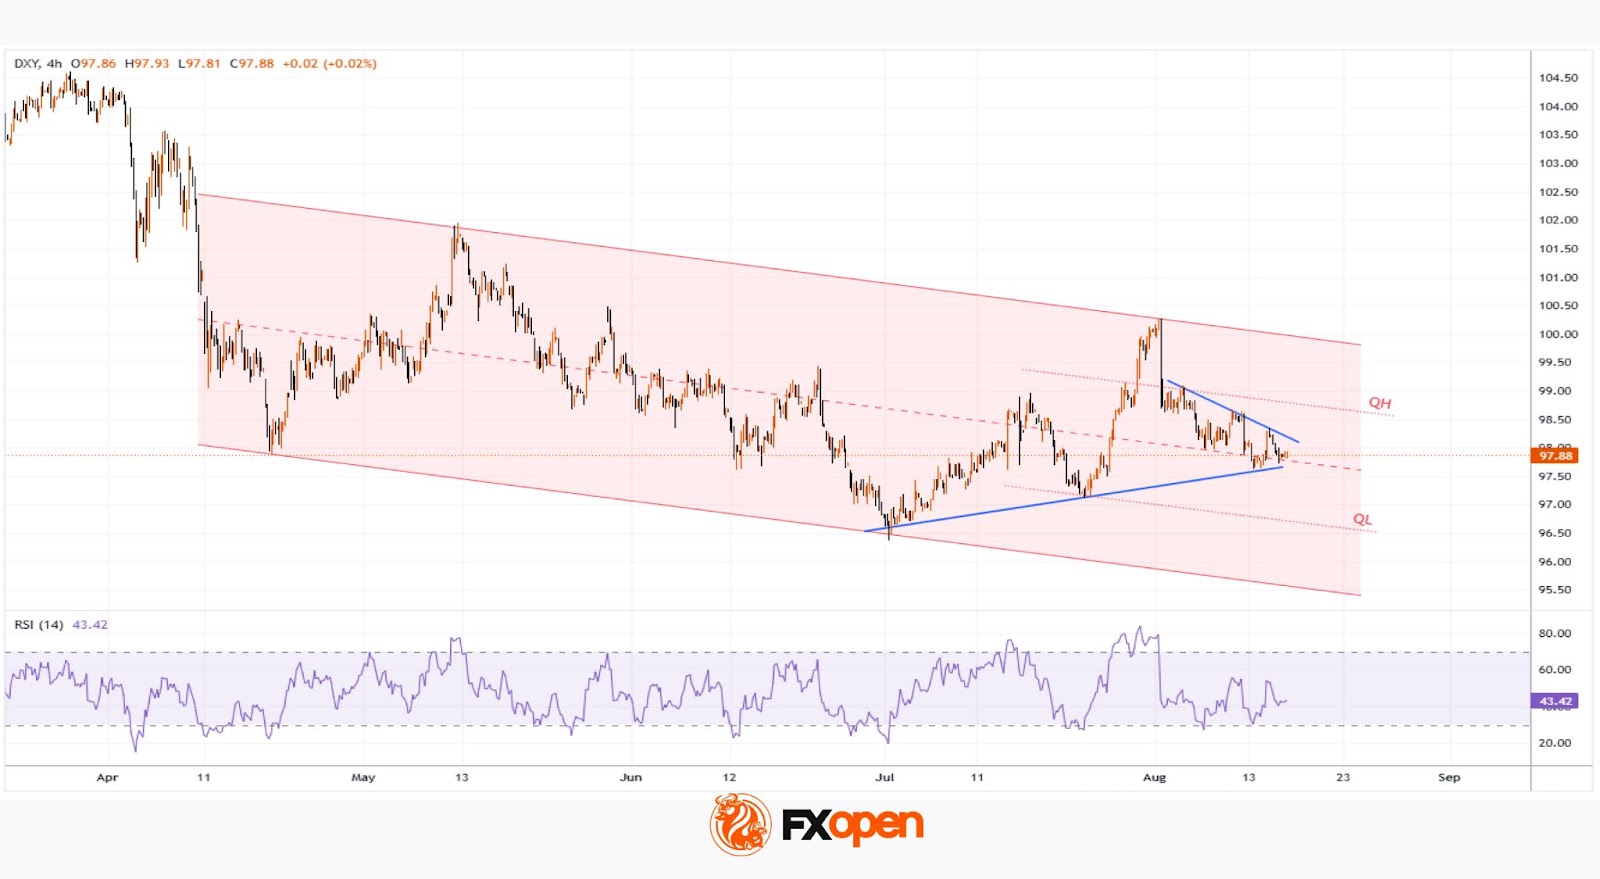
This balance may be ruined given upcoming events:
→ Today, discussions at the White House between Donald Trump, Volodymyr Zelenskyy, and European leaders will focus on the conflict in Ukraine. The outcome may provide clarity following the Trump–Putin meeting on 15 August.
→ On Wednesday at 21:00 GMT+3, the FOMC minutes will be released. Markets will look for guidance on the likelihood of a September rate cut after last Thursday’s stronger-than-expected Producer Price Index (PPI) print, which some interpret as a signal of potential inflationary pressures from new trade tariffs.
Market participants should anticipate volatility, with price impulses possible in either direction.
The base scenario for the week is a test of one of the quarter lines (QL/QH) within the channel, consistent with the broader US dollar weakening trend in place since January 2025. A breakout of QL or QH line and sustained move away from the channel median would indicate a shift in sentiment and the potential for a directional move beyond the current structure.
Trade global index CFDs with zero commission and tight spreads. Open your FXOpen account now or learn more about trading index CFDs with FXOpen.
This article represents the opinion of the Companies operating under the FXOpen brand only. It is not to be construed as an offer, solicitation, or recommendation with respect to products and services provided by the Companies operating under the FXOpen brand, nor is it to be considered financial advice.
Dollar Still Struggles to Avoid Further Losses
Markets
US data on Thursday and Friday dampened hopes for the Fed to turn to more neutral policy conditions already at the mid-September policy meeting. After an unexpected acceleration in PPI inflation, July US retail sales also didn’t show any urgency for the Fed to fuel demand already at this stage. Headline sales rose a close-to-expectations 0.5% M/M with June sales being upwardly revised (0.9%). Control group sales (0.5% M/M) also still suggest a decent contribution of consumer spending to Q3 GDP. The NY empire manufacturing survey printed at a solid 11.9 (best in nine months). Michigan consumer confidence disappointed (58.6 from 61.7), mainly due to a less favorable assessment of current conditions. However, the closely watched inflation expectations jumped sharply higher (1-y ahead 4.9% from 4.5%, 5-10-y 3.9% from 3.4%). After Thursday’s post-PPI rebound, US yields in a steepening move added between 1.8 bps (2-y) to 4.6 bps (30-y). Markets again fully returned to a path of gradual Fed policy easing with a first 25 bps step in September and one additional move by the end of the year. A bit surprising/remarkable, German bunds even underperformed US Treasuries with yields rising between 2.7 bps (2-y) and 8.3 bps (30-y). The latter now decisively cleared the 2023 top, trading at the highest level since 2011. Markets pondering the (inflationary/reflationary ) impact of an agreement for the war in Ukraine might have been in play. The ‘better’ US data again didn’t help the dollar. DXY dropped from the 98.20 area to close near 97.85. EUR/USD returned to the 1.17 big figure.
Asian markets take a constructive stance this morning. The meeting between US president Trump and Russian president Putin this weekend at least kept all options open for Trumps’ meeting with Ukrainian President Zelensky and EU leaders today. US yields this morning are shifting to a wait-and-see stance after last week’s rebound. The dollar still struggles to avoid further losses. The eco calendar in the US and Europe is thin today. Later this week, the August PMI’s (Thursday) provide an update on the health of the economy, in EMU but also in the US. However, markets mainly look forward to Fed Powell’s Jackson Hole address scheduled for Friday. Recent US data suggest it’s too early for the Fed Chair to unequivocally open the door for aggressive further policy normalization yet. Even so markets will continue to look for any signs that the Fed is giving more weight to labour market softness rather than to (tariff-driven) inflation. Even as the pace of Fed easing is still subject to a high degree of uncertainty, the dollar probably will remain in the defensive. We also look out whether the negotiations (and hope on progress) regarding the war in Ukraine continues supporting EMU yields and/or the single currency.
News & Views
UK property website Rightmove reported that average asking prices fell by 1.3% M/M in August to £368 740 (+0.3% Y/Y). That’s more or less in line with annual summer lulls, but follows on larger-than-usual price declines in June and July. Affordability increases with one in three properties seen a price reduction since being listed and the number of houses for sale at a decade high (+10% Y/Y). Rightmove indicates that “buyers have the upper hand in this high supply market, so a tempting price is vital to agree a sale”. Lower lending rates thanks to the Bank of England’s gradual policy normalization come in handy though the prospect for much more additional easing is limited.
Indian PM Modi proposed changes to the consumption tax system introduced in 2017. The next-Generation Goods and Services Tax is expected to take effect around the Hindu-festival of Diwali, in October. The current GST-structure with four main slabs (5%, 12%, 18% and 28%) will be replaced with a 5% rate for essential and common-use items, a 18% rate for stands goods and services and 40% for luxury and sin goods. 99% of the items who are currently in the 12% slab will move to the 5% one and around 90% of the items currently taxed at 28% will move to 18%. Petroleum products remain outside the GST regime. The simplified (and lower) tax regime will boost consumers’ disposable income and reduces compliance burden for MSME’s. India’s main equity index, Nifty 50 outperforms this morning, rising by 1.4%..
EUR/USD Daily Outlook
Daily Pivots: (S1) 1.1662; (P) 1.1689; (R1) 1.1731; More...
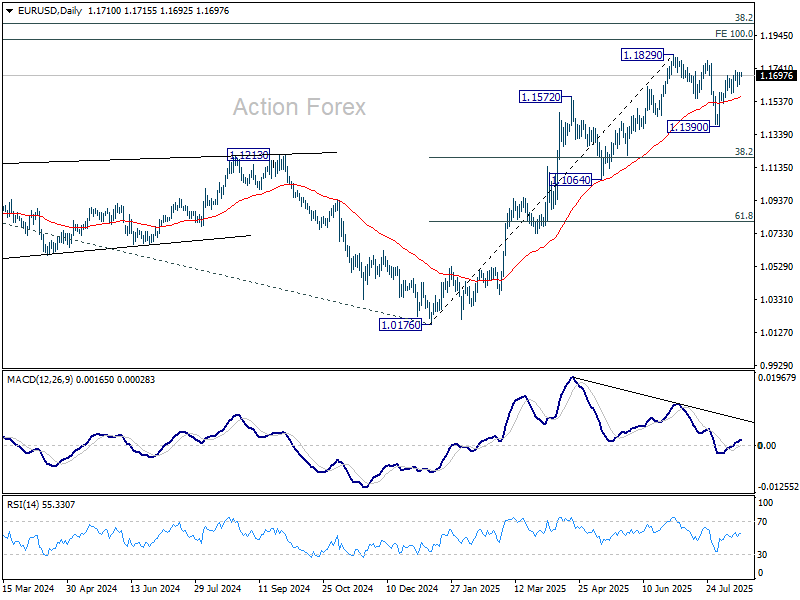
Intraday bias in EUR/USD remains neutral and more consolidations could be seen below 1.1729. Further rally is expected as long as 1.1589 support holds. Above 1.1729 will bring retest of 1.1829 high. On the downside, however, firm break of 1.1589 will turn bias to the downside, and extend the corrective pattern from 1.1829 with another fall.
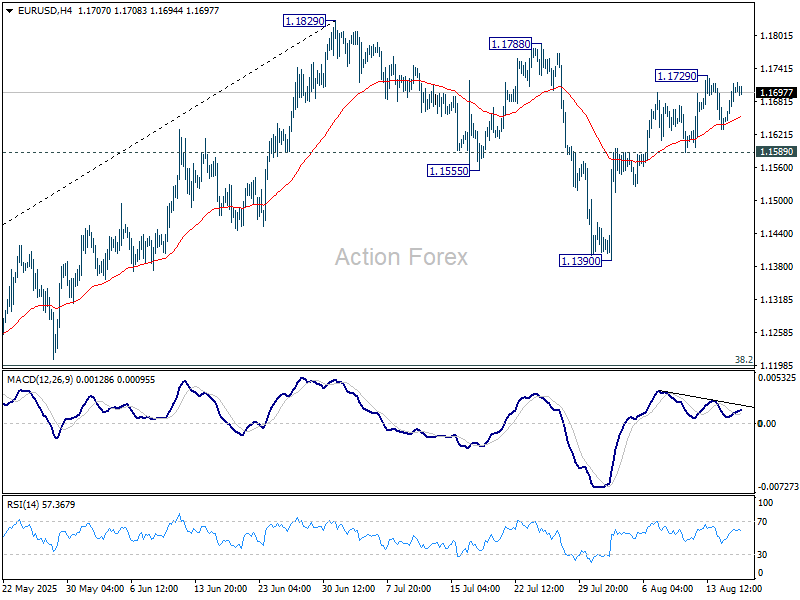
In the bigger picture, rise from 0.9534 long term bottom could be correcting the multi-decade downtrend or the start of a long term up trend. In either case, further rise should be seen to 100% projection of 0.9534 to 1.1274 from 1.0176 at 1.1916. This will remain the favored case as long as 1.1604 support holds.