
Sample Category Title
Elliott Wave View: Ethereum (ETH) Correcting in Double Three
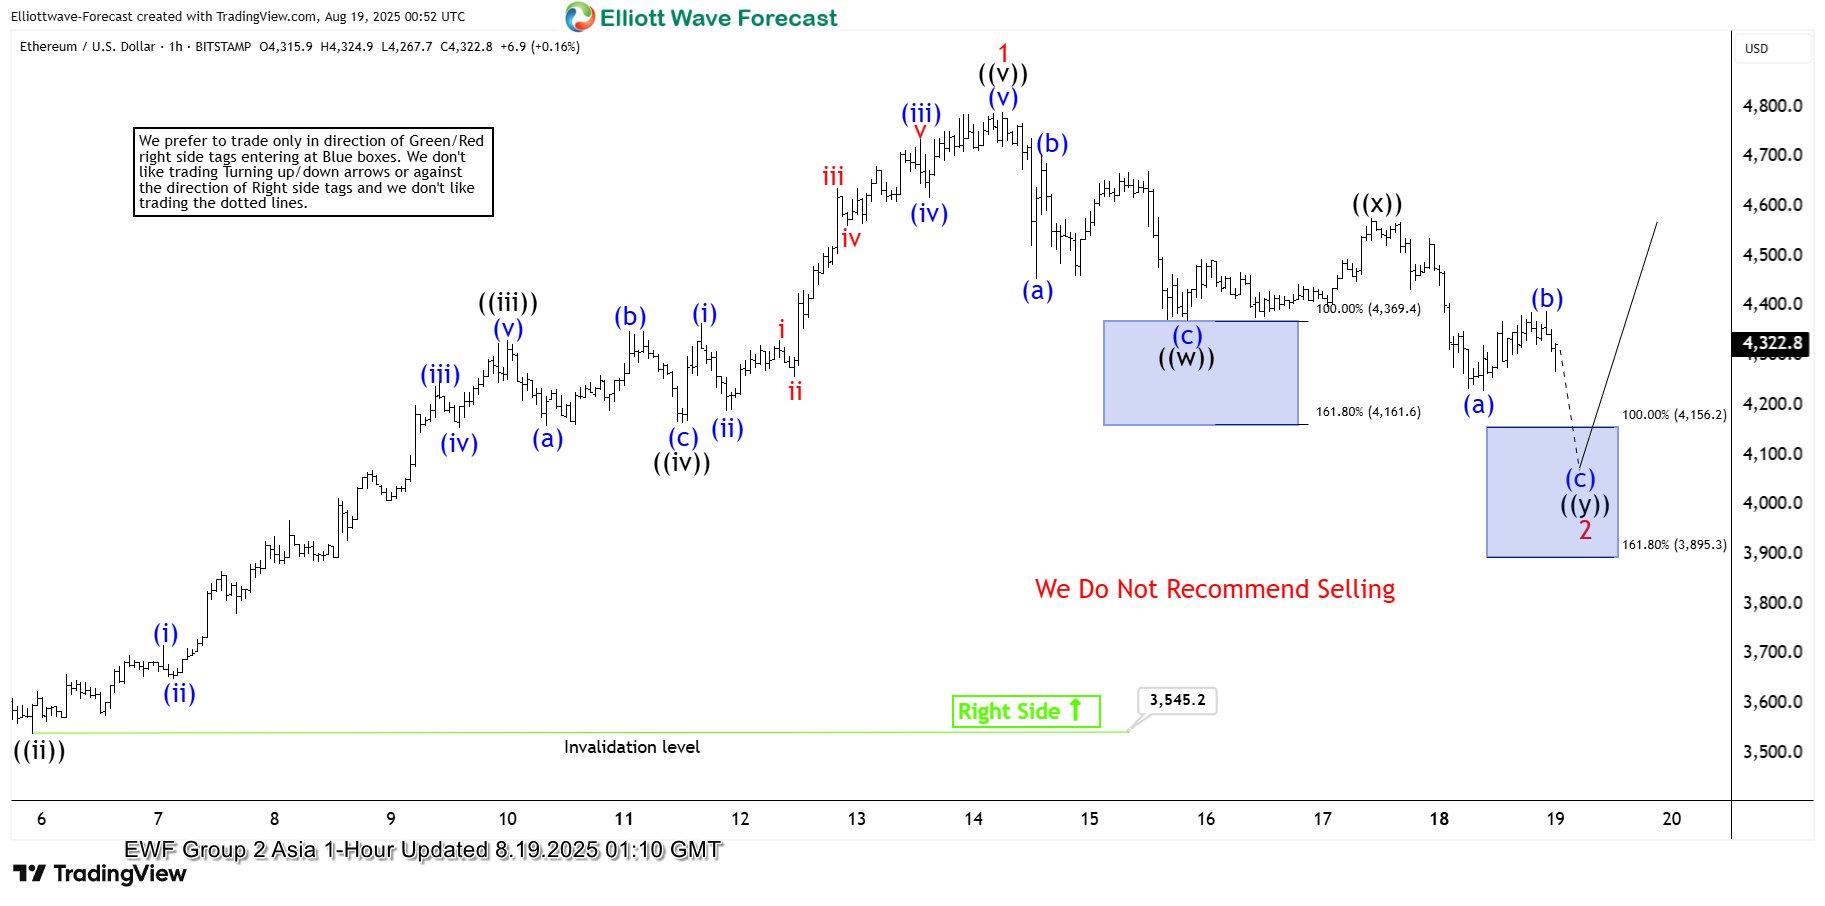
Ethereum completed its cycle from the August 2025 low, forming wave 1 through a five-wave impulse structure. Starting from the August 3, 2025 low, wave ((i)) peaked at $3,737.4, followed by a pullback in wave ((ii)) to $3,545.2. The cryptocurrency then surged in wave ((iii)) to $4,332.7, with a subsequent dip in wave ((iv)) concluding at $4,165.5. The final leg, wave ((v)), reached $4,791.5, finalizing wave 1 in a higher degree. This upward movement reflects Ethereum’s strong bullish momentum during this phase.
Currently, a corrective wave 2 is unfolding as a double three Elliott Wave structure. From the wave 1 peak, wave (a) declined to $4,455, and wave (b) rallied to $4,706.4. Ethereum then dropped in wave (c) to $4,370.9, completing wave ((w)) in a higher degree. A subsequent rally in wave ((x)) peaked at $4,578.1. From there, wave (a) fell to $4,228.8, and wave (b) climbed to $4,390. The ongoing wave (c) of ((y)) is expected to push Ethereum lower, targeting the $3,895–$4,156.2 range, which aligns with the 100%–161.8% Fibonacci extension of wave ((w)). From this zone, Ethereum could resume its upward trend or stage at least a three-wave bounce, signaling potential bullish continuation.
Ethereum (ETHUSD) – 60 Minute Elliott Wave Technical Chart:
ETHUSD – Elliott Wave Technical Video:
https://www.youtube.com/watch?v=bb2mUYeOUhg
Gold Remains Close to USD 3,330 Amid Geopolitical Tensions and Jackson Hole Expectations
On Tuesday, the price of gold stabilised around USD 3,330 per troy ounce. Investors are assessing US-led peace efforts and awaiting the outcome of the Federal Reserve’s annual Jackson Hole symposium.
Following Monday’s meeting at the White House, US President Donald Trump confirmed that he had discussed the situation with Russia and was now working on arranging direct talks with three presidents.
These developments sparked hopes of a possible peace deal, although market participants remain cautious and do not expect a quick resolution.
Traders are also focusing on the upcoming speech by Fed Chairman Jerome Powell in Wyoming. The market is waiting for signals regarding a potential resumption of interest rate cuts in September.
The baseline scenario still anticipates one rate cut at the September meeting, followed by another small easing by year-end, likely limited to 25 basis points.
Technical analysis of XAUUSD
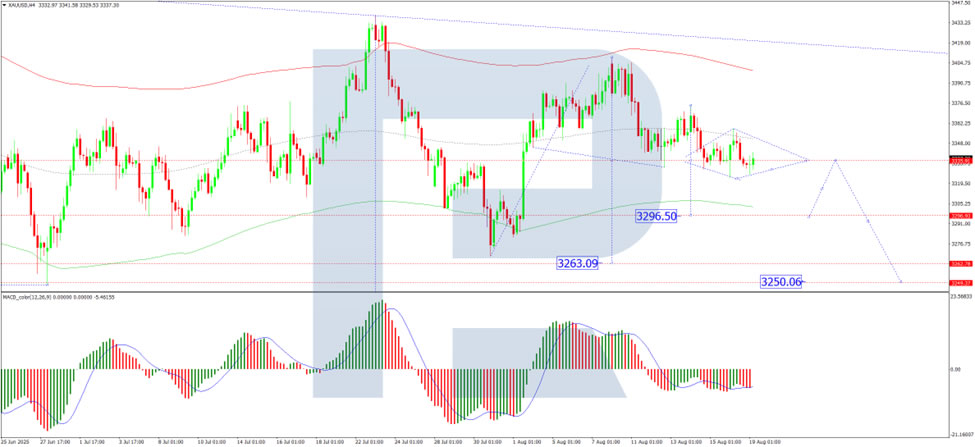
On the H4 chart of XAUUSD, the market continues to develop a wide consolidation range around the 3,333 level. The price has extended the range upwards to 3,357 and downwards to 3,322. Today, a breakout below this range towards 3,296 is possible. Afterwards, a correction to 3,333 may occur, followed by a decline to 3,263. The formation of a downward wave towards 3,250 is practically under consideration. This scenario is technically supported by the MACD indicator, whose signal line is below zero and pointing strictly downwards, confirming bearish momentum.
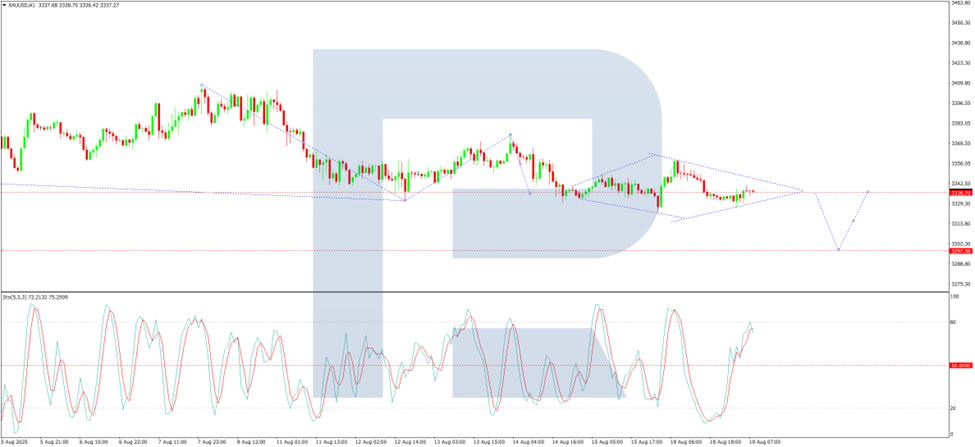
On the H1 chart, XAUUSD completed a downward impulse to 3,333 and is forming a consolidation range around this level. The third wave of decline is unfolding, targeting 3,297, with a likely continuation of the trend to 3,260. The Stochastic oscillator confirms this setup: its signal line is near the 80 level and preparing to drop towards 20, indicating growing downside pressure.
Summary
Gold is holding above USD 3,330 as geopolitical tensions and Jackson Hole expectations dominate sentiment. Technical indicators support the development of a downward wave with key targets at 3,296, 3,263, and potentially 3,250, while short-term consolidation remains around the 3,333 level.
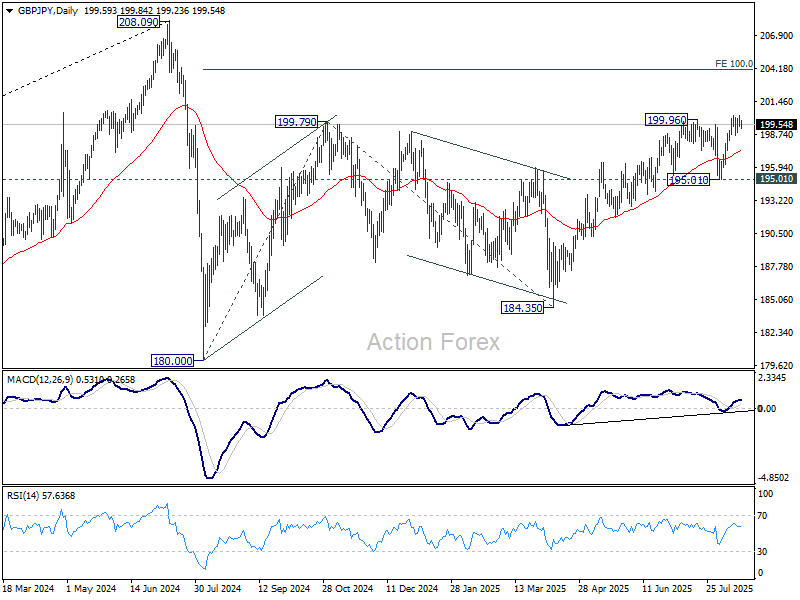
GBP/JPY Daily Outlook
Daily Pivots: (S1) 199.27; (P) 199.77; (R1) 200.17; More...
Intraday bias in GBP/JPY remains neutral and more consolidations could be seen below 200.26. But in case of another fall, downside should be contained well above 195.01 support. On the upside, firm break of 200.26 will resume the whole rise from 184.35 to 100% projection of 180.00 to 199.79 from 184.35 at 204.14.
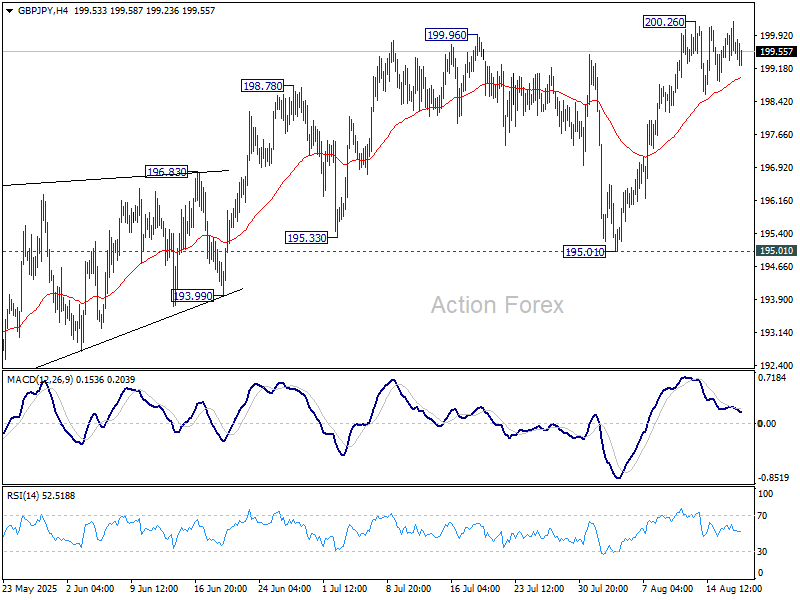
In the bigger picture, price actions from 208.09 (2024 high) are seen as a correction to rally from 123.94 (2020 low). The pattern might still extend with another falling leg. But in that case, strong support should be seen from 38.2% retracement of 123.94 to 208.09 at 175.94 to contain downside. Meanwhile, decisive break of 208.09 will confirm long term up trend resumption.
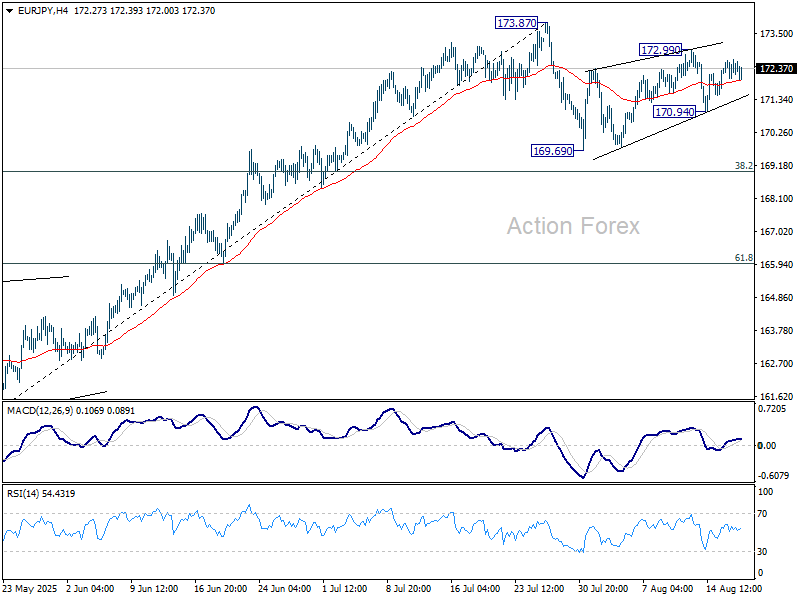
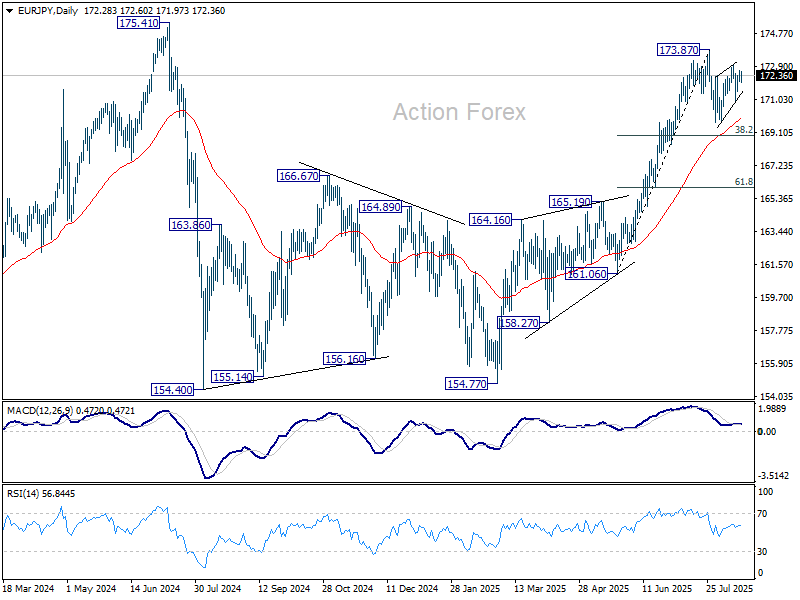
EUR/JPY Daily Outlook
Daily Pivots: (S1) 172.09; (P) 172.38; (R1) 172.71; More...
Intraday bias in EUR/JPY stays neutral at this point. Corrective pattern from 173.87 is still extending, and break of 170.94 will bring deeper fall to 169.69 support. But downside should be contained by 38.2% retracement of 161.06 to 173.87 at 168.97 to bring rebound. On the upside, above 172.99 will bring retest of 173.87.
In the bigger picture, considering current strong momentum as seen in the rally from 154.77, corrective pattern from 175.41 could have already completed. Decisive break of 154.77 will confirm long term up trend resumption. Next target is 61.8% projection of 124.37 to 175.41 from 154.77 at 186.31. However, rejection by 175.41, followed by firm break of 55 D EMA (now at 169.95) will delay this bullish case.
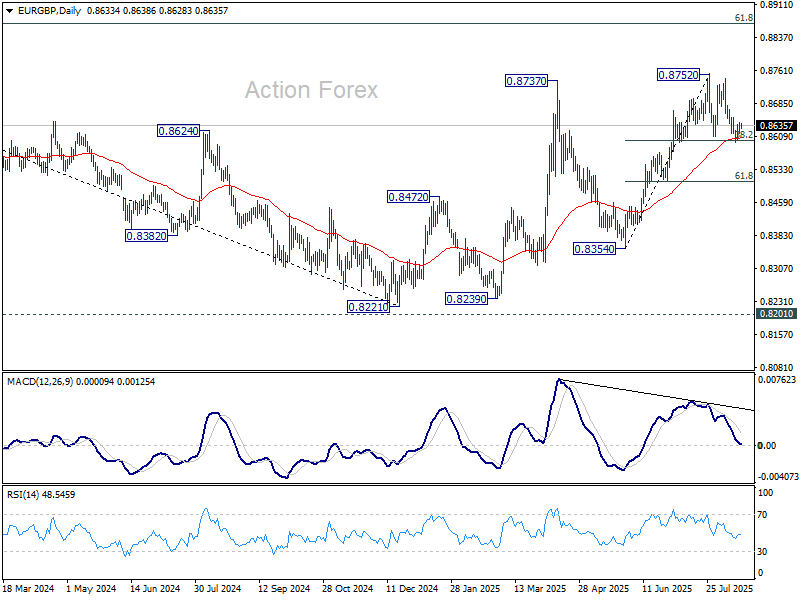
EUR/GBP Daily Outlook
Daily Pivots: (S1) 0.8622; (P) 0.8633; (R1) 0.8646; More...
Range trading continues in EUR/GBP above 0.8595 and intraday bias stays neutral. On the upside, break of 0.8652 will suggest that the corrective pattern from 0.8752 has completed after drawing support from 38.2% retracement of 0.8354 to 0.8752 at 0.8600, and retain near term bullishness. Intraday bias will be back on the upside for retesting 0.8752 high next. However, sustained break of 0.8600 will indicate near term bearish reversal and target 61.8% retracement at 0.8506.
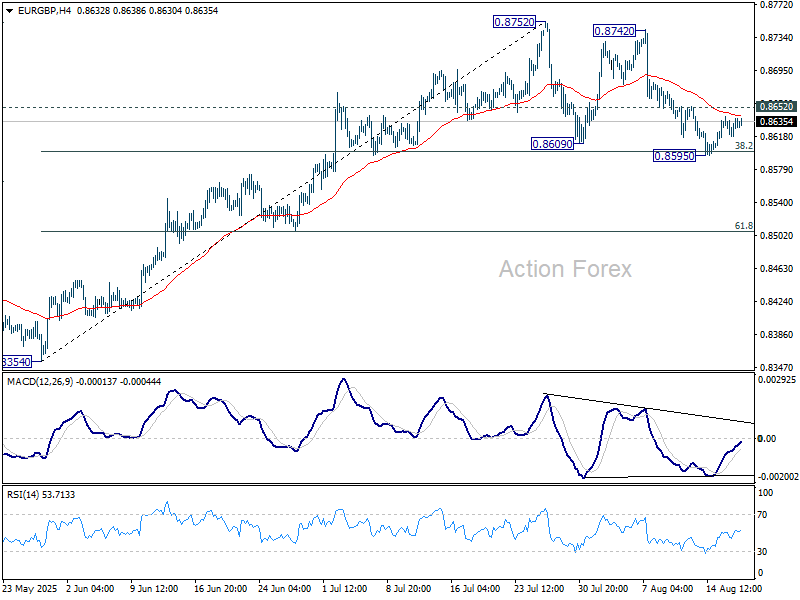
In the bigger picture, the structure from 0.8221 medium term bottom are not impulsive enough to suggest that it's reversing the down trend from 0.9267 (2022 high). But even if it's a correction, further rise is expected to 61.8% retracement of 0.9267 to 0.8221 at 0.8867. This will remain the favored case as long as 55 W EMA (now at 0.8501) holds.
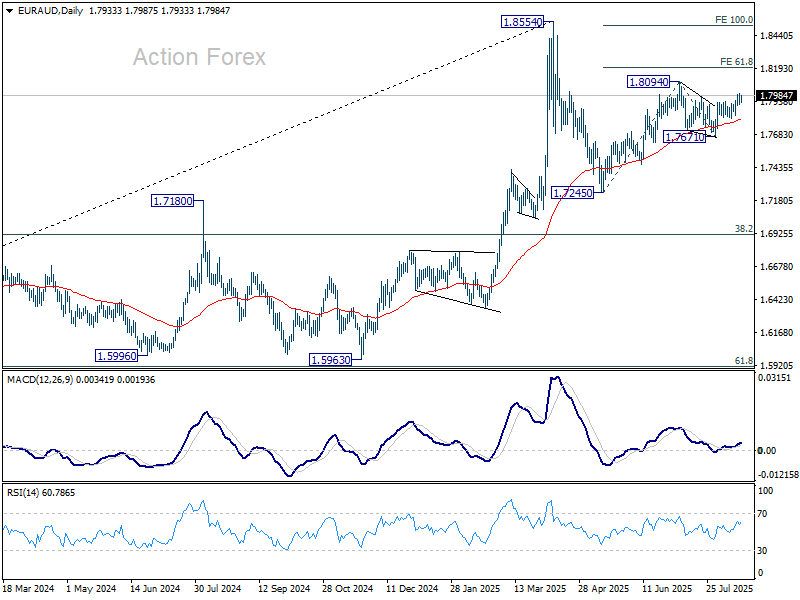
EUR/AUD Daily Outlook
Daily Pivots: (S1) 1.7922; (P) 1.7962; (R1) 1.8006; More...
Intraday bias in EUR/AUD remains mildly on the upside at this point. Correction from 1.8094 should have completed with three waves down to 1.7671. Further rally should be seen to 1.8094 first. Break there will resume the rally from 1.7245 to 61.8% projection of 1.7245 to 1.8094 from 1.7671 at 1.8196. This will now remain the favored case as long as 1.7830 support holds.
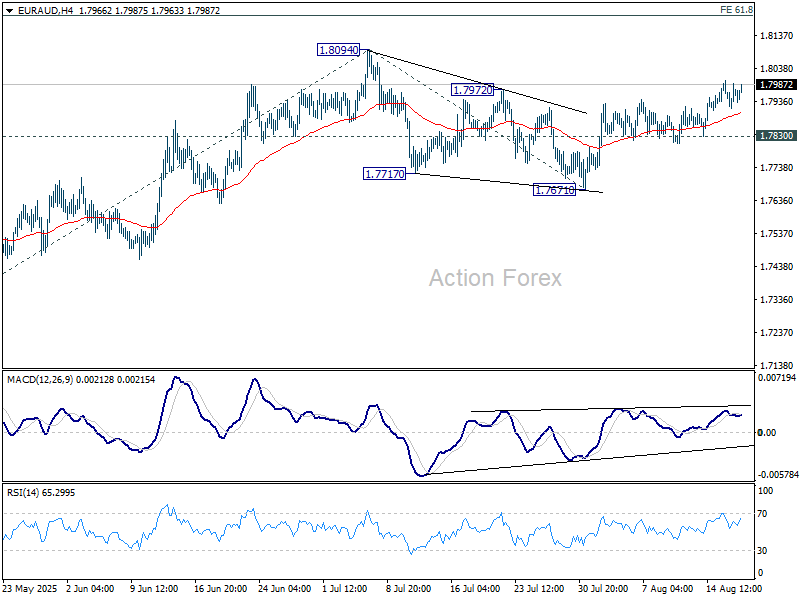
In the bigger picture, price actions from 1.8554 medium term top are seen as a corrective pattern. Such pattern could extend further with another falling leg. But even in that case, downside should be contained by 38.2% retracement of 1.4281 (2022 low) to 1.8554 at 1.6922 to bring rebound. Uptrend from 1.4281 is expected to resume at a later stage.
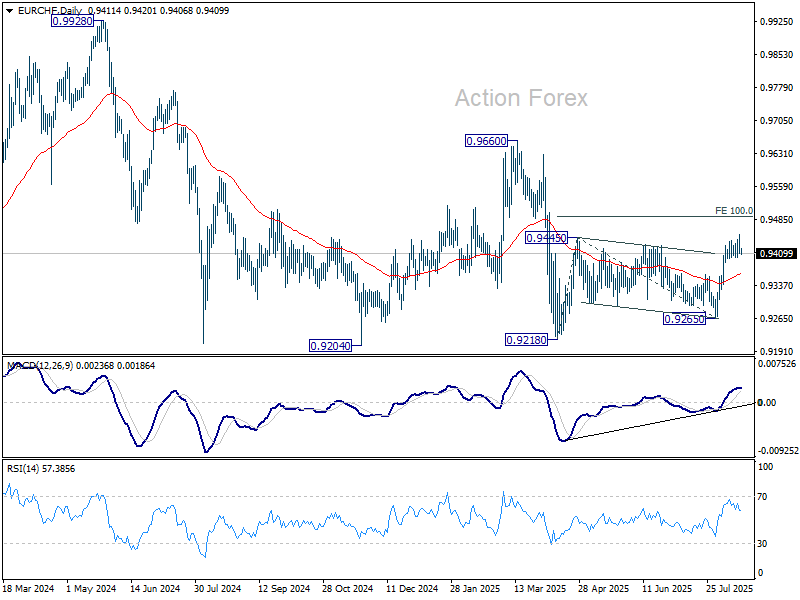
EUR/CHF Daily Outlook
Daily Pivots: (S1) 0.9401; (P) 0.9424; (R1) 0.9438; More....
EUR//CHF retreated after edging higher to 0.9452 and intraday bias is turned neutral again. Further rise is expected as long as 0.9400 support holds. Above 0.9452 will extend the rise from 0.9218 to 100% projection of 0.9218 to 0.9445 from 0.9265 at 0.9492. However, firm break of 0.9400 will turn bias back to the downside for 55 D EMA (now at 0.9364).
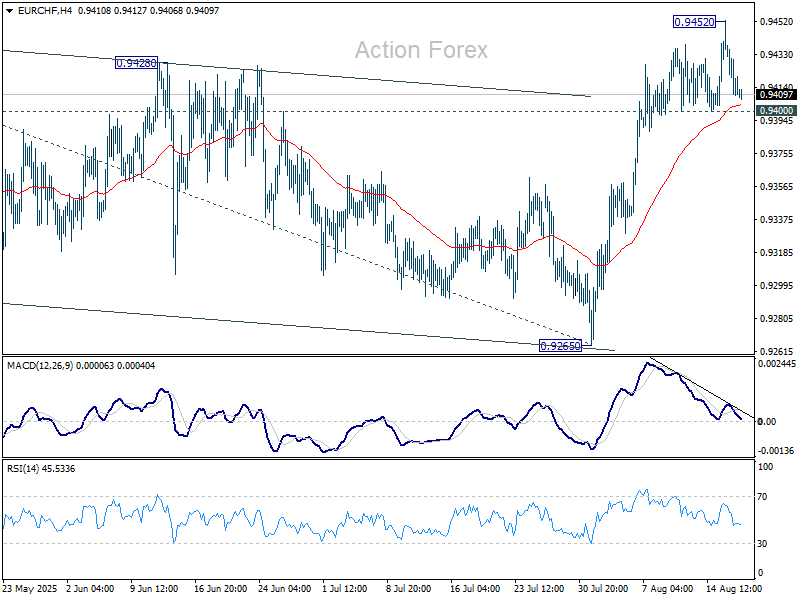
In the bigger picture, the down trend from 0.9204 (2018 high) might still be in progress considering that EUR/CHF is staying well inside the long term falling channel. However, with bullish convergence condition in W MACD, downside potential should be limited in case of another fall. Instead, firm break of 0.9660 resistance will be an important sign of medium term bullish trend reversal.
Most Markets Start Week With Rangebound Technical Trading
Markets
Most markets started the week with rangebound technical trading after last week’s up-tick in global yields. Eco data were confined to further declining confidence of the Association of US home builders (NAHB) (32 from 34). The index nears the lows of end 2022/April 2020. The NAHB chief economist argued in favor of lower Fed interest rates, a call that might resonate among US politicians, including US president Trump. The direct impact on trading was limited. The latter also applied to the high level talks at the White House between US president Trump, Ukrainian president Zelenskyy and a long chorus of EU leaders. The US president supports a direct meeting between Zelenskyy and Putin and committed to “co-ordinate” security guarantees for Ukraine that mainly will have to be provided by Europe. Even as the parties involved assessed the outcome of the meeting as a good step on the way to a solution, the outcome wasn’t specific enough to have a big market impact, especially as the reaction of Russia remains unclear. At the end of the day, US yields added 1-2 bps across the curve. German yields early in the session corrected after Friday’s jump higher (especially at the long end of the curve), but changes were rather modest at the close (between -1.2 bps for 2-y and -2.5 bps for 10-y). Lingering/underlying pressure at the long end of the curve was mainly visible in UK gilts. At 5.6%, the UK 30-y yield is nearing the highest levels since 1998! Interest rate movements nor the White House talks on Ukraine were able to provide clear guidance for equity trading. US indices closed almost unchanged. The Eurostoxx 50 lost marginally (-0.26%). The dollar slightly outperformed, but within recent (narrow) ranges (close DXY 98.16, EUR/USD 1.1661, USD/JPY 147.9). Rising LT UK yields (risk premium) didn’t help sterling. At EUR/GBP 0.8636, the pair stayed away from the 0.86 support tested last week.
Asian (equity) markets show no clear trend this morning, with mostly limited moves. A 20-y Japanese government bond auction showed mediocre buying interest, at best. Japanese yields in the 10-30-y sector add 2-3 bps, with multi-year peak levels still within reach. Later today, the eco calendar is extremely thin. European markets will keep an eye at further developments regarding the war in Ukraine. Fed Chair Powells’ speech at Jackson Hole on Friday remains the key reference for trading. In the meantime we continue to keep a close look at the very long end of the yield curves. Will LT risk premia at some point become a source of global market uncertainty/volatility?
News & Views
Rating agency S&P affirmed the US’s AA+ rating while keeping the outlook stable. The decision comes after congressional approval of the One Big Beautiful Bill (tax & spending). The stable outlook indicates that although fiscal deficit outcomes won’t meaningfully improve, S&P doesn’t project a persistent deterioration over the next several years. This incorporates a view that changes underway in domestic and international policies won't weigh on the resilience and diversity of the US economy. And, in turn, broad revenue buoyancy, including robust tariff income, will offset any fiscal slippage from tax cuts and spending increases. Other factors supporting the stable outlook are effective monetary policy execution and the $5tn increase in the debt ceiling. In a downside scenario, S&P could still opt lot lower the US credit rating over the next two to three years if already high deficits increase or if political developments weigh on the strength of American institutions (eg Fed), jeopardizing the dollar’s status as the world’s leading reserve currency.
Australian consumer sentiment, measured by the Westpac-Melbourne Institute, posted a solid gain in August, rising 5.7% to 98.5, from 93.1 in June. Data suggest that the second longest stretch of continuous pessimism (<100; 42 months) may finally be coming to an end. The latest improvement follows a further easing in interest rates and more positive tone from the RBA. All 5 components of the consumer sentiment index posted gains in August. Consumers appear much less anxious about their finances, there is also some tentative optimism about the Australian economy, the RBA’s August rate cut has reinforced expectations for further interest rates declines, consumers remain relatively secure about the outlook for jobs and the central bank’s policy gave a substantial boost to housing-related sentiment.
Oil Back Under Pressure
All eyes were on Washington yesterday, where Zelensky finally hit it off with the US President, raising hopes that peace could be on the horizon. The next step is to bring Putin to the negotiating table and find a durable solution. Peace has rarely felt so close. Crude oil opened lower this week after the first Trump–Putin meeting went smoothly, then rebounded ahead of the Trump–Zelensky summit on news of fresh Russian and Ukrainian attacks — including a strike on a Russian oil pipeline system. This morning, oil is back under pressure, trading below $63bp, as optimism for a lasting truce builds.
Beyond Ukraine, oil appetite is muted. Ample supply, a cloudy demand outlook, and the energy transition have kept bulls on the sidelines. CFTC data shows net long positions in crude at multi-year lows — levels not seen in at least ten years. The bigger question is: what price level balances production economics, and could Trump’s rollback of climate rules and push for traditional industries put a floor under the decarbonization trend? Time will tell. In the short run, most of the Ukraine optimism looks priced in, reducing downside potential, while any disappointment could spark a sharp rebound. If talks progress, oil prices may settle near $60pb. Soft oil prices weighed on energy stocks yesterday, while the rest of the S&P 500 drifted as traders stayed cautious ahead of the Trump–Zelensky summit.
The major corporate headline was Intel, which fell up to 5% on reports that the US government is considering taking a 10% stake by converting Chips Act subsidies into equity. That would make Washington Intel’s largest shareholder. What could go wrong? MP Materials nearly tripled after a similar announcement back in July, but the cases differ. MP, a rare-earth miner, is strategically aligned with US efforts to counter China. Intel, by contrast, has resisted ramping production without demand certainty. Misaligned political and economic objectives could end up destroying shareholder value.
European stocks closed lower on Monday, while this morning brings a mixed picture: European indices point to slight gains, while US futures tilt lower. The US 2-year yield is edging higher but remains below 3.80% ahead of Wednesday’s FOMC minutes and Powell’s Jackson Hole speech on Friday. Markets want clarity on whether Powell leans more on slowing jobs data or tariff-led inflation risks.
For now, a 25bp cut looks like the most plausible Fed scenario — a middle ground that keeps the door open for further easing without sparking a market backlash. That’s likely what Powell will signal, but with much of it priced in already, equities may need a new catalyst. Remember, August through October is seasonally soft, and rising long-term yields could tempt investors to pocket recent gains.
On earnings, three major US retailers will report Q2 results this week. Their guidance will be a fresh gauge of consumer resilience amid tariff pressures. Friday’s data showed weaker sentiment and higher inflation expectations, keeping the spotlight on who ultimately bears the tariff cost: companies, consumers, or both. Each scenario carries risks — from squeezed margins to higher inflation and borrowing costs. If companies eat the tariffs, they should see their profits get squeezed and that’s bad news for valuations. If consumers eat the tariffs, that’s also bad news for valuations because it would boost inflation and lead to a more conservative Federal Reserve (Fed) policy and higher-than-otherwise borrowing costs. If however businesses raise prices but sales volumes decline, we have a mixed picture. Companies with strong pricing power would be the winners and others would feel the heat. For investors, of course, the best outcome is to see consumers pressured enough to justify a supportive Fed policy, but not too much pressured to keep profit outlook afloat. That’s a fine balance. Note that, in terms of valuation, the S&P500 is now trading at more than 3.2x its sales – the highest price-to-sales ratio of its history. The higher it climbs, the greater the correction risk.
Steady as She Goes
In focus today
Market focus will continue to be on the Russia-Ukraine conflict and the ongoing efforts to achieve a ceasefire.
Today is quiet in terms of data releases. However, in New Zealand, both markets and analysts anticipate the Reserve Bank (RBNZ) will continue its easing cycle with a 25bp rate cut early tomorrow morning, lowering the Official Cash Rate to 3.00%.
Economic and market news
What happened yesterday
In the US, President Trump met with Ukrainian President Zelenskiy in the White House discussing the war in Ukraine. Trump made multiple mentions of security guarantees and a possible trilateral meeting with Russian President Putin. However, following the meeting the Kremlin has yet to accept the proposal of a trilateral meeting. Nato secretary Mark Rutte told media that the details of the security guarantees would be worked on over the coming days. The friendly tone of the meeting was in stark contrast to the last meeting in February that ended with Zelenskiy leaving the White House following the collapse of diplomatic talks.
In Japan, pressure on the long end of the yield curve continues as a new 20Y auction saw weak demand. The lack of demand for ultra-long bonds has become a market theme across regions, as the prospect of a significant increase in supply is leading to cautiousness among investors. Yesterday, we published an updated set of rates forecasts in our monthly 'Yield Outlook' publication. Overall, we stick with our previous view that especially long-end US rates are bound to move higher as the fiscal outlook bodes higher term premia going forward. See Yield Outlook - Optimism about Europe is broadening, 18 August.
In the UK, focus among investors is on the fiscal outlook as the government prepares a new budget. Yesterday, reports surfaced that UK Chancellor Reeves is considering replacing stamp duty with a new national property tax on homes above GBP 500k in an effort to increase government revenue, putting focus on the unsustainable public finances and the lack of political willingness to consolidate them.
Equities: Equity markets were essentially flat yesterday for the third consecutive session, underlining the current environment of very limited moves and remarkably low volatility across asset classes. This stands in sharp contrast to the prevailing backdrop of elevated political uncertainty, including ongoing discussions around potential ceasefire and peace negotiations in the Russia-Ukraine conflict. The lack of impact on financial markets is notable. With few macro data releases to guide sentiment, muted price action was hardly surprising.
From a European perspective, the healthcare sector once again stood out with strong outperformance yesterday, driven by company-specific news flow. This contrasts with the US, where healthcare failed to replicate the sector strength seen last week, when performance had been more top-down driven. In the US yesterday, Dow -0.1%, S&P 500 -0.01%, Nasdaq +0.03%, Russell 2000 +0.4%. This morning, Asian markets are mixed. US futures are marginally lower, while European futures point slightly higher.
FI and FX: A quiet start to the week with no major news resulted in a calm market session yesterday. Risk sentiment was slightly negative across equity markets, while EUR credit spreads saw renewed tightening. EUR rates fell marginally, reversing only a small part of last week's increase, while US rates ended slightly higher. GILTS faced pressure due to renewed focus on strained UK public finances and limited political appetite for consolidation. Despite this, EUR/GBP remained steady at 0.8635. EUR/USD drifted lower throughout the session, ending 0.4% down at 1.165. Asian equities are mixed this morning, with US equity futures pointing slightly lower. Brent is trading 1% higher at USD 66.25/bbl.