Sample Category Title
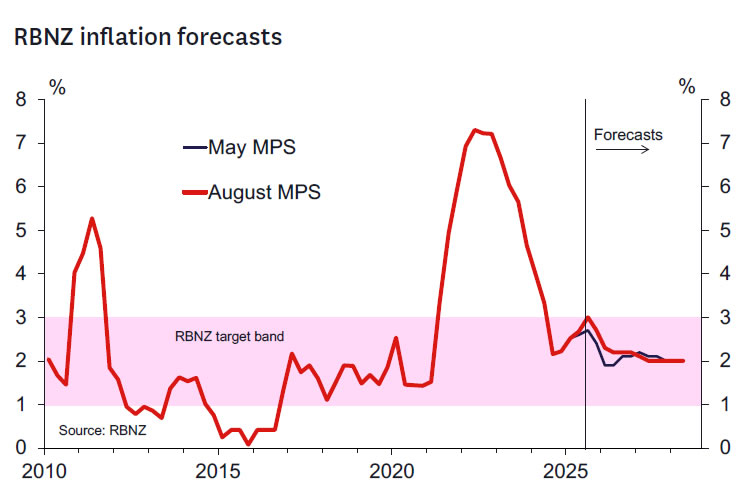
RBNZ: A Big Change in Strategy – Time for Stimulation
- The RBNZ reduced the OCR by 25bps to 3.00% as expected.
- But the forward guidance was very dovish – 1.5 cuts by year end are projected.
- The decision was reached following a 4 – 2 vote on the options of a 25bp vs 50bp cut – emphasising the significant shift in strategy.
- The RBNZ unexpectedly made large cuts to the near-term growth view – 1.6% growth is now expected in 2025, some way south of our own 2.4% estimate.
- The Governor said there was comfort around the midpoint of the new forecasts but more of a deviation of views around the balance of risks.
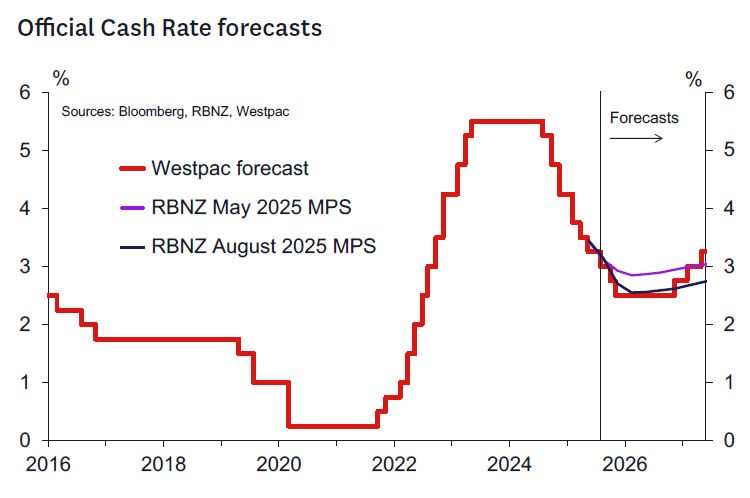
- Westpac expects two further 25bp cuts this year and the OCR to trough at 2.5% from there.
- We retain the view that interest rates will rise from at least the end of 2026 – we will review the timing further in coming months.
Key messages from the RBNZ today.
As was widely expected and almost fully priced by the market, today the RBNZ announced a further 25bps reduction in the OCR to 3.0%. However, in a dovish surprise to the market, two of the six committee members voted for a 50bps cut, and the revised projections lowered the terminal rate by 30bps to 2.55% (versus 2.85% in their previous forecasts).
The following are the key take-outs from the record of meeting:
- The OCR forecast of 2.71% for the December quarter implies at least one cut in the OCR at the next meeting in October, with around a 50% chance of a follow-up cut at the November meeting.
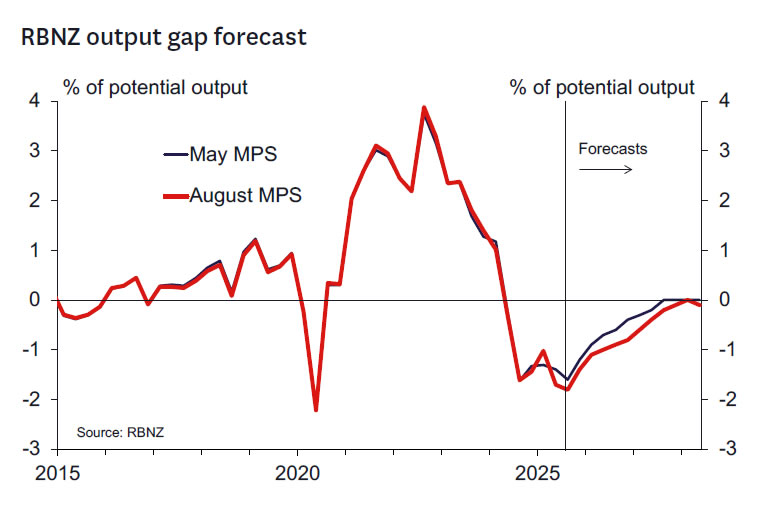
- The RBNZ estimates that economic activity contracted 0.3% in the June quarter and expects that growth will remain subdued in the September quarter (forecast: +0.3% qtr). The resulting output gap is more negative in the near term than forecast in May, despite the positive growth surprise in Q1.
- While the impact of uncertainty about the impact of global conditions is expected to be a little less persistent than previously assumed, this is still expected to be a drag on business investment and household spending.
- Some members expressed concern with the speed of monetary policy transmission, with the record noting that: “Some members also drew attention to slow growth in parts of the economy that are most sensitive to interest rates. Residential construction, house prices, and retail activity have not materially recovered, despite monetary easing to date”.
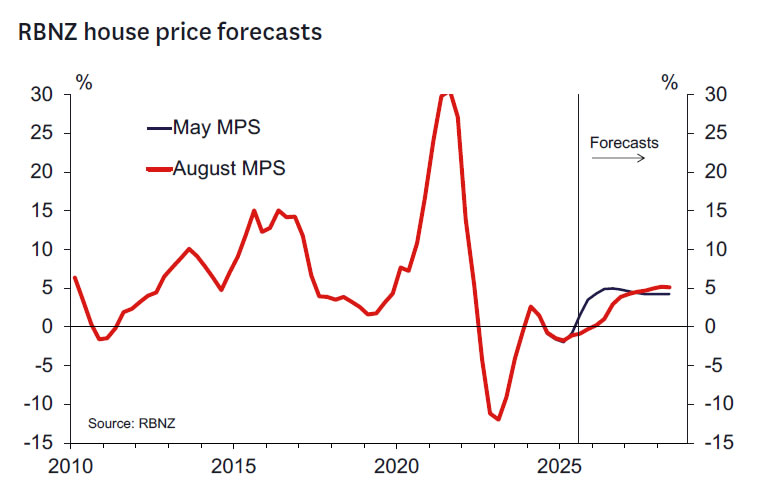
- The RBNZ significantly revised down its forecast for house price inflation and noted that: “Ongoing weakness in the housing market is contributing to subdued residential construction and household consumption.”
- Recent weakness in the labour market also appears to have been factored in: “The Committee discussed constraints on household wealth and discretionary income. Employment and hours worked have declined, and wage inflation has slowed sharply over the last year.”
- The RBNZ acknowledged the support provided by high export commodity prices: “High commodity export prices are supporting activity in the agricultural sector, resulting in stronger spending in rural areas. However, to date, many agricultural businesses have used higher export revenues to pay down debt, limiting the passthrough to consumption and investment.”
- Regarding inflation, the record notes: “On a quarterly basis, non-tradables inflation excluding central and local government charges is consistent with inflation at or below the target mid-point. Some members suggested that this may represent a downside risk to medium-term inflation.”
- With respect to the global environment, the RBNZ notes that: “Some members emphasised the fact that some measures of uncertainty have improved considerably since May and noted a possibility that the domestic economy recovers more rapidly as the effects of uncertainty dissipate. Other members highlighted that excess supply in China and some parts of emerging Asia has the potential to lower tradable inflation in New Zealand over the medium term.”
- The risk distribution around the baseline forecast is viewed as balanced: “Some members considered the balance of risk [to the OCR] to be to the upside relative to the projected path, while others considered the balance of risk to be to the downside.”
Westpac’s view on the policy outlook.
The RBNZ seems set on taking the OCR significantly lower and the bar for a pause in the meetings before Christmas seems high. The RBNZ would have expected that presenting such a low OCR forward track would lead markets to conclude cuts in October and November were likely, and we certainly take on board that message.
This is an occasion where the data doesn’t really tell the story. What we have here is a change in strategy where the RBNZ is choosing to look through the CPI inflation outlook for the next six months and instead take action to underwrite an improvement in growth. The RBNZ likely won’t move away from this insurance strategy until totally comfortable that the economy is on track to grow at rates that will eliminate the current spare capacity.
The story seems to be one where there are concerns that the output gap will be much more negative in the second half of 2025 and take longer to close. This is being driven by a combination of economic uncertainty (mentions of uncertainty have not declined in the August Statement relative to May) and, in the eyes of some MPC members, the idea that interest rates are not having the leverage expected. The weaker housing market profile is part of that picture.
We likely won’t see evidence of any decisive bounce in growth towards trend in the Q2 GDP data, which is due in September – although we expect to see a bounce in some of the more sentiment driven-indicators (business confidence, PMIs, perhaps the housing market) in the next few months.
Our forecasts for CPI inflation are notably higher than the RBNZ’s for the next six months. We see the September quarter CPI at 1.1% vs the RBNZ’s 0.9%, and we expect inflation over calendar 2025 will print at 3.1% vs the RBNZ’s forecast for 2.7%. But the RBNZ doesn’t seem to be very focused on that. Some MPC members advocating a less dovish approach noted risks to inflation expectations. But while we will see little information on that before October, there will be more in November. We think this is a big risk to the MPC’s strategy and could be relevant for the November Statement.
We noted in our recent Hawks and Doves note that historically the OCR has moved 50-125bp below neutral in a non-crisis cycle. The OCR at 2.5% would bring the OCR into that range based on the RBNZ’s estimates (these still range between 2.9-3.5%). Policy will be clearly stimulative on our own estimate of a 3.75% neutral OCR.
It’s prudent to assume a 25bp cut in October. Another cut in November also seems more likely than not. But there is a lot more water to go under the bridge between now and November. The RBNZ has clearly signalled they will be data dependent.
Key data and events before the RBNZ’s October meeting.
Looking ahead to the RBNZ’s next policy review on 8 October, the key domestic data and events will be:
- The August Selected Price Indexes (16 September): This will provide further insight regarding the likely outcome of the Q3 CPI report, which will not be released until 20 October. • The Q2 GDP report (18 September): The outcome of this report will be compared to the RBNZ’s estimate, with any deviation having implications for the RBNZ’s estimate of the output gap and perhaps also its view on near-term growth momentum.
- The Q3 QSBO survey (7 October): The focus in this report will be on indicators of Q3 activity, capacity use and direct measures of cost/selling price pressures.
In addition to the above, key monthly activity indicators such as the BusinessNZ manufacturing and services indexes (mid-September) and the ANZ business and consumer confidence surveys (late August and late September) will also be of interest, as will the monthly retail spending and housing market reports (mid- September). Indicators relating to the labour market will likely be tracked especially closely. Should it occur, a lift in filled jobs and job advertising would provide some reassurance that the recovery is becoming selfsustaining. Inflation expectations measures from the ANZ’s business and consumer surveys will also be monitored see whether their recent lift has endured.
Outside of New Zealand, interest will clearly centre on any clarity that emerges regarding the final form of US tariff policy and its implications for growth in New Zealand’s major trading partners, the outlook for key export commodity prices and the prices of goods imported into New Zealand. Decisions taken by the US Federal Reserve will also be of importance to the extent that they impact financial conditions in New Zealand, including the behaviour of the exchange rate.
Finally, it is also worth noting that there will likely be a new external member of the MPC in place at the October OCR review (replacing Professor Bob Buckle, whose term ended with the August meeting). It is also possible that we may have a new RBNZ Governor in place, although it seems more likely that this will happen between the October and November meetings. New personnel with potentially different perspectives and judgments mean that the policy outlook could shift even if the data flow falls in line with the projections in the August MPS.
Gold at a Pivotal Level – Can Momentum Flip Higher Now?
Key Highlights
- Gold corrected gains after it failed to clear the $3,400 resistance.
- A major bearish trend line is forming with resistance at $3,345 on the 4-hour chart.
- WTI Crude Oil prices declined below the $63.20 support zone.
- EUR/USD is consolidating above the 1.1600 support zone.
Gold Price Technical Analysis
Gold prices failed to settle above $3,400 and corrected gains against the US Dollar. It declined below the $3,375 and $3,360 support levels.
The 4-hour chart of XAU/USD indicates that the price settled below the $3,350 level, the 100 Simple Moving Average (red, 4 hours), and the 200 Simple Moving Average (green, 4 hours). There was a move below the 50% Fib retracement level of the upward move from the $3,268 swing low to the $3,408 high.
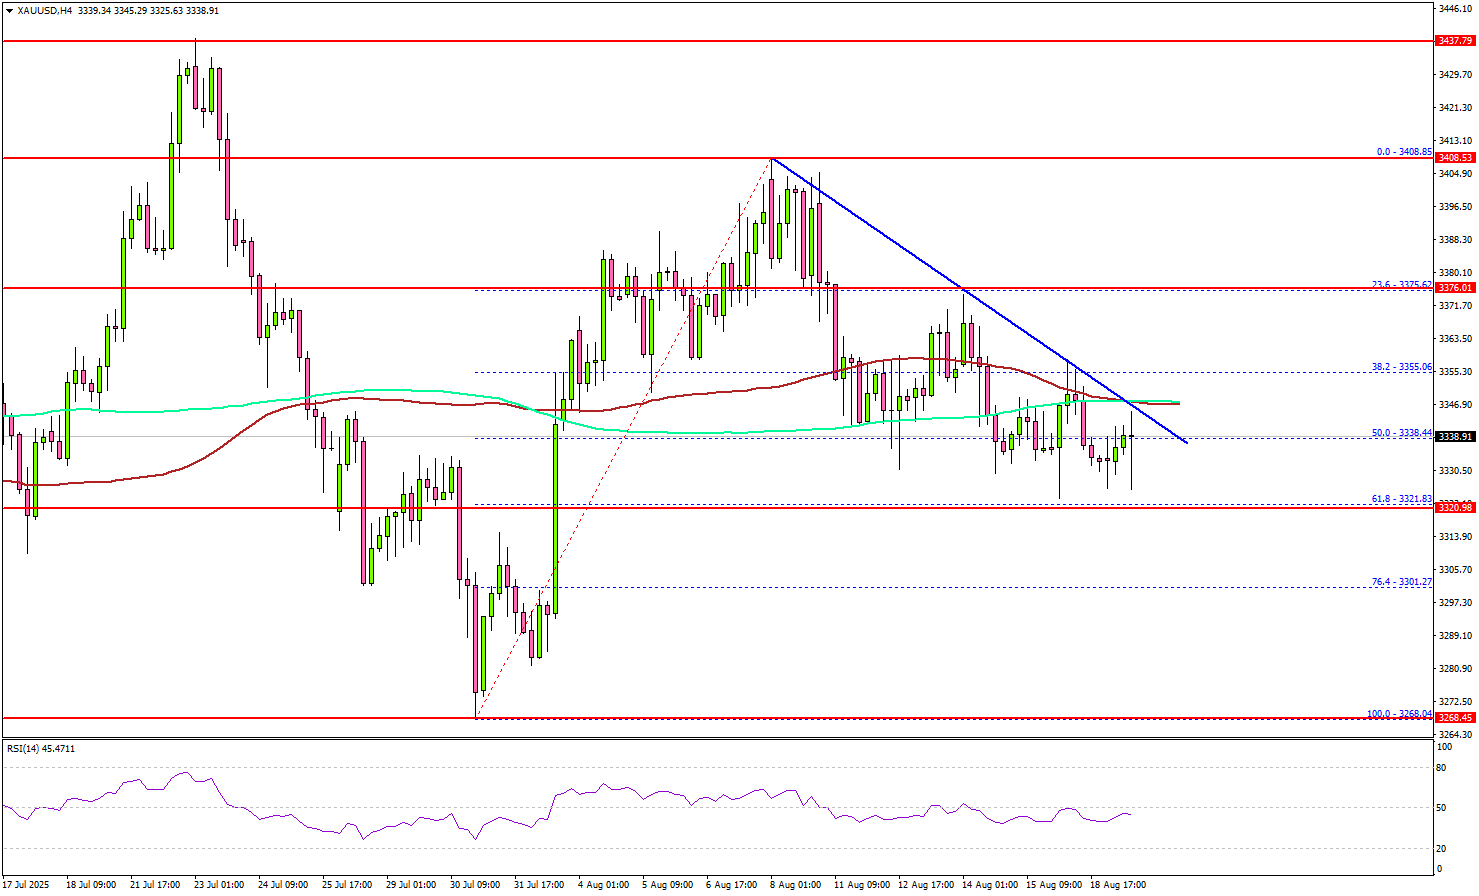
On the downside, initial support is near the $3,320 level. It is close to the 61.8% Fib retracement level of the upward move from the $3,268 swing low to the $3,408 high.
The first key support is $3,310. The next major support is near the $3,300 level. A downside break below $3,300 might call for more downsides. The next key zone to watch could be $3,280.
On the upside, immediate resistance is near the $3,345 level. There is also a major bearish trend line forming with resistance at $3,345 on the same chart. The next major resistance sits near the $3,355 level.
A clear move above $3,355 could open the doors for more upside. In the stated case, the bulls could aim for a move toward $3,400, above which the price could rally toward the milestone level of $3,450.
Looking at WTI Crude Oil, the price shows many bearish signs and could decline further below the $62.00 support zone.
Economic Releases to Watch Today
- Fed's Waller speech.
- FOMC Minutes.
- Fed's Bostic speech.
RBNZ cuts, opens door to more, NZD/USD diving towards 0.58
RBNZ delivered a 25bps cut to the Official Cash Rate, lowering it to 3.00% as widely expected. A more sizeable 50bps rate cut was discussed during the meeting. Policymakers maintained an easing bias, noting that “if medium-term inflation pressures continue to ease as expected, there is scope to lower the OCR further.”
The new projections point to the OCR dropping to 2.7% by Q4 2025, then settling between 2.5% and 2.6% in 2026 before edging back toward 2.7–2.8% in 2027. This outlook effectively signals room for one additional cut this year and another in early 2026.
The Bank highlighted ongoing slack in the economy and easing domestic inflation, projecting headline inflation to return to the 2% midpoint of target by mid-2026. However, New Zealand’s recovery has stalled, with household and business spending constrained by global policy uncertainty, weaker employment, higher costs for essentials, and falling house prices.
NZD/USD dives through 0.5855 support after the announcement to resume the decline from 0.6119. Next target is 50% retracement of 0.5484 to 0.6119 at 0.5802. As the decline is currently seen as a corrective move, there might be some support form 0.5802 to bring rebound. However, firm break of 0.5906 support turned resistance is needed to indicate short term bottoming. Otherwise, risk will stay on the downside in case of recovery.

Also, decisive break of 0.5802, coupled with downside acceleration through the near term falling channel, will suggest that NZD/USD is indeed reversing the whole rise from 0.5484. That could pave the way through 61.8% retracement of 0.5727 to wards 0.5484 low.

(RBNZ) OCR lowered to 3%
Media release
Annual consumers price index inflation is currently around the top of the Monetary Policy Committee’s 1 to 3 percent target band. However, with spare capacity in the economy and declining domestic inflation pressure, headline inflation is expected to return to around the 2 percent target midpoint by mid-2026.
New Zealand’s economic recovery stalled in the second quarter of this year. Spending by households and businesses has been constrained by global economic policy uncertainty, falling employment, higher prices for some essentials, and declining house prices.
There are upside and downside risks to the economic outlook. Cautious behaviour by households and businesses could further dampen economic growth. Alternatively, the economic recovery could accelerate as the full effects of interest rate reductions flow through the economy.
The Monetary Policy Committee today voted to decrease the Official Cash Rate (OCR) by 25 basis points to 3 percent. Further data on the speed of New Zealand’s economic recovery will influence the future path of the OCR. If medium-term inflation pressures continue to ease as expected, there is scope to lower the OCR further.
Summary record of meeting – August 2025
Annual consumers price index inflation remains within the Monetary Policy Committee’s 1 to 3 percent target band. Recent increases in food prices and administered prices have contributed to near-term inflationary pressure. However, domestic activity has been subdued and there remains significant spare productive capacity in the economy. Headline inflation is expected to return to around the 2 percent target mid-point by mid-2026. If medium-term inflation pressures continue to ease as expected, there is scope to lower the OCR further.
Annual CPI inflation remains within the target band
Annual consumers price index (CPI) inflation increased to 2.7 percent in the June 2025 quarter. Headline inflation is expected to reach to 3.0 percent in the September 2025 quarter, reflecting large increases in administered prices, food prices, and the prices of other tradable goods and services.
Surveyed measures of medium-term inflation expectations remain near 2 percent, consistent with the mid-point of the target band. Non-tradables inflation has continued to decline in aggregate. Measures of core inflation have declined and are within the target band. Headline inflation is expected to converge to the mid-point of the target range over the next year as tradables inflation pressures dissipate and significant spare capacity continues to reduce domestic price pressures.
Near-term inflation expectations have increased, particularly for households. Household inflation expectations have risen across several advanced economies and may be influenced by global factors such as increased trade restrictions, as well as relatively large increases in some prices such as those for food and energy.
Tariffs and economic policy uncertainty are dampening the global economic outlook
Evidence to date suggests that the global economy is responding broadly as expected to trade restrictions and policy uncertainty. Growth in some of our trading partners, particularly China, was higher than expected in the second quarter of 2025 but is expected to moderate in the coming quarters. Headline inflation has increased moderately in some advanced economies but is declining in most of our Asian trading partners.
Tariffs are causing changes to global trading patterns but have so far had a limited effect on aggregate global trade volumes. To date, there is no evidence of major disruption to global supply chains, or a material impact on the prices of New Zealand’s imports or exports. The Committee noted that it continues to expect that the increase in global trade restrictions will result in less inflationary pressure in the New Zealand economy.
The effective tariff rate on New Zealand exports to the United States is higher than anticipated at the time of the May Statement. Some firms and industries may experience more challenging export conditions as a result. The medium-term implications for New Zealand will depend on how global demand responds to increased trade restrictions and economic policy uncertainty.
Economic growth in New Zealand is expected to recover gradually
High-frequency indicators suggest that the New Zealand economy contracted in the second quarter of 2025 and was weaker than expected at the time of the May Statement. Growth is expected to resume in the September quarter, consistent with a recovery in some economic indicators for July. A key judgement for the Committee’s economic assessment was the extent to which spare capacity in the New Zealand economy is likely to persist.
The Committee discussed constraints on household wealth and discretionary income. Employment and hours worked have declined, and wage inflation has slowed sharply over the last year. Household dissaving since the start of 2022 has reduced savings buffers. At the same time, inflation in some essential expenditure components such as food, gas, electricity, and council rates has been much higher than the general rate of inflation. These factors were noted as likely to contribute to a slower recovery in domestic spending than would otherwise be the case.
House prices have declined to a level within the Reserve Bank’s range of sustainable house price estimates. Housing is a key component of household wealth, which influences household spending. Ongoing weakness in the housing market is contributing to subdued residential construction and household consumption.
The Committee discussed the fiscal outlook. Declining government spending as a share of the economy is expected to reduce inflationary pressure in the medium term. This is consistent with the economic and fiscal projections published in the Budget Economic and Fiscal Update 2025.
The Committee acknowledged regional and sectoral divergences in economic activity. House price growth has varied considerably across regions. High commodity export prices are supporting activity in the agricultural sector, resulting in stronger spending in rural areas. However, to date, many agricultural businesses have used higher export revenues to pay down debt, limiting the pass-through to consumption and investment.
There is significant spare capacity in the New Zealand economy
A broad range of indicators suggest that significant spare capacity in the New Zealand economy persists. Unemployment has increased, as have measures of labour underutilisation, and firms are reporting that it is relatively easy to find labour. Firms are also reporting low levels of capacity utilisation. The Committee noted that while credit is generally available, growth in business lending has been slow.
The Committee discussed slow growth in the productive capacity of New Zealand’s economy. Potential output growth has slowed, reflecting subdued investment, low productivity growth, and historically low population growth through net immigration. The Committee noted that appropriate monetary policy settings would support sustainable long-run investment and growth.
Monetary policy continues to transmit through the financial system
The Committee noted that wholesale interest rates have fallen since the May Statement, resulting in lower mortgage and term deposit rates, particularly at shorter terms. The average interest rate on the stock of mortgages is expected to continue to decline over the coming year, as about half of existing mortgages are expected to re-fix onto lower rates over the next six months. This will reduce debt servicing costs for households as past reductions in the OCR continue to transmit through the financial system.
Long-term bond yields have increased internationally over the first half of the year, with higher term premia reflecting geoeconomic uncertainty and elevated debt levels. Despite subdued domestic activity, the New Zealand dollar TWI has been relatively stable through this period, in part due to policy developments and declining short-term interest rate expectations in the United States. Equity prices in the United States have been elevated, but this has largely been attributable to the out-performance of a few large technology firms.
The financial system remains stable
The Committee was briefed on financial system stability. Subdued demand and low profitability are contributing to financial stress for some businesses. Non-performing loans for households and businesses have increased but remain low relative to previous cycle peaks. Increased provisions and strong capital buffers mean that banks are well-prepared to absorb any losses. The Committee noted that monetary policy settings that support growth in the economy will also contribute to financial stability.
There are upside and downside risks to the economic outlook
The Committee expects headline inflation to remain within the target band over the forecast horizon. However, with inflation projected to increase to 3.0 percent in the September quarter, there is a material possibility that it rises above the target band. The period in which this is most likely to occur is too soon for monetary policy to have any meaningful effect. However, if inflation were to remain higher for longer than expected, there is a risk that this influences inflation expectations and wage- and price-setting behaviour over the medium term.
The Committee noted that increases in administered prices, such as local council rates and some energy charges, have contributed to higher-than-otherwise non-tradables inflation. Some members emphasised that these prices represent rising costs for businesses and may spill over to generalised non-tradables inflation, particularly in the near term. Other members emphasised spare capacity and weak demand, which would limit the ability of firms to pass on cost pressures to consumers.
Some members also drew attention to slow growth in parts of the economy that are most sensitive to interest rates. Residential construction, house prices, and retail activity have not materially recovered, despite monetary easing to date. On a quarterly basis, non-tradables inflation excluding central and local government charges is consistent with inflation at or below the target mid-point. Some members suggested that this may represent a downside risk to medium-term inflation. Other members emphasised that previous reductions in the OCR continue to transmit through the financial system and will take time to have their full effect on activity and inflation. Growth in interest-rate-sensitive sectors of the economy is projected to recover over the remainder of this year.
The Committee discussed the extent to which uncertainty associated with global trade restrictions is likely to limit domestic demand and inflationary pressure in the medium term. Consumption and investment demand appear to have weakened in the second quarter of 2025, partly in response to heightened trade policy uncertainty. The effects of uncertainty on domestic activity are assumed to persist over the remainder of the year. Some members emphasised the fact that some measures of uncertainty have improved considerably since May and noted a possibility that the domestic economy recovers more rapidly as the effects of uncertainty dissipate. Other members highlighted that excess supply in China and some parts of emerging Asia has the potential to lower tradable inflation in New Zealand over the medium term.
Some members also emphasised the risk that precautionary behaviour by New Zealand households and businesses may result in a weaker consumption and investment outlook than assumed, particularly in the context of slow growth in household wealth and discretionary incomes and low firm profitability. In this environment, businesses that are uncertain about potential future demand are less willing to invest, which in turn lowers potential growth and could further prolong uncertainty about future incomes and wealth. It is possible that pessimistic sentiment, together with the initial negative effects of the global tariff shock, have dampened the effects of the reduction in the OCR since last August.
The Committee noted limits to the ability of monetary policy to influence expectations of long-term growth. Some members emphasised that near-term support from monetary policy is most effective when combined with regulatory and policy settings that promote innovation and investment to support productivity growth.
The Committee voted to reduce the OCR to 3 percent
The projected path of the OCR reflects the Committee’s central expectation of the path needed to ensure that inflation settles sustainably near the target mid-point. Uncertainty about the future path of the OCR is reflected in the Committee’s discussion of upside and downside risks to the outlook. Some members considered the balance of risk to be to the upside relative to the projected path, while others considered the balance of risk to be to the downside.
The Committee discussed three policy options: keeping the OCR on hold at 3.25 percent; cutting the OCR by 25 basis points to 3 percent; or cutting by 50 basis points to 2.75 percent.
The case for holding the OCR steady at 3.25 percent focused on positive influences on growth. Global economic activity outside of the United States has so far proven resilient in the face of new trade barriers, and global policy uncertainty has reduced from its peaks in April and May. The full extent of recent monetary easing is yet to fully transmit through the economy. Although high-frequency indicators suggest weak economic activity in the June 2025 quarter, available indicators for July suggest some improvement. With inflation approaching the top of the target band, and near-term inflation expectations rising, it could be prudent to pause to observe incoming data. One member gave relatively more weight to this view.
The case for lowering the OCR by 50 basis points to 2.75 percent emphasised declining inflationary pressure and significant spare capacity. Some members put relatively more weight on the risk that the negative consequences of global policy uncertainty on domestic consumption and investment are self-reinforcing and therefore more persistent. A larger reduction in the OCR might disrupt such a dynamic and generate clearer signals that support consumption and investment, whereas a gradual reduction in the OCR might not provide the same positive signalling effect. These members also emphasised that weakness in the labour market and excess capacity limits the upside risk to inflation should the economy recover more quickly than projected.
The case for lowering the OCR by 25 basis points to 3 percent was based on the upside and downside risks around the central projection being broadly balanced. Financial conditions are continuing to respond to past reductions in the OCR. They are also influenced by expectations of the future path of the OCR, which provides sufficient signalling effects. If medium-term inflation pressures continue to ease in line with the Committee’s central projection, the Committee expects to lower the OCR further. Reducing the OCR by 25 basis points at this meeting provides the opportunity to adjust this view incrementally in response to new information.
On Wednesday 20 August, the Committee voted on the options of either reducing the OCR by 25 basis points or reducing the OCR by 50 basis points. By a majority of 4 votes to 2, the Committee agreed to decrease the OCR by 25 basis points to 3 percent.
Attendees:
MPC members: Christian Hawkesby (Chair), Bob Buckle, Paul Conway, Prasanna Gai, Carl Hansen, Karen Silk
Treasury Observer: James Beard
MPC Secretary: Evelyn Truong
Japan exports slump -2.6% yoy in July, U.S. auto shipments hit hard
Japan’s exports fell -2.6% yoy in July to JPY 9.36 trillion, the sharpest drop since February 2021, driven by weaker demand from its two largest markets, the U.S. and China. Exports to the U.S. slid -10.1% yoy, with auto shipments plunging -28.4% yoy, a steeper decline than June’s -26.7%. Shipments to China also contracted -3.5% yoy, though exports to Hong Kong surged nearly 18% yoy.
The latest weakness highlights how external headwinds continue to weigh on Japan’s trade sector. While Tokyo reached a deal with Washington on July 22 to reduce reciprocal tariffs to 15% from 25%, the benefits will not be reflected until the August trade data. For now, auto exports remain a key drag on overall performance.
Imports fell -7.5% yoy to JPY 9.48 trillion, leaving Japan with a JPY 118 billion deficit. In seasonally adjusted terms, exports slipped -0.2% mom, while imports rose 0.4% mom, pushing the deficit wider to JPY 303 billion.
Dollar (DXY) Pauses at 98.00 as Markets Await Clarity – What’s Next?
The morning NA session follows a quasi-dead European overnight trading.
This tends to happen when a lack of data adds to the Summer trading when volumes are typically subdued.
The Dollar Index had been in the middle of many headwinds, as per usual. After a stellar July followed by and N-shaped (for nope) downward spiral in the beginning of August, it has been difficult to spot where the Greenback is heading.
Forex volatility tends to calm during summers and lack of decisive trends exacerbate this rangebound trading – When the path is unclear, rangebound trading is typical (particularly in currencies.)
With Markets awaiting more developments after the White House gathered heads from Russia, Ukraine and the EU, the Dollar is forming a temporary bottom around the 98.00 Handle.
This region had already formed the post-Liberation day bottom (quickly broken in May).
The White House meetings went well and the US will now attempt to create a Putin-Zelenskyy meeting.
Donald Trump, the author of the Art of the Deal, is an unpredictable leader but one sure thing, he is a monster negotiator, and this is giving back some confidence in the US.
In our most recent DXY analysis, we mentioned an expectation of a more balanced Dollar as a lack of continuation upwards and a not-broken bottom show indecision.
Let's see if this indecision shall continue, at least to the technical side.
Dollar Index (DXY) Technical Analysis
Dollar Index Daily Chart
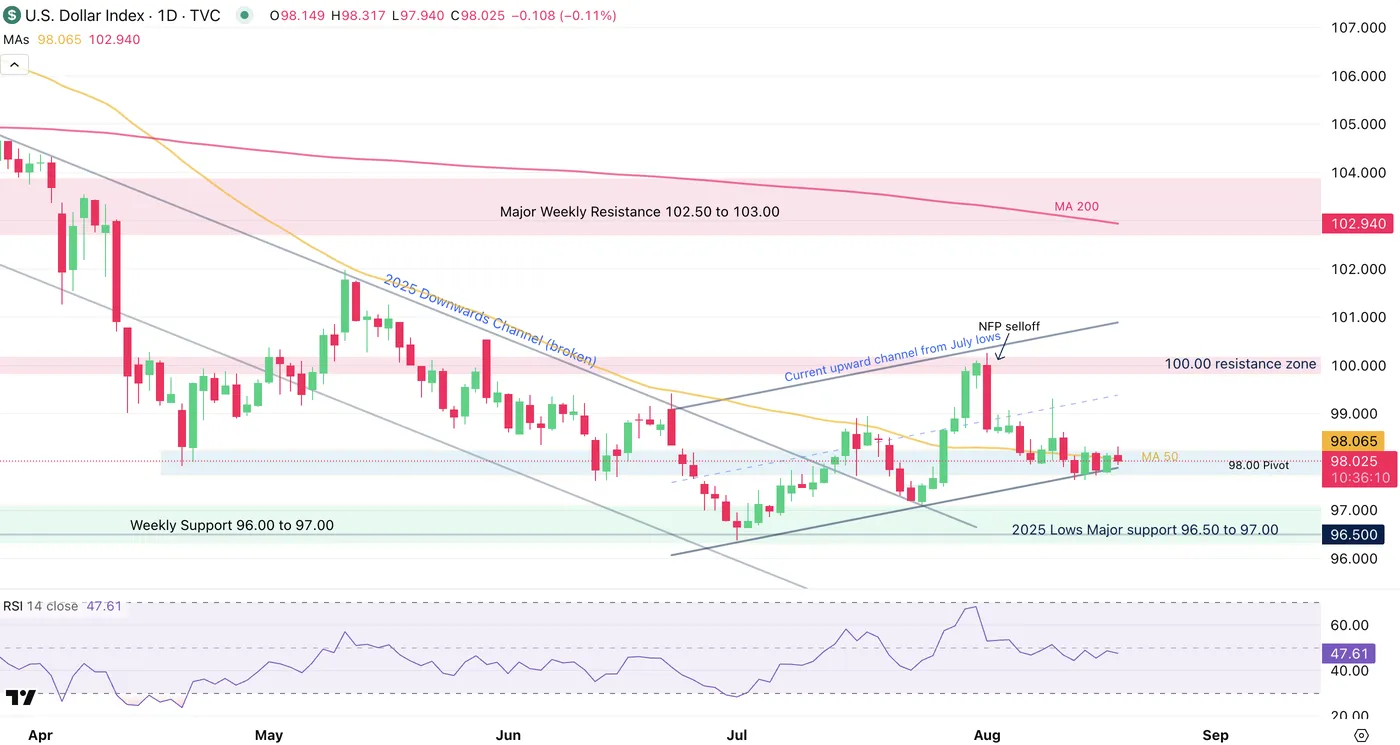
Dollar Index Daily Chart, August 19, 2025 – Source: TradingView
The US Dollar is holding its low-sloped ascending channel in a 5 day consolidation around the 98.00 handle.
The post-CPI data had created a new offer for the US Dollar as Markets rushed to price the September cut to 97% before the surprising PPI data changed the course of action.
With the future US inflation expectations rising considerably, the fundamental background for the Dollar (like its rate outlook) is more uncertain.
The Daily RSI is way into the Neutral territory and the Daily doji is an indecision one. All of this is also happening right around the 50-Day MA (currently at 98.065).
Let's have a closer look to spot what breakout points could be in play when the action picks up again.
Dollar Index 2H Chart
Such indecisive price action doesn’t warrant analysis across many timeframes – it is better in this environment to look at where we see the most.
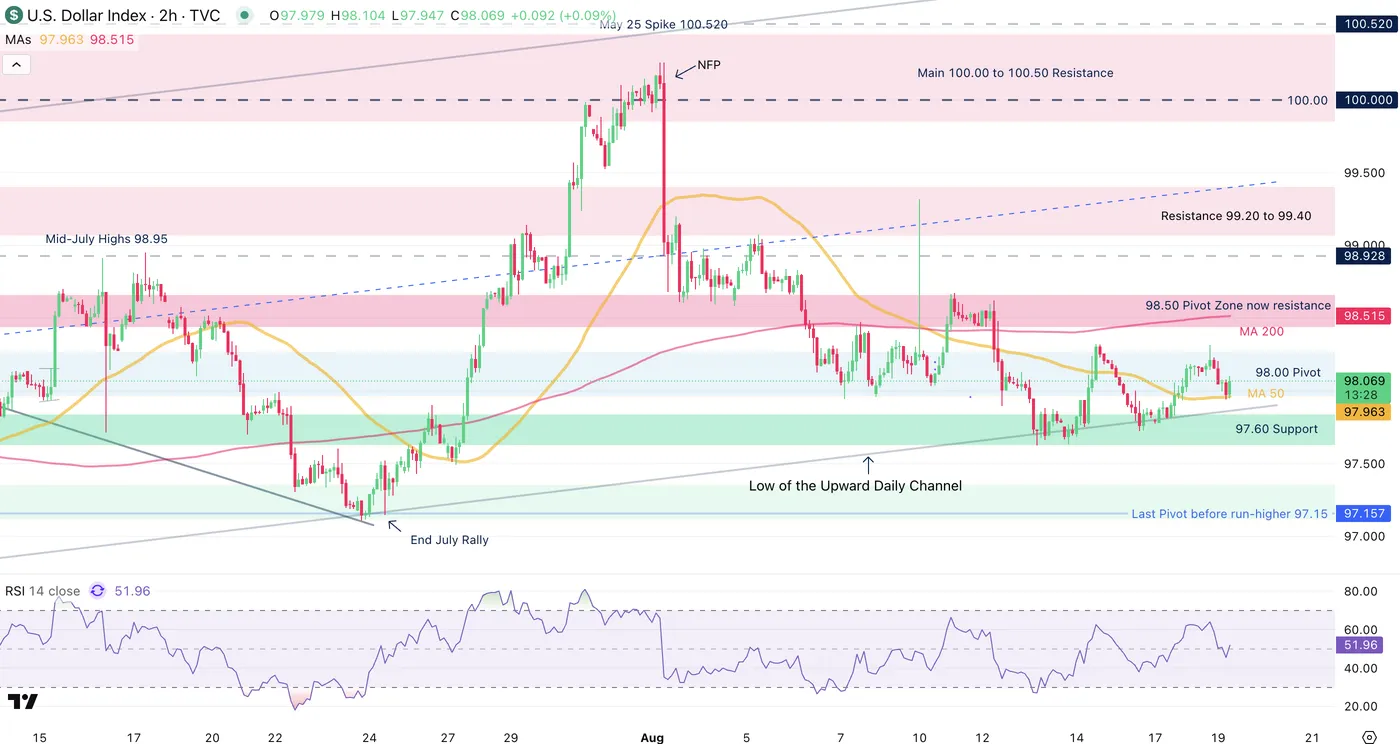
Dollar Index 2H Chart, August 19, 2025 – Source: TradingView
The Dollar Index is stuck between the 97.60 Support and the 98.50 Resistance Zones.
With the Price action rebounding from the lows of the Daily upward Channel supplemented by the 2H MA 50 acting as support, it seems that the preferred path would be to the upside.
If things were so sure however, the Dollar would have risen already to test the following resistance zone.
Typically, in this environment, it is good to look at the highs (98.30) and lows of the session (97.94) to see where if the action breaks out from there.
To the upside, look at the 2H MA 200 currently at 98.515.
To the downside, look at the 97.60 Support Zone, then the 97.15 July upward pivot.
Levels to place on your DXY Charts:
Resistance Levels
- 98.50 Pivot Zone now resistance (confluence with 2H MA 200)
- Resistance 99.20 to 99.40
- Main 100.00 to 100.50 Resistance
Support Levels
- 2H MA 50 (97.94)
- 97.60 Support
- July Pivot before run-higher 97.15
Safe Trades!
Sunset Market Commentary
Markets
This morning’s mediocre Japanese 20-y government bond auction and yesterday’s meeting in the White House on Ukraine were potential drivers for any directional market action today. Quod non. Japanese yields in the 10-y+ sector closed up to 4 bps higher, but the signal this time wasn’t picked up by markets outside the country. US, EMU and UK yields currently are changing less than 2 bps across the curve in a daily perspective. Match null for now as bond investors are cautious to place strong directional bets in the run-up to Fed Chair Powells’ Jackson Hole address on Friday. Still, especially the German (3.34%) and UK 30-y yields (5.60%) are challenging multi-year peak levels. For now, market moves also in this segment of the curve remain orderly, but fiscal sustainability clearly remains a market concern as governments are preparing 2026 budget plans. In the UK, this budgetary exercise is additionally complicated by a near stagflationary context. In this respect, UK Fin Min Reeves for sure also will keep a close eye at the July UK inflation data scheduled for release tomorrow morning as the rising cost of inflation-linked notes is an important variable in UK budget calculations. Sterling traders at least take a cautious approach going into the release. The UK currency is ceding (modest) ground against the single currency, with EUR/GBP trading further off the 0.86 support area (0.8645). On broader FX markets, the dollar mostly trades marginally softer, but with absolutely no technical implications (DXY, 98.1, EUR/USD 1.168, USD/JPY 147.75). Powell apparently also ‘paralyses’ this market. Hope on potential progress regarding the conflict in Ukraine caused a better bid for most CE currencies with the forint outperforming. At EUR/HUF 393.9, the Hungarian currency is touching its best level against the euro since September last year. Gains in the likes of the zloty (EUR/PLN 4.245) and the Czech koruna (EUR/CZK 24.45) are more modest. On equity markets, the Eurostoxx 50 (+0.9%) trades less than 2% below the early March top. In the US, the S&P 500 opens little changed, but (Friday’s) all-time top is also at less than 1%.
News & Views
The International Exchange Inc (ICE) released its Annual Fixed Income Index Rule Review. It again rejected a proposal to add joint EU debt to sovereign bond indices following consultations with stakeholders. The EU is currently categorized as a supranational, which is seen as a reason why its debt is trading at a discount compared with European government bonds with similar rating. ICE said that there is "no development towards consensus" on the inclusion topic since last year with some arguing that the bloc does not meet the “common understanding of sovereign”. MSCI , S&P Global and Bloomberg Index Services have also turned down similar proposals, though it’s possible they will revisit the question. The EU is working on professionalizing the EU bond market given the issuance boom in the wake of the Covid-pandemic. This includes improving liquidity by creating a repo facility and enticing banks for better pricing and efforts to create a futures market. Inclusion in sovereign bond indices would also help creating the appeal of a European safe haven asset comparable to US Treasuries.
Canadian headline inflation accelerate to 0.3% M/M in July with the headline number slowing from 1.9% Y/Y to 1.7% Y/Y, matching the second lowest pace since February 2021. Prices for gasoline led the headline slowdown, falling by 16.1% Y/Y (-0.7% M/M). Excluding energy, CPI stabilized at 2.5% Y/Y, the same pace as in May and June. Shelter price rose by 3% Y/Y (from 2.9%) in a first acceleration since February 2024. Rent prices also accelerated, from 4.7% Y/Y to 5.1% Y/Y. One of the Bank of Canada’s preferred CPI measures, the trimmed mean of core inflation which excludes the most volatile components, stabilized at 3% Y/Y. The Canadian dollar swap curve shows some modest bull steepening in the wake of the figures with front end yields around 2.5 bps lower. The Loonie trades a tad softer at 1.3840. Gains are technically insignificant with first resistance at USD/CAD 1.3879.
EUR/USD Mid-Day Outlook
Daily Pivots: (S1) 1.1639; (P) 1.1678; (R1) 1.1699; More...
Intraday bias in EUR/USD remains neutral and more consolidations could be seen below 1.1729. Further rally is expected as long as 1.1589 support holds. Above 1.1729 will bring retest of 1.1829 high. On the downside, however, firm break of 1.1589 will turn bias to the downside, and extend the corrective pattern from 1.1829 with another fall.
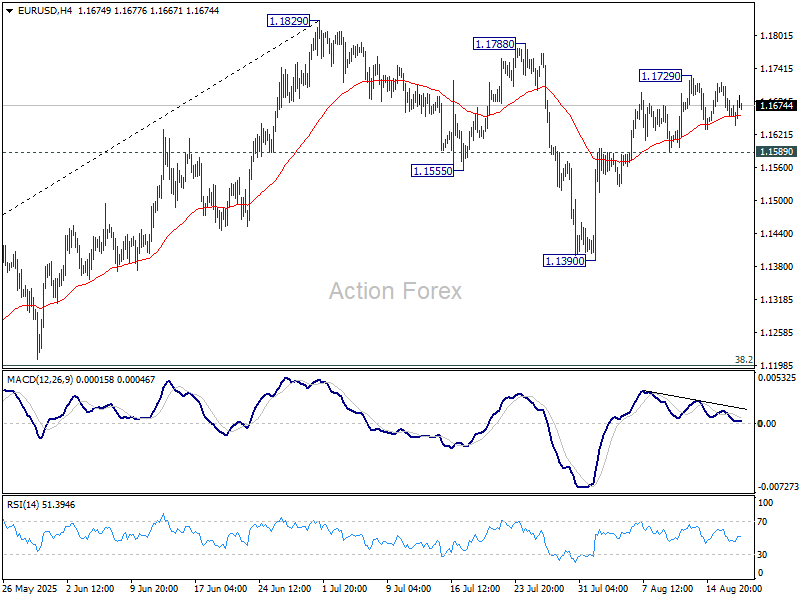
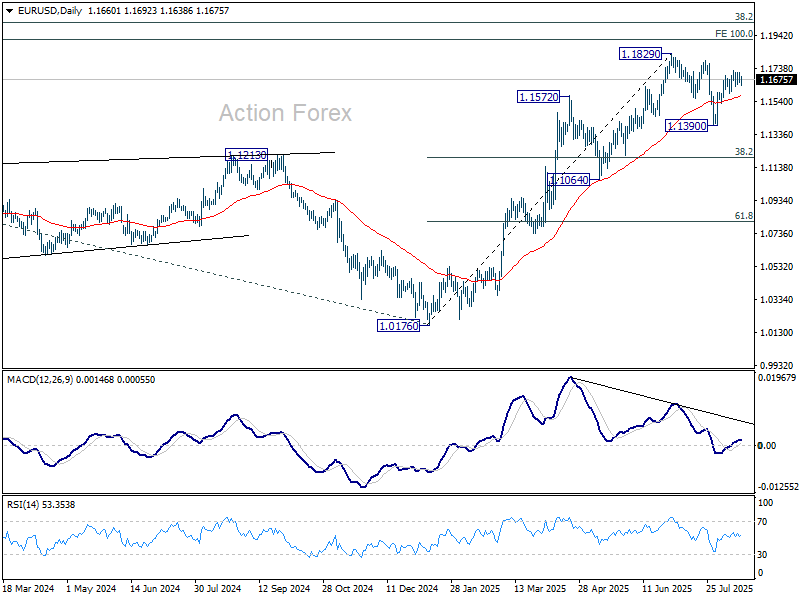
In the bigger picture, rise from 0.9534 long term bottom could be correcting the multi-decade downtrend or the start of a long term up trend. In either case, further rise should be seen to 100% projection of 0.9534 to 1.1274 from 1.0176 at 1.1916. This will remain the favored case as long as 1.1604 support holds.
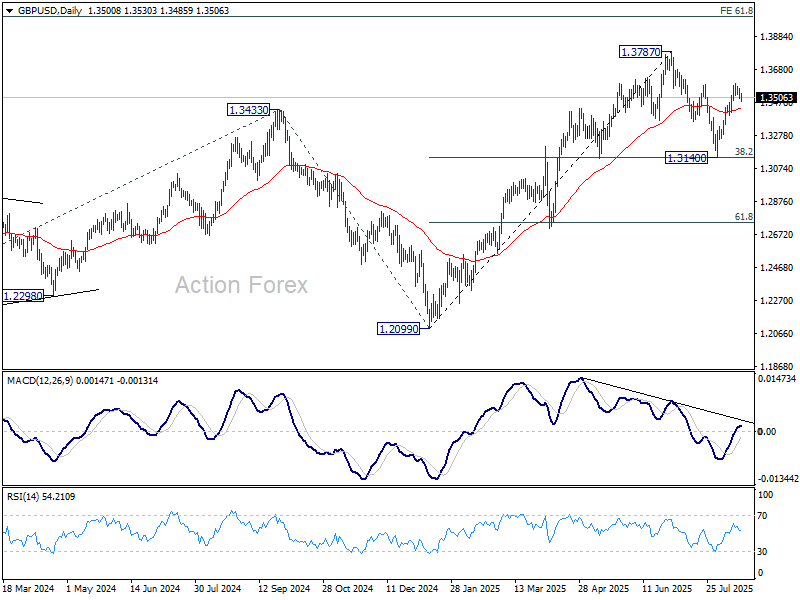
GBP/USD Mid-Day Outlook
Daily Pivots: (S1) 1.3478; (P) 1.3527; (R1) 1.3551; More...
Intraday bias in GBP/USD remains neutral and outlook is unchanged. Retreat from 1.3594 might extend lower but downside should be contained well above 1.3398 support. On the upside, break of 1.3594 will resume the rise from 1.3140 to retest 1.3787 high.
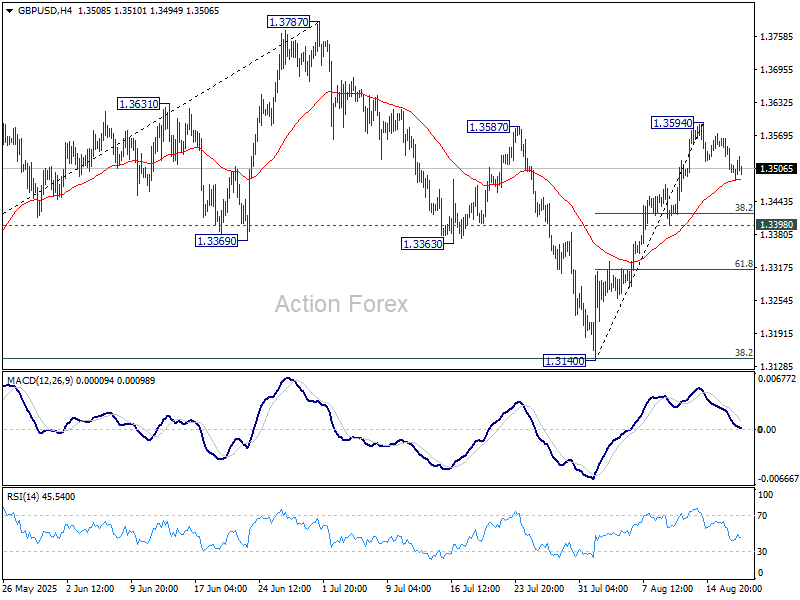
In the bigger picture, up trend from 1.3051 (2022 low) is in progress. Next medium term target is 61.8% projection of 1.0351 to 1.3433 from 1.2099 at 1.4004. Outlook will now stay bullish as long as 55 W EMA (now at 1.3090) holds, even in case of deep pullback.