Sample Category Title
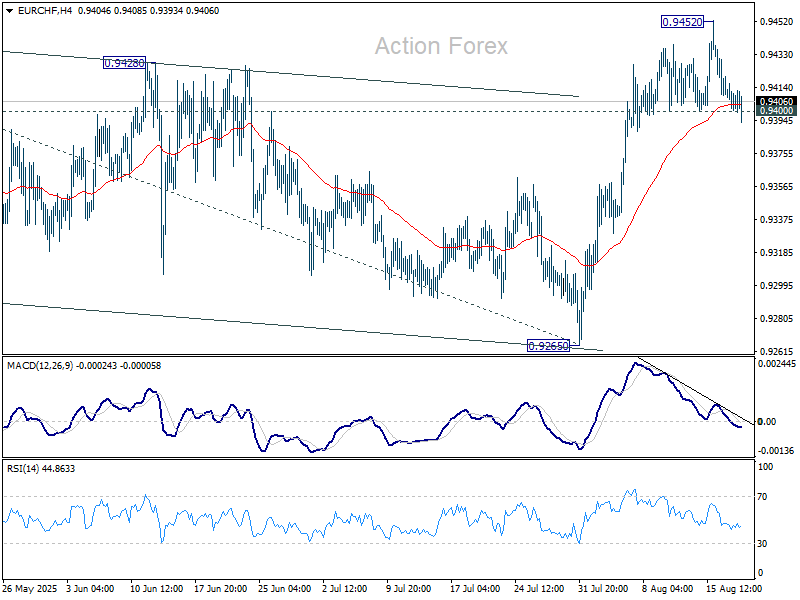
EUR/CHF Daily Outlook
Daily Pivots: (S1) 0.9399; (P) 0.9411; (R1) 0.9419; More....
Intraday bias in EUR/CHF stays neutral for the moment. Further rise is expected as long as 0.9400 support holds. Above 0.9452 will extend the rise from 0.9218 to 100% projection of 0.9218 to 0.9445 from 0.9265 at 0.9492. However, firm break of 0.9400 will turn bias back to the downside for 55 D EMA (now at 0.9365).
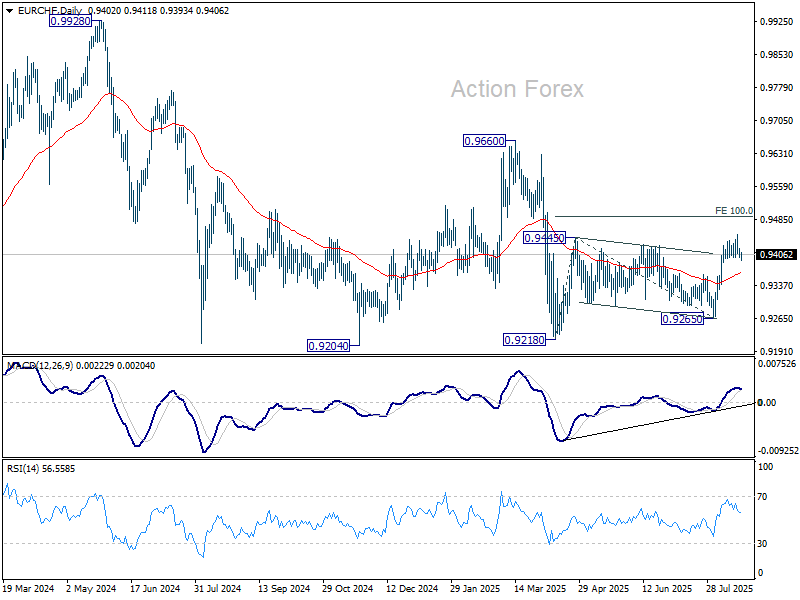
In the bigger picture, the down trend from 0.9204 (2018 high) might still be in progress considering that EUR/CHF is staying well inside the long term falling channel. However, with bullish convergence condition in W MACD, downside potential should be limited in case of another fall. Instead, firm break of 0.9660 resistance will be an important sign of medium term bullish trend reversal.
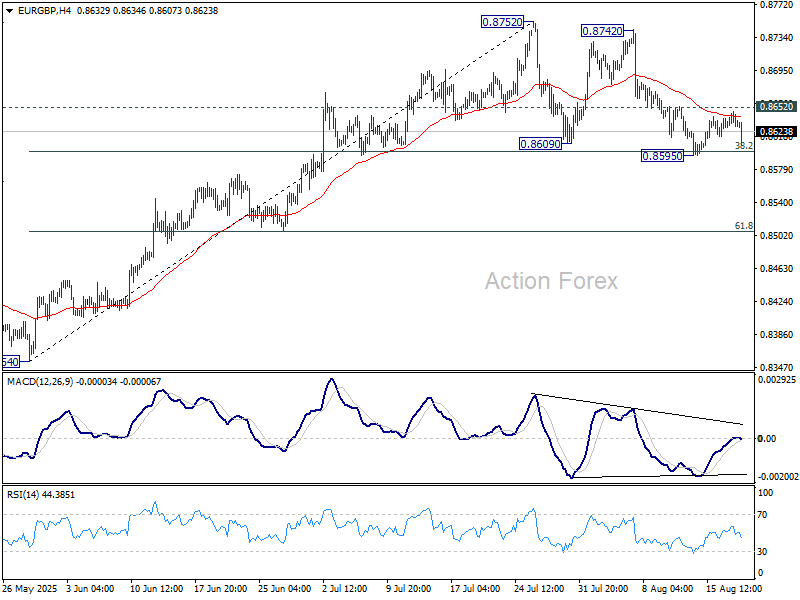
EUR/GBP Daily Outlook
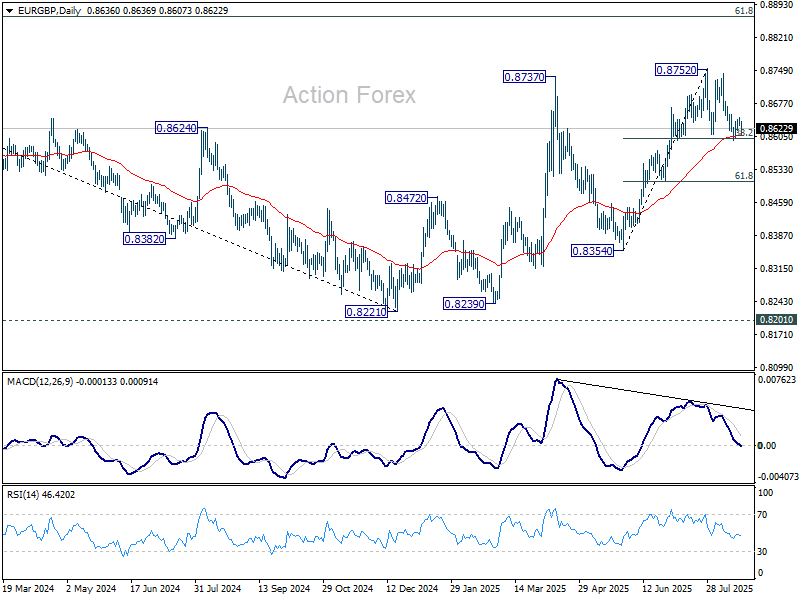
Daily Pivots: (S1) 0.8612; (P) 0.8630; (R1) 0.8651; More...
EUR/GBP dips notably today but stays above 0.8595 temporary low. Intraday bias stays neutral for the moment. On the upside, break of 0.8652 will suggest that the corrective pattern from 0.8752 has completed after drawing support from 38.2% retracement of 0.8354 to 0.8752 at 0.8600, and retain near term bullishness. Intraday bias will be back on the upside for retesting 0.8752 high next. However, sustained break of 0.8600 will indicate near term bearish reversal and target 61.8% retracement at 0.8506.
In the bigger picture, the structure from 0.8221 medium term bottom are not impulsive enough to suggest that it's reversing the down trend from 0.9267 (2022 high). But even if it's a correction, further rise is expected to 61.8% retracement of 0.9267 to 0.8221 at 0.8867. This will remain the favored case as long as 55 W EMA (now at 0.8501) holds.
EUR/AUD Daily Outlook
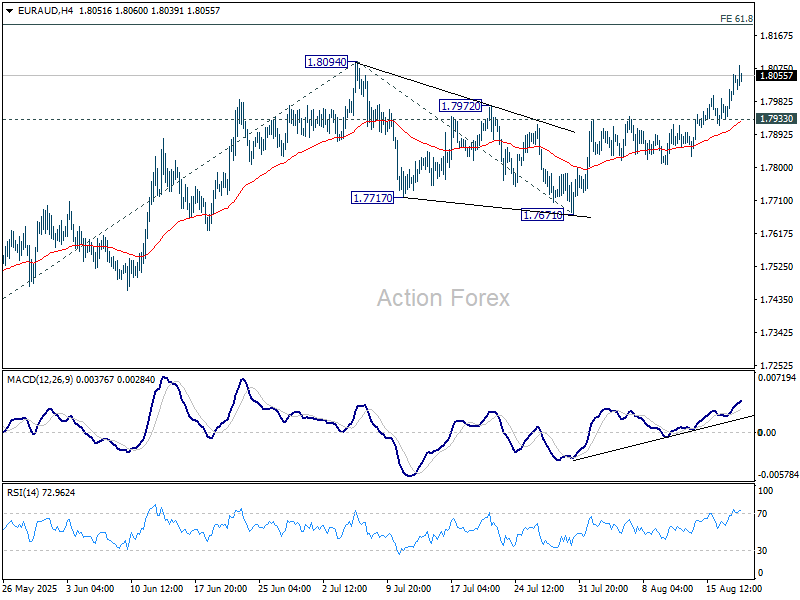
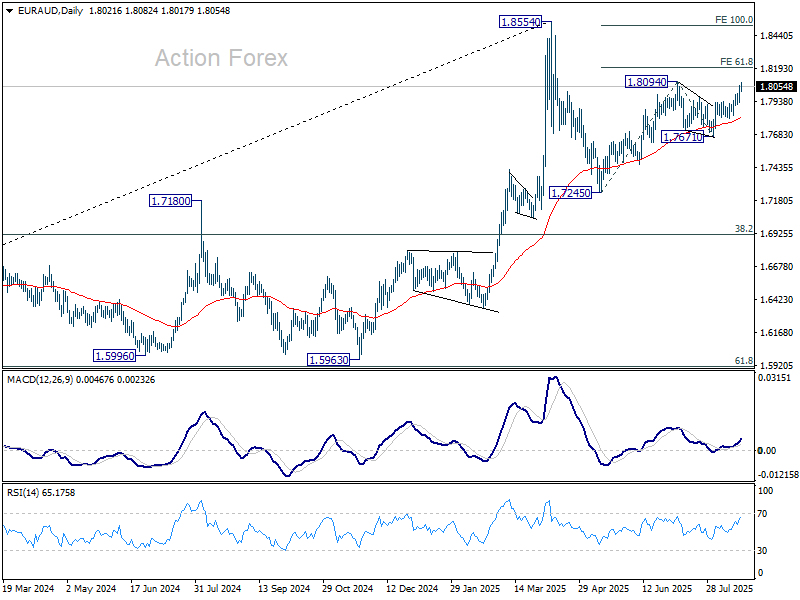
Daily Pivots: (S1) 1.7974; (P) 1.8017; (R1) 1.8091; More...
EUR/AUD's rally is in progress and intraday bias stays on the upside for 1.8094 resistance. Firm break there will resume the whole rally from 1.7245 to 61.8% projection of 1.7245 to 1.8094 from 1.7671 at 1.8196. On the downside, below 1.7933 minor support will delay the bullish case and turn intraday bias neutral first.
In the bigger picture, price actions from 1.8554 medium term top are seen as a corrective pattern. Such pattern could extend further with another falling leg. But even in that case, downside should be contained by 38.2% retracement of 1.4281 (2022 low) to 1.8554 at 1.6922 to bring rebound. Uptrend from 1.4281 is expected to resume at a later stage.
GBP/JPY Daily Outlook
Daily Pivots: (S1) 198.65; (P) 199.41; (R1) 200.00; More...
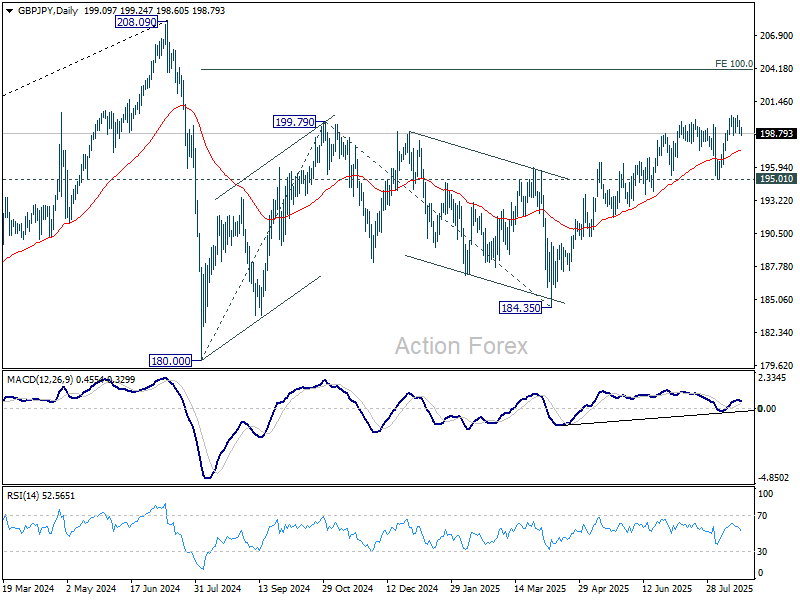
Intraday bias in GBP/JPY remains neutral for the moment. On the downside, below 198.58 minor support will extend the correction from 200.26 to 55 D EMA (now at 197.40) and possibly below. But near term outlook will stay bullish as long as 195.01 support holds. On the upside, firm break of 200.26 will resume the whole rise from 184.35 to 100% projection of 180.00 to 199.79 from 184.35 at 204.14.
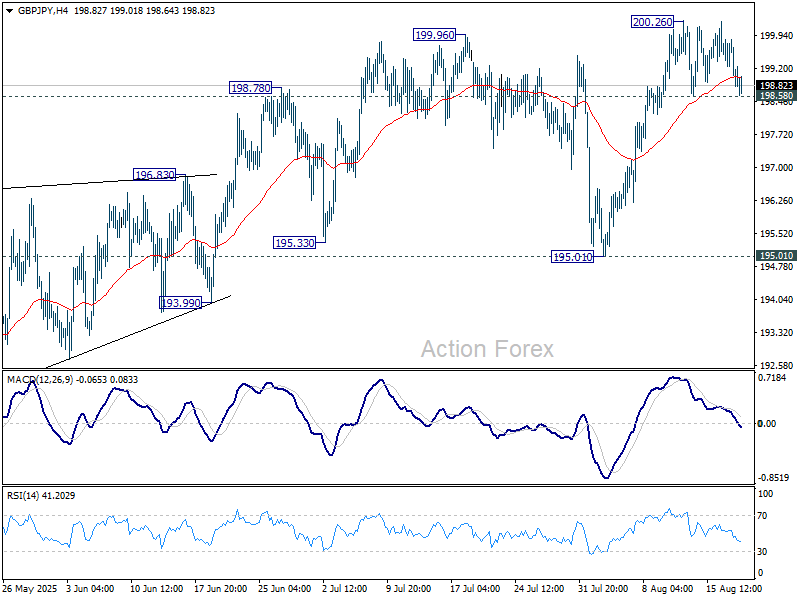
In the bigger picture, price actions from 208.09 (2024 high) are seen as a correction to rally from 123.94 (2020 low). The pattern might still extend with another falling leg. But in that case, strong support should be seen from 38.2% retracement of 123.94 to 208.09 at 175.94 to contain downside. Meanwhile, decisive break of 208.09 will confirm long term up trend resumption.
Not Convinced Further Correction in (US Tech) Stocks Will Help Dollar
Markets
Markets initially looked on track for yet another session of summertime technical trading yesterday, counting down to Friday’s Jackson Hole address of Fed Chair Powell. European equities outperformed (EuroStoxx 50 +0.89%) as markets pondered progress in talks to end the war between Russia and Ukraine. (EMU) yields initially maintained recent gains. However, in US tech stocks fell prey to profit taking (Nasdaq -1.46%) during US dealings. In this mild risk-off, core bonds apparently attracted some safe haven flows. Gains were modest though. US yields eased between 1.5 bps (2-y) and 2.7 bps (10-y). German yields ceded up to 1.5 bps (30-y). Despite a slight loss of interest rate support and US equity underperformance (at least versus Europe), the dollar finally gained on points (DXY close 98.27; EUR/USD 1.1647). USD/JPY was exception to the rule (close 147.7 from 147.9). Most moves in the major USD cross rates still were technically irrelevant.
Yesterday’s correction in US tech stocks translates into red figures for most Asian equity markets this morning, with Taiwan, Korean and Japan underperforming. US yields are little changed as is the dollar. Later today, the eco calendar is again thin. Markets will look for some additional insights on the internal debate within the FOMC in the Minutes of the July 30 Fed meeting. However, after recent (payrolls and inflation) data and with markets looking forward to Jackson Hole, the minutes remain a bit of ‘old news’. Fed Bostic moderates a conversion on the economic outlook, but already gave his (balanced) view last week. Even in case of a further technical correction in US equities, we expect the impact on core bond yields to remain limited ahead of Jackson Hole. We’re also not convinced that a further correction in (US tech) stocks will be a big help for the dollar. The Swedish Riksbank is expected to keep its policy rate unchanged at 2.0%.
UK July inflation brought a first reality check after the hawkish BoE rate cut (August 07 meeting). UK July prices again printed on the higher side of expectations. Headline inflation rose 0.1% M/M to 3.8% Y/Y (from 3.6%). Core CPI also rose from 3.7% to 3.8%. Services inflation even accelerated from 4.7% to 5.0%. Money markets recently already doubted whether the BoE would be able to continue policy normalization at the current quarterly 25 bps pace. Those doubts won’t ease after today’s data. Sterling gains modestly immediately after the release (EUR/GBP 0.862). A revisit of the EUR/GBP 0.86 support area might be on the cards. However, sustained sterling gains probably need better growth rather than higher inflation-driven interest rate support.
News & Views
The Reserve Bank of New Zealand (RBNZ) lowered its policy rate this morning as expected by 25 bps to 3%. It was a split vote (4-2) with two governors in favor of a larger, 50 bps, rate cut. Inflation is currently around the top of the 1%-3% target band, but expected to return to 2% by mid-2026 due to spare capacity and declining domestic pressures. The economic recovery stalled in Q2 with global policy uncertainty, falling employment, higher essential prices and declining house prices all contributing. The MPC indicates scope for further OCR reductions if medium-term inflation pressures continue to ease to help the economy and labour market. Updated projections for the policy rate suggest short term potential towards 2.5% by Q1 of next year, compared with 2.75% in the May update, before returning to a neutral 3% at the end of the policy horizon. NZ markets had to reposition to the softer tone from the RBNZ. The NZD swap curve bull steepens with yields falling by 8.7 bps (30-yr) to 17.2 bps (2-yr). The kiwi dollar suffers a setback, falling from NZD/USD 0.59 to 0.5825 and losing a first technical support zone (0.5878/47; 38% YtD retracement & May low).
Japanese exports fell by 2.6% Y/Y in value in July, the steepest drop since February 2021. A downturn in cars, auto parts and steel is behind the drop. Export volumes rose by 1.2% Y/Y suggesting that Japanese companies bear the brunt of US tariffs. Exports to the US dropped by 10.1% Y/Y in value terms and by 3.2% Y/Y in volume terms. Japanese imports decreased by 7.5% Y/Y (value), mostly driven by energy. Despite this fall, the Japanese trade balance still flipped from a JPY 152.1bn surplus in June to a JPY 117.5bn deficit in July. The trade surplus with the US fell from JPY 669bn to JPY 585bn..
The Emperor is Naked
A selloff across US Big Tech names dampened market mood yesterday, triggered largely by mounting doubts over the AI boom. An MIT report revealed that 95% of companies investing in generative AI have yet to see returns, while OpenAI CEO Sam Altman himself warned that some sector valuations were “insane.” The comments may have been a wake-up call for investors, sparking a sharp pullback in high-flying names. Palantir plunged nearly 10% (the company is trading on a price-to-earnings ratio north of 500). Nvidia, with a P/E of 56 but vulnerable ahead of next week’s earnings, fell over 3%, while other AI-linked stocks such as Arm, Oracle and AMD also lost ground. The weakness dragged the Nasdaq down about 1.5%, its steepest drop since the start of the month, as investors rotated into defensive sectors including utilities, real estate and consumer staples.
Intel was a rare bright spot, rising 7% after a volatile month of swings tied to both political and corporate news. Earlier this month, Donald Trump had called for CEO Lip-Bu Tan to resign given his track record of investing in Chinese tech firms. Yet a subsequent White House meeting signaled improving relations, with the government announcing plans to take a non-voting stake in the company. That news drew a mixed market reaction, with concerns that the move was more about shoring up domestic production than commercial demand. Sentiment improved yesterday when SoftBank unveiled plans to buy a $2bn stake in Intel to co-develop chips that could compete with Nvidia in the AI space. Though the deal must have been backed by political sweeteners, Softbank wants to design and build a chip to compete Nvidia in the AI space, and if Intel could help them do it, there could be a solid synergy. And the latter would give Intel a seat in the AI room – a seat that the company couldn’t secure since OpenAI saw the daylight. Just last month, the company announced a $3bn loss. So, the plan is for the US government to revive Intel and Softbank take part of it. Softbank plunged more than 10% since the news broke. But a part that selloff is linked to the overall stress that there may be a bubble as the company holds big chip names as Nvidia, TSMC and ARM.
If there is a bubble to get burst, companies with relatively lower valuations, strong earnings and decent cash will be less harmed than those that are purely pushed higher on AI hype. The easiest way to see who’s more vulnerable to sharper losses is to check the PE ratios and eventually tidy up portfolios. Investors are also rushing into so-called “disaster” puts, driving put skew — the cost of downside puts relative to upside calls — to highest level in nearly three years, according to 22V Research.
But “insane” valuations are only part of the stress. Caution is also mounting ahead of Federal Reserve Chair Jerome Powell’s speech at Jackson Hole on Friday. Market bets for a September rate cut have surged since investor Scott Bessent floated the idea of a 50bp move. While that appears unlikely, the speculation has made a 25bp cut look almost certain, even as producer prices flashed a sharp increase last month. Powell now faces pressure from the government to cut rates amid a softening labour market, but also the risk of fueling stagflation if inflation re-accelerates. Trump has already criticized Powell for being “too late” on past inflation, sharpening the political backdrop.
The US 2-year yield remains near 3.75%, with expectations centering on a 25bp cut in September and another before year-end — provided inflation doesn’t spike. Any hawkish adjustment in Powell’s tone could lift yields, extend the US dollar’s recovery, and accelerate the equity selloff. Still, 22V Research notes that the average pullback in the past 18 months has been around 12.5%, suggesting a repeat of April’s 20% meltdown is less likely.
Inflation in the UK accelerated faster than expected in July. The headline figure ticked up from 3.6% to 3.8% versus 3.7% expected by analysts, core inflation also rose to 3.8% versus 3.7% expected. Stronger-than-expected CPI numbers further reduce the chances of seeing the Bank of England (BoE) cut rates in November. The BoE sees inflation further peak to 4% in the coming months. Sterling is higher after the CPI figures and has room to factor in more hawkishness amid inflation risks and past few days’ positive surprise on growth and production data.
EUR/JPY Daily Outlook
Daily Pivots: (S1) 171.56; (P) 172.14; (R1) 172.57; More...
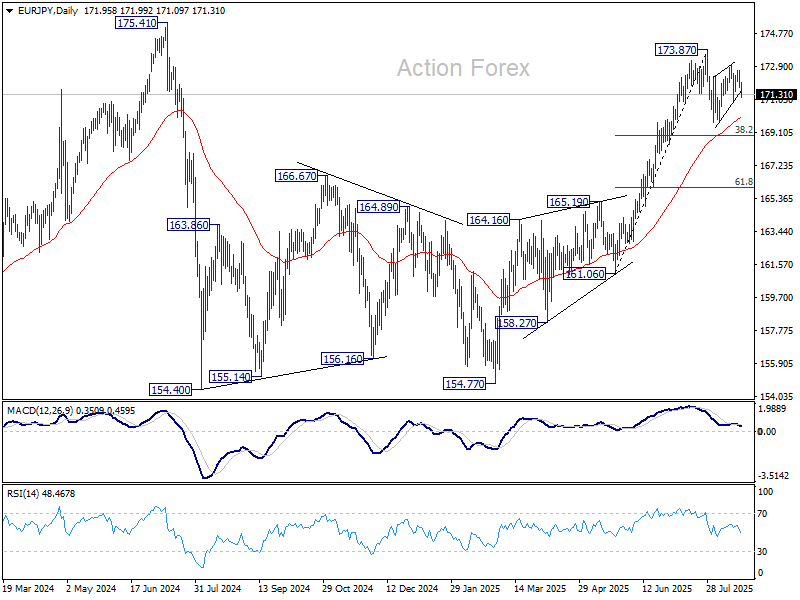
Immediate focus is now on 170.94 support in EUR/JPY with today's decline. Firm break there will suggest that the corrective pattern from 173.87 has started the third leg. Intraday bias will be turned back to the downside for 169.69 support, and possibly below. But downside should be contained by 38.2% retracement of 161.06 to 173.87 at 168.97 to bring rebound. On the upside, above 172.99 will bring retest of 173.87.
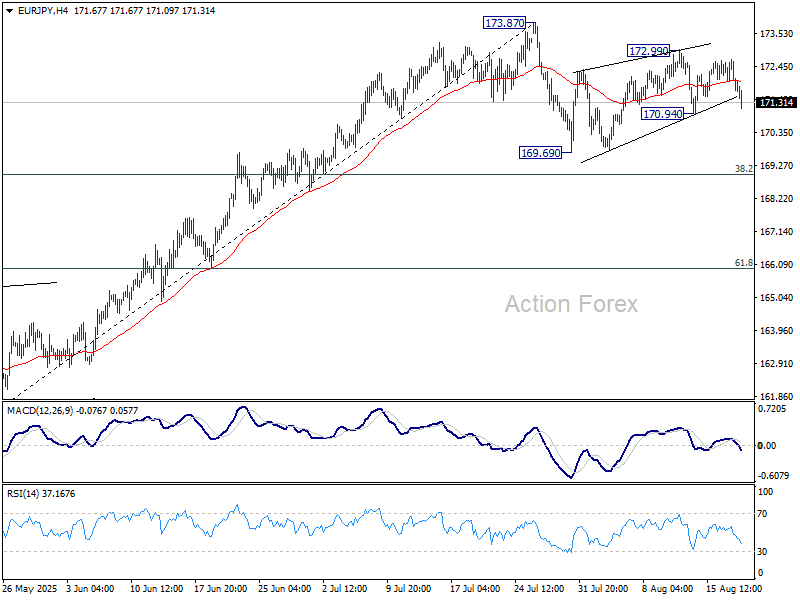
In the bigger picture, considering current strong momentum as seen in the rally from 154.77, corrective pattern from 175.41 could have already completed. Decisive break of 154.77 will confirm long term up trend resumption. Next target is 61.8% projection of 124.37 to 175.41 from 154.77 at 186.31. However, rejection by 175.41, followed by firm break of 55 D EMA (now at 169.95) will delay this bullish case.
Volatile Day as Yen Rebounds, Sterling Holds Firm, Kiwi Slumps
There are three themes dominating currency markets today: a stronger rebound in the Yen, firming Sterling, and a sharp tumble in Kiwi. Moves are being shaped by local economic drivers as well as shifting central bank expectations, setting the stage for a cautious but active session.
Yen’s rally came alongside a steep pullback in Japanese equities, with Nikkei falling more than -1.4%. The selloff partly reflected profit-taking after the index hit fresh record highs earlier this week. Weak trade data added pressure, as exports contracted at the steepest pace since early 2021.
Autos were at the center of the decline, with shipments to the U.S. slumping heavily. There may be hope for a rebound later this year thanks to the U.S.–Japan trade deal that lowered reciprocal tariffs. But for now, investors are wary. The combination of equity weakness and poor trade data has fueled safe-haven demand for Yen.
Sterling, meanwhile, is holding firm after another upside surprise on inflation. July’s data showed both goods and services prices accelerating, suggesting that tariffs are still feeding through to consumers while domestic pressures intensify. Coupled with last week’s solid GDP numbers, the backdrop leans toward the hawks within the BoE.
Markets are beginning to doubt the likelihood of another BoE cut in November if inflation continues to surprise on the upside. Policymakers may be forced to slow their already gradual easing cycle, particularly if price momentum proves sticky heading into the autumn.
In contrast, Kiwi has dropped sharply after RBNZ cut the OCR to 3.00% with a dovish bias. Updated forecasts point to scope for one more cut this year and another in early 2026. The decision was also notable for its split: two members favored a 50bp cut, highlighting a shift toward deeper easing if growth weakens further.
Overall, Yen is the strongest performer so far today, followed by Dollar and Sterling. Kiwi is the weakest, trailed by Euro and Aussie, with Swiss Franc and Loonie in the middle.
Looking ahead, attention turns to FOMC minutes, which may reveal whether more Fed officials were sympathetic to the dovish camp after Governor Christopher Waller and Michelle Bowman dissented in July in favor of an immediate cut.
In Asia, Nikkei fell -1.49%. Hong Kong HSI is down -0.09%. China Shanghai SSE is up 0.62%. Singapore Strait Times is up 0.28%. Japan 10-year JGB yield is up 0.012 at 1.610. Overnight, DOW rose 0.02%. S&P 500 fell -0.59%. NASDAQ fell -1.46%. 10-year yield fell -0.039 to 4.302.
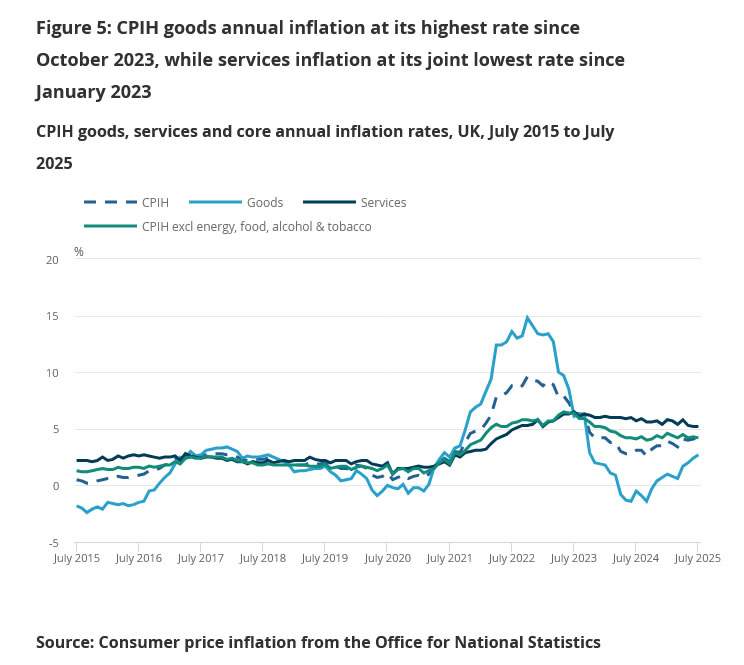
UK CPI jumps to 3.8%, services inflation stays hot at 5%
UK inflation accelerated more than expected in July, with headline CPI rising to 3.8% yoy from 3.6% yoy, surpassing forecasts of 3.7% yoy and marking the highest level since early 2024. The biggest driver was transport costs, particularly higher airfares, which made the largest contribution to the monthly rise in annual rates.
Breakdown data showed broad-based strength. CPI goods inflation climbed to 2.7% yoy from 2.4% yoy, while CPI services surged to 5.0% yoy from 4.7% yoy. Meanwhile, core CPI edged up from 3.7% yoy to 3.8% yoy, topping expectations and matching the headline pace, highlighting persistent underlying pressures.
For BoE, the data poses a challenge. The uptick in both headline and core inflation risks slowing the recent easing cycle, as policymakers balance still-high inflation against weaker economic growth momentum. Markets may scale back expectations for near-term cuts if the stickiness persists.
RBNZ cuts, opens door to more, NZD/USD diving towards 0.58
RBNZ delivered a 25bps cut to the Official Cash Rate, lowering it to 3.00% as widely expected. A more sizeable 50bps rate cut was discussed during the meeting. Policymakers maintained an easing bias, noting that “if medium-term inflation pressures continue to ease as expected, there is scope to lower the OCR further.”
The new projections point to the OCR dropping to 2.7% by Q4 2025, then settling between 2.5% and 2.6% in 2026 before edging back toward 2.7–2.8% in 2027. This outlook effectively signals room for one additional cut this year and another in early 2026.
The Bank highlighted ongoing slack in the economy and easing domestic inflation, projecting headline inflation to return to the 2% midpoint of target by mid-2026. However, New Zealand’s recovery has stalled, with household and business spending constrained by global policy uncertainty, weaker employment, higher costs for essentials, and falling house prices.
NZD/USD dives through 0.5855 support after the announcement to resume the decline from 0.6119. Next target is 50% retracement of 0.5484 to 0.6119 at 0.5802. As the decline is currently seen as a corrective move, there might be some support form 0.5802 to bring rebound. However, firm break of 0.5906 support turned resistance is needed to indicate short term bottoming. Otherwise, risk will stay on the downside in case of recovery.

Also, decisive break of 0.5802, coupled with downside acceleration through the near term falling channel, will suggest that NZD/USD is indeed reversing the whole rise from 0.5484. That could pave the way through 61.8% retracement of 0.5727 to wards 0.5484 low.

Japan exports slump -2.6% yoy in July, U.S. auto shipments hit hard
Japan’s exports fell -2.6% yoy in July to JPY 9.36 trillion, the sharpest drop since February 2021, driven by weaker demand from its two largest markets, the U.S. and China. Exports to the U.S. slid -10.1% yoy, with auto shipments plunging -28.4% yoy, a steeper decline than June’s -26.7%. Shipments to China also contracted -3.5% yoy, though exports to Hong Kong surged nearly 18% yoy.
The latest weakness highlights how external headwinds continue to weigh on Japan’s trade sector. While Tokyo reached a deal with Washington on July 22 to reduce reciprocal tariffs to 15% from 25%, the benefits will not be reflected until the August trade data. For now, auto exports remain a key drag on overall performance.
Imports fell -7.5% yoy to JPY 9.48 trillion, leaving Japan with a JPY 118 billion deficit. In seasonally adjusted terms, exports slipped -0.2% mom, while imports rose 0.4% mom, pushing the deficit wider to JPY 303 billion.
EUR/JPY Daily Outlook
Daily Pivots: (S1) 171.56; (P) 172.14; (R1) 172.57; More...
Immediate focus is now on 170.94 support in EUR/JPY with today's decline. Firm break there will suggest that the corrective pattern from 173.87 has started the third leg. Intraday bias will be turned back to the downside for 169.69 support, and possibly below. But downside should be contained by 38.2% retracement of 161.06 to 173.87 at 168.97 to bring rebound. On the upside, above 172.99 will bring retest of 173.87.
In the bigger picture, considering current strong momentum as seen in the rally from 154.77, corrective pattern from 175.41 could have already completed. Decisive break of 154.77 will confirm long term up trend resumption. Next target is 61.8% projection of 124.37 to 175.41 from 154.77 at 186.31. However, rejection by 175.41, followed by firm break of 55 D EMA (now at 169.95) will delay this bullish case.
Focus on FOMC Minutes and UK CPI
In focus today
The minutes from FOMC's July meeting will be released this evening but given that the meeting was held before the latest weak Jobs report, markets' main focus remains on the timelier Fed commentary.
Inflation data will be interesting to gauge after investors have backed off bets on further rate cuts from the Bank of England (BoE) due to the somewhat more hawkish guidance at the recent BoE meeting and a labour market which is probably not as weak as feared. Headline inflation was 3.7% in June after prices increased more than expected. Like we also see it in the Nordics, food prices is a key inflation driver.
Economic and market news
What happened overnight
In New Zealand, the Reserve Bank (RBNZ) continued its easing cycle with a 25bp rate cut early, lowering the Official Cash Rate to 3.00% in line with market consensus.
In Japan, exports recorded their steepest decline in four years as US tariffs weigh on the economy. Exports fell by 2.6% y/y (cons: -2.1%) and imports dropped by 7.5% y/y (cons: -10.4%). Notably, exports to the US declined by 10.1% y/y, driven by the 25% tariffs on automobiles and auto parts that appear to significantly impact trade with the US, which accounts for about 18% of total Japanese exports. The Japanese trade balance saw a significant unanticipated shift into negative territory of JPY -117.5bn (cons: JPY 196.2bn).
What happened yesterday
In the US, President Trump conceded in an interview that Russian President Putin may not be interested in making a deal at all and ruled out sending US troops to Ukraine. Trump plans on monitoring Putin's course of action over the coming weeks and warned Putin that he would risk facing a 'rough' situation in a no deal scenario.
In China, the premier Li Qiang called for more action to boost consumption and investments in a meeting with his cabinet. It follows the weak data report for July released on Friday and the Politburo meeting in July calling on stepping up support at an appropriate time.
Equities: Equities retreated yesterday despite a European rally and with 8 out of the 11 sectors in S&P 500 closing higher. In other words, the sell-off was entirely tech-driven, absent a clear trigger. The result was a sharp defensive rotation and pronounced value outperformance, with small caps even outperforming large caps and, notably, Min Vol outperforming as well. This mini correction in tech comes not only after a strong run recently, but essentially since the post-"liberation day" bottom in April. Over recent weeks, leadership has narrowed further into a handful of mega-cap tech names, many of which had reached fresh absolute and relative highs.
Yesterday's session was broad and largely devoid of macro headlines - neither weaker data, Fed expectations ahead of Powell's Jackson Hole remarks, nor earnings were in play. Rather, this was a textbook case of profit-taking after a powerful tech rally, which then cascaded into a negative feedback loop. In the US yesterday, Dow +0.02%, S&P 500 -0.6%, Nasdaq -1.5%, and Russell 2000 -0.8%. Asia is following suit this morning, with tech-heavy indices under pressure - Taiwan down around 2.5% at the time of writing. Futures in both Europe and the US are pointing lower, again led by weakness in the tech complex.
FI and FX: US equities dropped through yesterday's session with rate-sensitive sectors such as tech underperforming defensives. US rates moved slightly lower in line with the deteriorating risk sentiment, while EUR rates held steady. The volatility in FX markets was very modest as markets await Jackson Hole and August PMI data. EUR/USD closed at its 1.165 starting point. The drop in risky assets during yesterday's US session weighed on energy/commodity prices which in turn triggered NOK FI overperformance and left NOK FX as one of the clear session losers. EUR/NOK is back close to the 12.00 threshold.
UK CPI jumps to 3.8%, services inflation stays hot at 5%
UK inflation accelerated more than expected in July, with headline CPI rising to 3.8% yoy from 3.6% yoy, surpassing forecasts of 3.7% yoy and marking the highest level since early 2024. The biggest driver was transport costs, particularly higher airfares, which made the largest contribution to the monthly rise in annual rates.
Breakdown data showed broad-based strength. CPI goods inflation climbed to 2.7% yoy from 2.4% yoy, while CPI services surged to 5.0% yoy from 4.7% yoy. Meanwhile, core CPI edged up from 3.7% yoy to 3.8% yoy, topping expectations and matching the headline pace, highlighting persistent underlying pressures.
For BoE, the data poses a challenge. The uptick in both headline and core inflation risks slowing the recent easing cycle, as policymakers balance still-high inflation against weaker economic growth momentum. Markets may scale back expectations for near-term cuts if the stickiness persists.