
Sample Category Title
Nasdaq100: It is OK to Compare AI-Mania to Dot-Com Bubble, But it is Not Bursting Yet
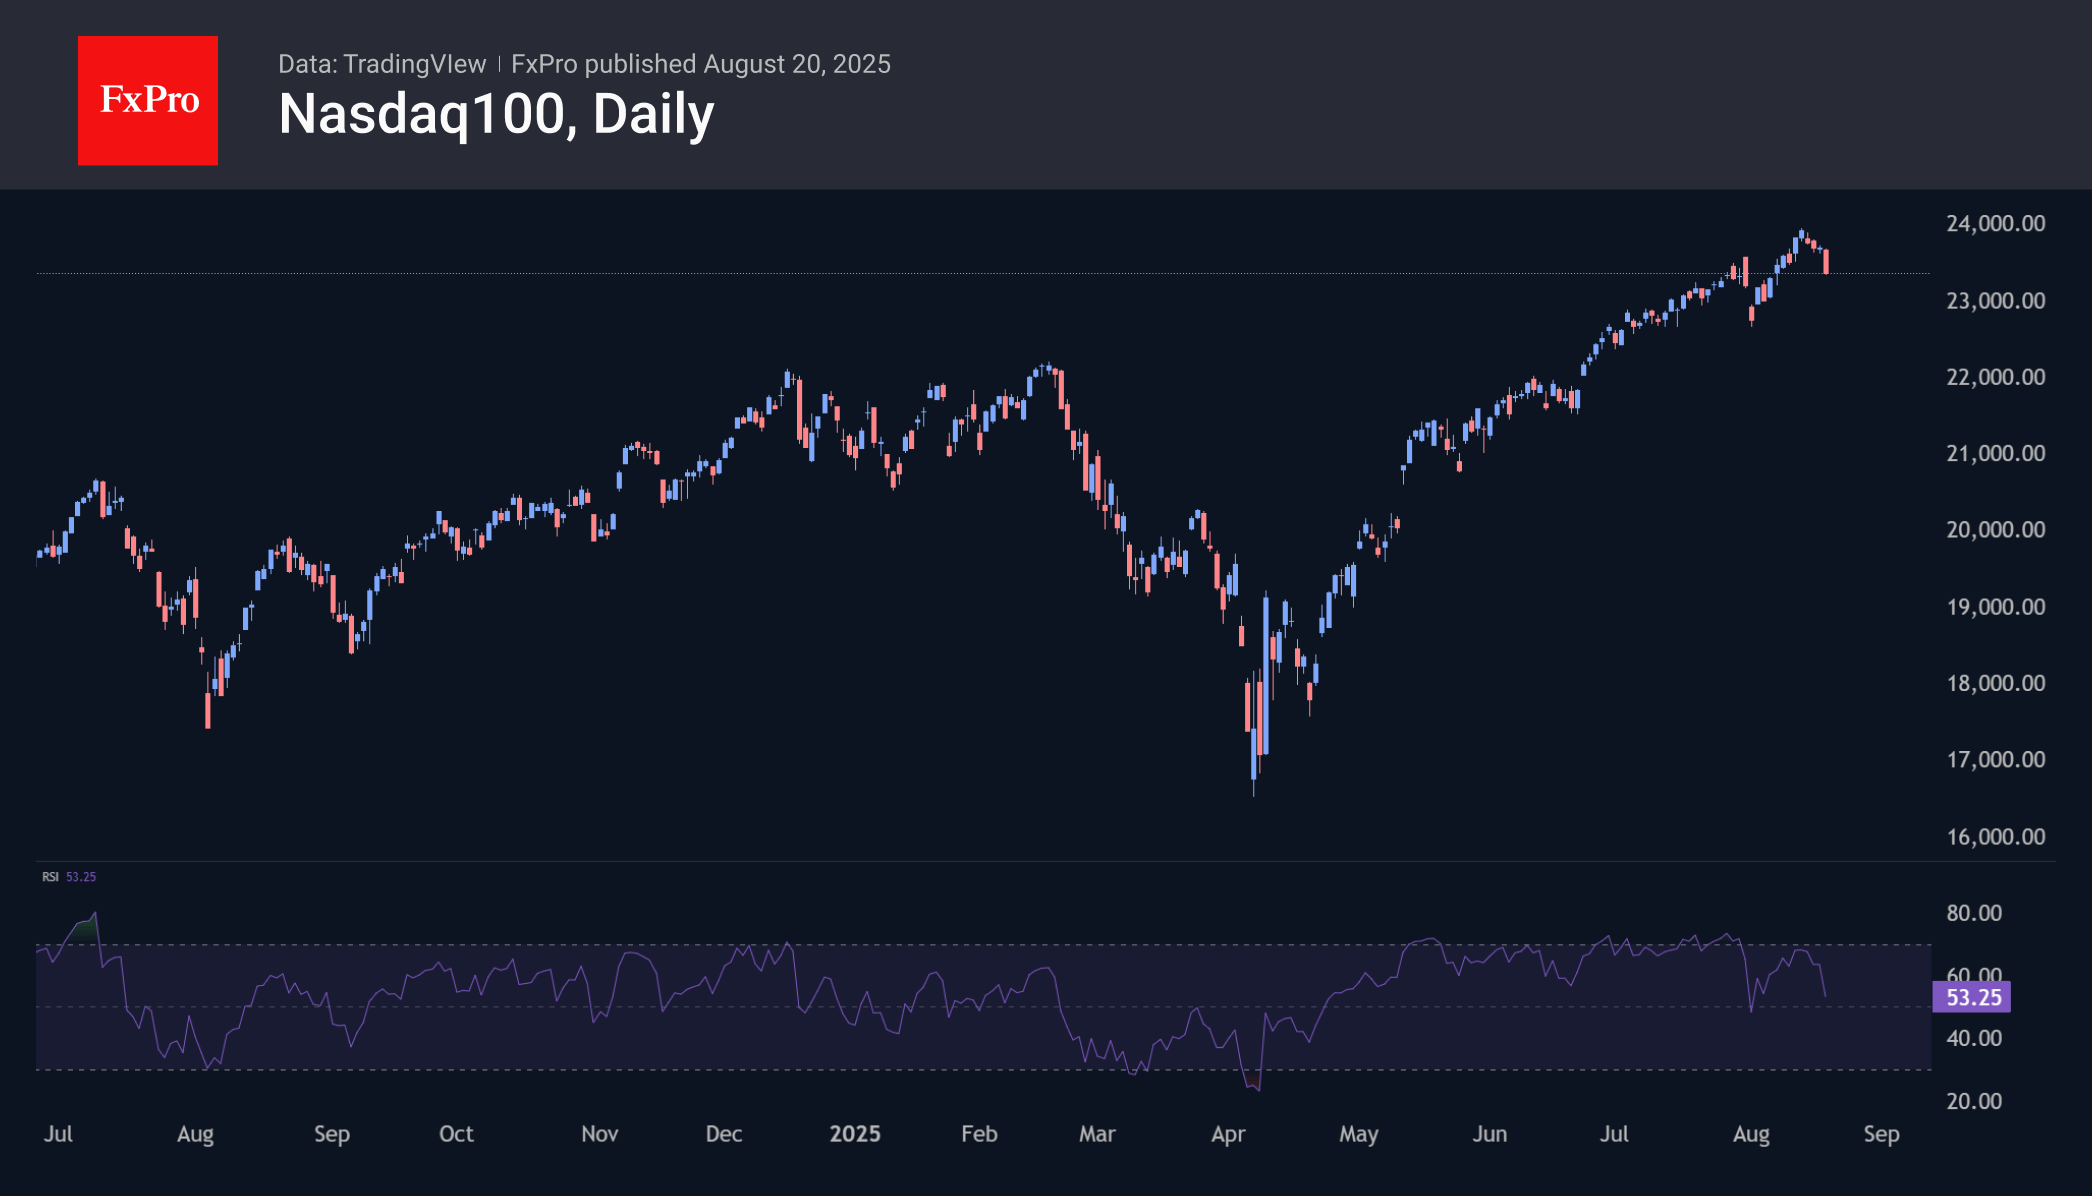
The Nasdaq100, the leader among US indices in recent years, remains one step ahead even during periods of decline. The index has been declining for the sixth consecutive trading session, but careful profit-taking on Tuesday became more nervous with a 1.4% drop, and the total decline from the peak exceeds 2.4%.
Market commentators note a decline in euphoria surrounding the revolutionary nature of AI implementation and compare the situation to the dot-com bubble. The problem is indeed very similar, from the revolutionary nature of the technology and the desire of market leaders to show their involvement in it, to the overvaluation of companies based on projections of rapid early success into the future. An example is the launch of GPT-5, which attracted criticism and complaints about quality rather than the expected breakthrough, forcing OpenAI to roll back to the previous model in some cases. And all this despite multi-billion dollar investments.
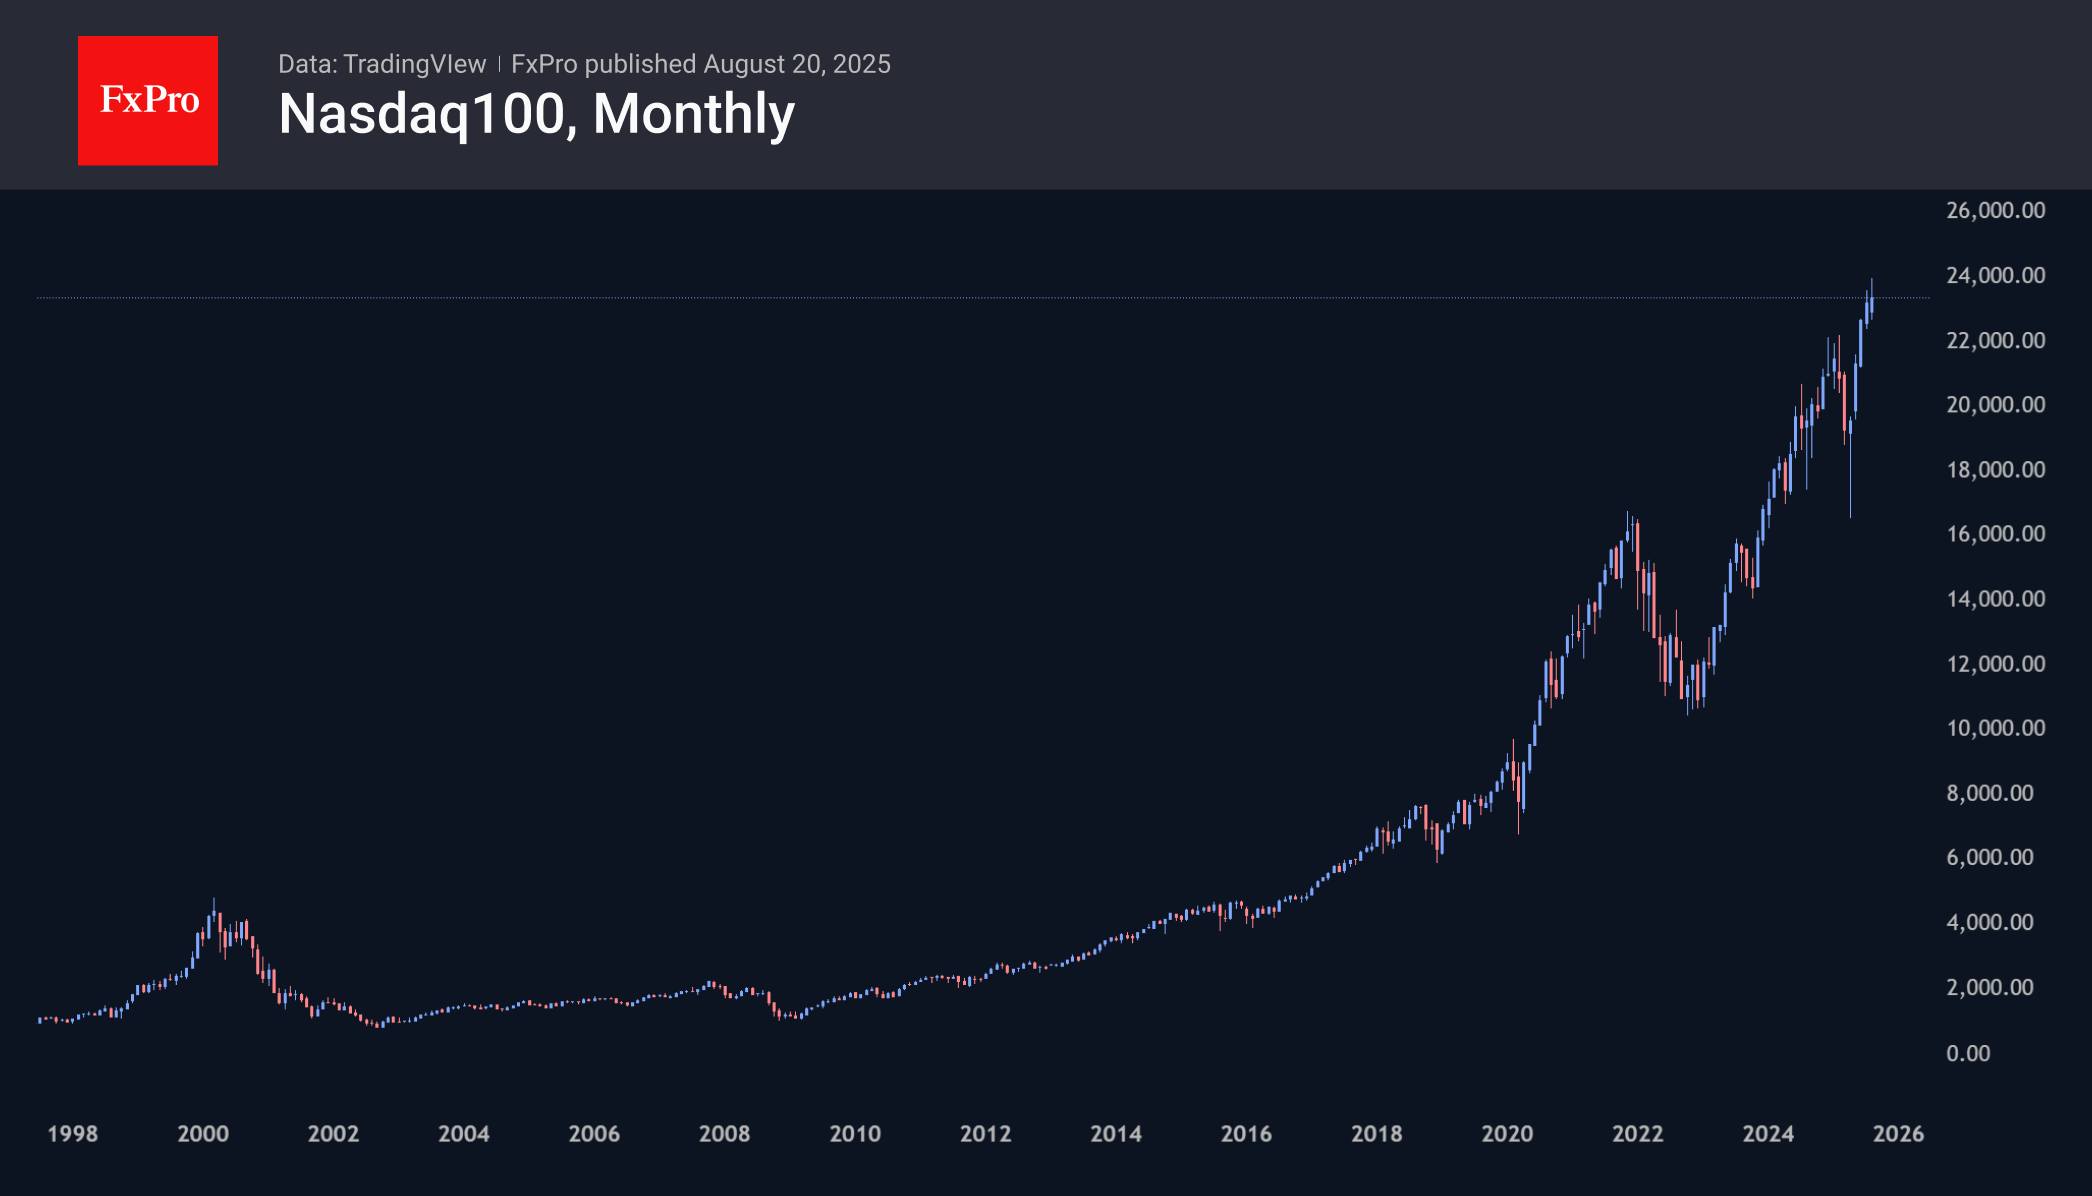
While comparisons with events and market impacts from a quarter of a century ago make sense, it is also important to remember that talk of a dot-com bubble began as early as 1996–1997 and was very loud in 1999. However, the most intense part of the rally was still ahead, with more than 120% growth from August 1999 to March 2000. This is a crucial point for investors: Is it really time to open a global short position?
We believe that the recent market sluggishness is related to a change in expectations regarding US monetary policy following alarming inflation reports: higher rates are a heavier burden for fast-growing companies that need money for investment.
In addition, August is statistically the second-worst month for stocks, second only to September, which is likely holding back buyers.
At the same time, we continue to believe that the Fed remains in a cycle of rate cuts, having taken a long pause of three quarters. The April correction removed the market’s long-term overheating, creating room for growth. This means that the market’s tactic of buying on dips and taking profits with shallow corrections is more likely to be replaced by a resumption of growth than to turn into a global sell-off.
EUR/USD Mid-Day Outlook
Daily Pivots: (S1) 1.1627; (P) 1.1660; (R1) 1.1681; More...
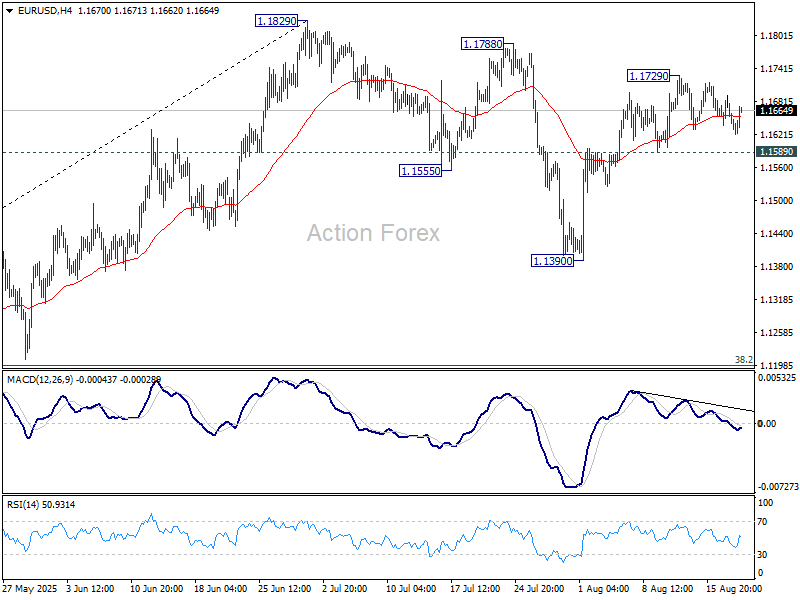
Intraday bias in EUR/USD remains neutral for the moment as sideway trading continues. Further rally is expected as long as 1.1589 support holds. Above 1.1729 will bring retest of 1.1829 high. On the downside, however, firm break of 1.1589 will turn bias to the downside, and extend the corrective pattern from 1.1829 with another fall.
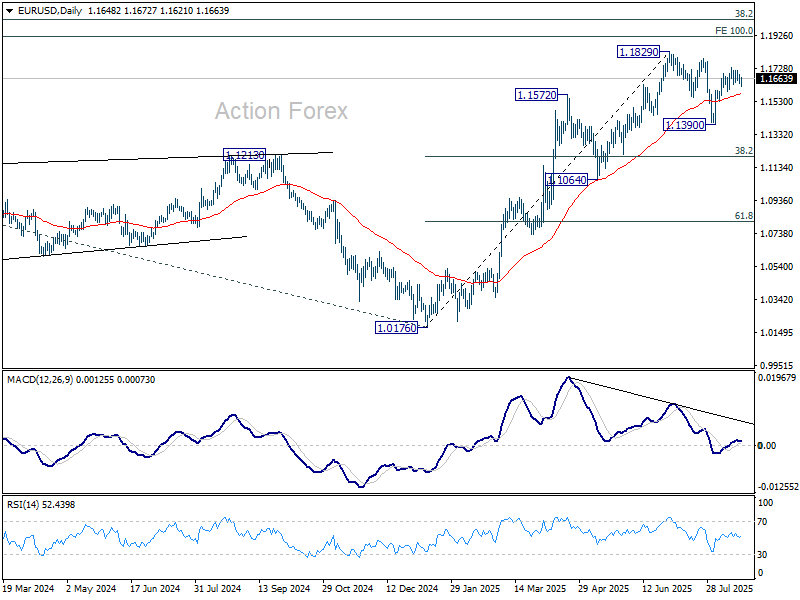
In the bigger picture, rise from 0.9534 long term bottom could be correcting the multi-decade downtrend or the start of a long term up trend. In either case, further rise should be seen to 100% projection of 0.9534 to 1.1274 from 1.0176 at 1.1916. This will remain the favored case as long as 1.1604 support holds.
GBP/USD Mid-Day Outlook
Daily Pivots: (S1) 1.3469; (P) 1.3500; (R1) 1.3522; More...
GBP/USD's correction from 1.3594 is still in progress and deeper fall cannot be ruled out. But downside should be contained well above 1.3398 support. On the upside, break of 1.3594 will resume the rise from 1.3140 to retest 1.3787 high.
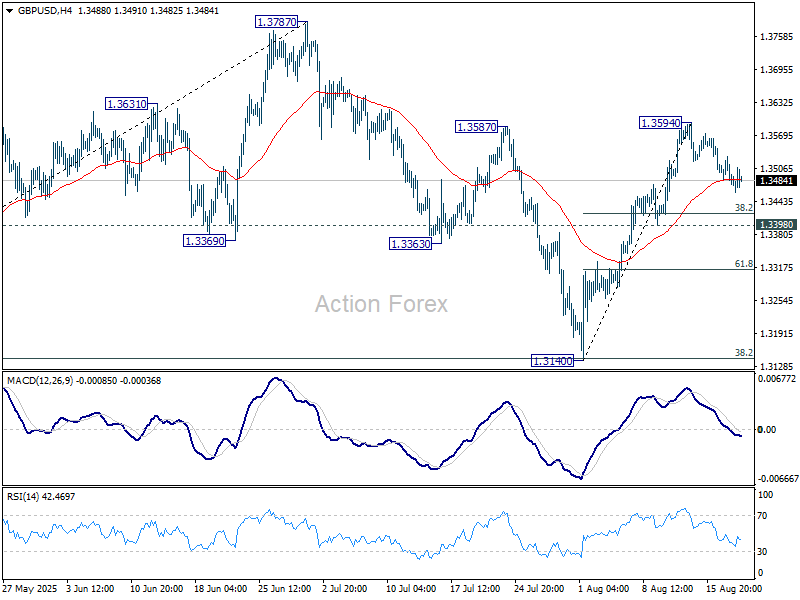
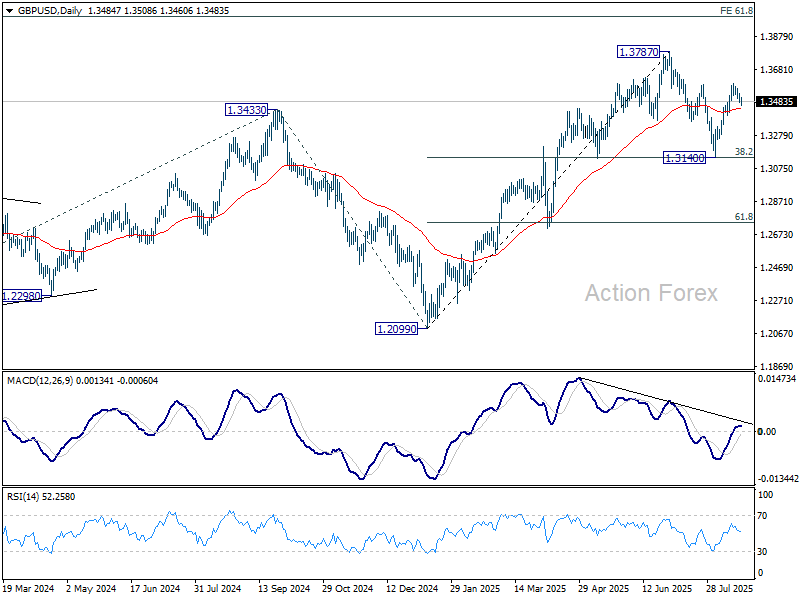
In the bigger picture, up trend from 1.3051 (2022 low) is in progress. Next medium term target is 61.8% projection of 1.0351 to 1.3433 from 1.2099 at 1.4004. Outlook will now stay bullish as long as 55 W EMA (now at 1.3090) holds, even in case of deep pullback.
USD/CHF Mid-Day Outlook
Daily Pivots: (S1) 0.8055; (P) 0.8070; (R1) 0.8094; More….
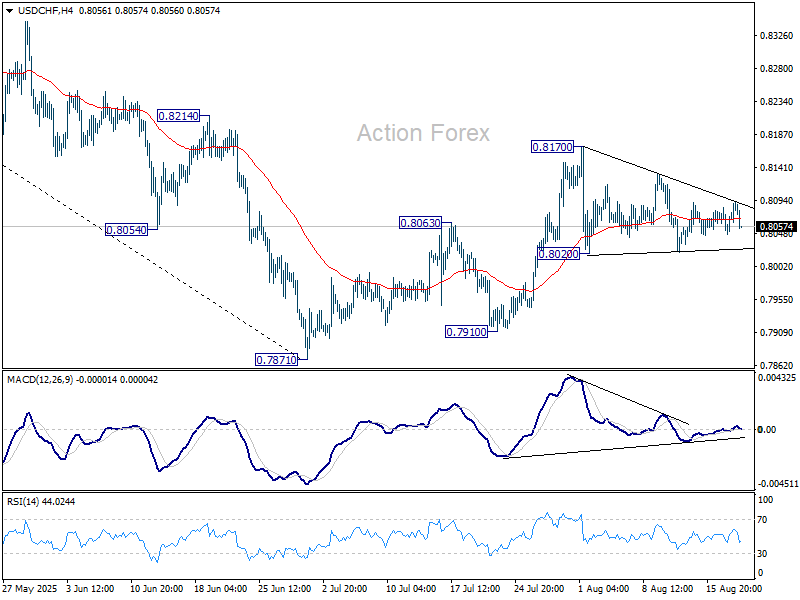
USD/CHF is still bounded in range trading and intraday bias stays neutral. On the downside, break of 0.8020 will revive that case that the corrective pattern from 0.7871 has completed, and target a retest on 0.7871 low. On the upside, firm break of 0.8710 will resume the corrective from 0.7871. Intraday bias will be back on the upside for 38.2% retracement of 0.9200 to 0.7871 at 0.8379.
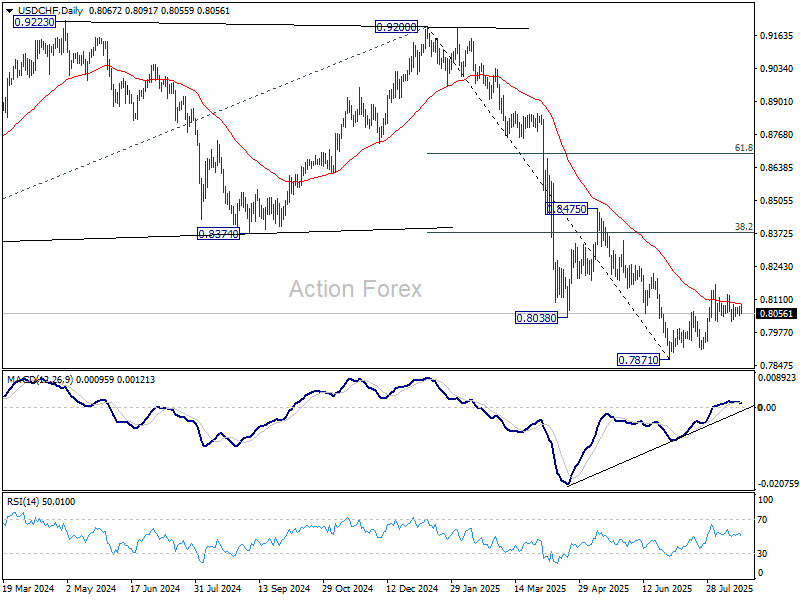
In the bigger picture, long term down trend from 1.0342 (2017 high) is still in progress. Next target is 100% projection of 1.0146 (2022 high) to 0.8332 from 0.9200 at 0.7382. In any case, outlook will stay bearish as long as 0.8475 resistance holds.
USD/JPY Mid-Day Outlook
Daily Pivots: (S1) 147.38; (P) 147.74; (R1) 148.04; More...
USD/JPY weakens today but stays well inside range of 146.20/148.51. Intraday bias remains neutral for the moment. On the upside, break of 148.51 will indicate that the pullback from 150.90 has completed, and bring retest of this high. This will also keep the whole rise from 139.87 alive. However, firm break of 145.84 support will argue that the rebound from 139.87 has completed, and turn near term outlook bearish.
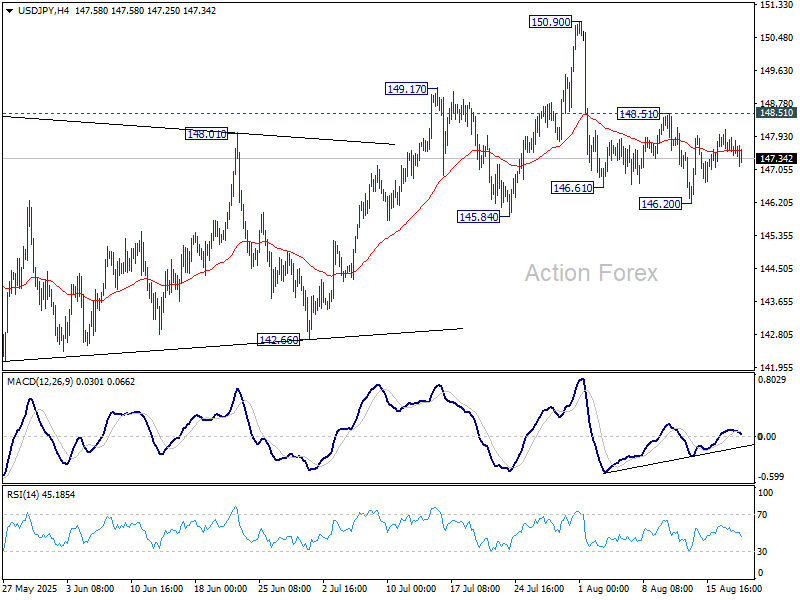
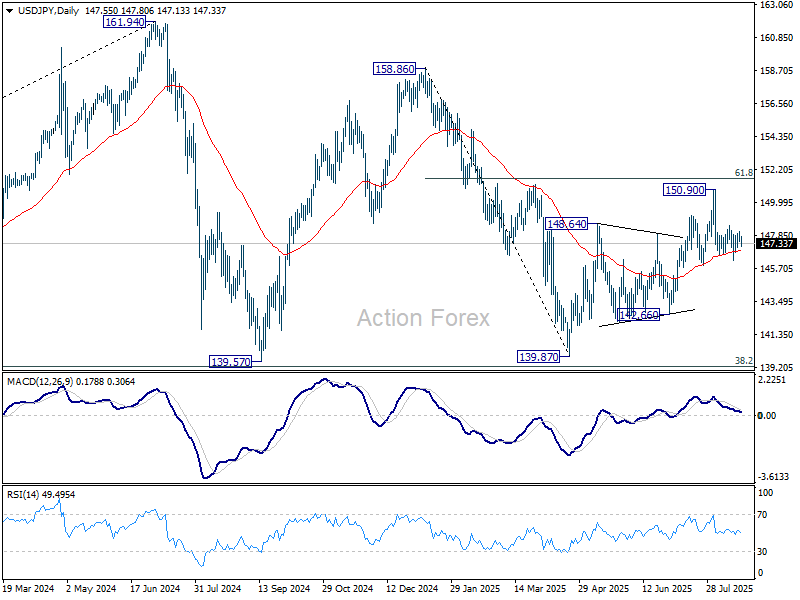
In the bigger picture, price actions from 161.94 (2024 high) are seen as a corrective pattern to rise from 102.58 (2021 low). Decisive break of 61.8% retracement of 158.86 to 139.87 at 151.22 will argue that it has already completed with three waves at 139.87. Larger up trend might then be ready to resume through 161.94 high. In case the corrective pattern extends with another fall, strong support is expected from 38.2% retracement of 102.58 to 161.94 at 139.26 to bring rebound.
Risk-Off Bids Up Yen, Fed Minutes Awaited
The forex markets are trading in a clear risk-off tone today, with commodity currencies sliding and traditional havens like Yen and Swiss Franc leading the pack. Investors are wary that yesterday’s steep selloff in technology stocks could mark the start of a broader correction. NASDAQ’s retreat has stirred unease about stretched valuations in the AI sector and raised doubts over the durability of the equity rally.
The spotlight is now shifting to Fed, with a heavy slate of communication expected before Chair Jerome Powell’s appearance at Jackson Hole on Friday. Fed Governor Christopher Waller is due to speak and is widely expected to reiterate his dovish call that Fed should not delay in cutting rates to safeguard the labor market. His stance has been consistent, and there is little reason to expect a pivot.
More nuanced will be comments from Atlanta Fed President Raphael Bostic, who has maintained a more cautious position, emphasizing the persistence of inflation pressures and signaling preference for only one rate cut this year. Any hint that he is softening could shift expectations meaningfully, but markets are not anticipating a major departure from his recent tone.
The minutes of Fed’s July meeting are also due and have drawn special interest. The meeting itself resulted in no change to the policy rate, left at 4.25–4.50%. Yet, the key drama was that Governors Waller and Michelle Bowman dissented, favoring an immediate cut to avoid further labor market deterioration. This marked the first double dissent in more than three decades and highlighted the widening policy debate inside Fed. The markets will be parsing the minutes to assess how deep the division runs and whether more members leaned dovish in private.
That said, the minutes are somewhat stale—predating the revised payroll figures that signaled more softness in jobs than previously thought. This timing issue is compounded by the fact that the minutes land just two days before Fed Chair Jerome Powell’s Jackson Hole speech. Powell’s remarks, along with a slew of Fed commentary around the symposium, will likely overshadow the July record and provide a fresher signal of policy direction.
Currently fed fund futures are pricing in an 85% chance of a September cut, with odds for an October follow-up slipping below 50%.
In the currency markets, Yen is the day’s top performer so far, trailed by Swiss Franc and Euro. On the other end, Kiwi remains weakest, extending losses after the RBNZ’s dovish cut. Aussie is also soft, with risk aversion weighing heavily. Sterling’s earlier boost from hot UK CPI data has faded. Dollar and Loonie are parked in the middle of the pack.
In Europe, at the time of writing, FTSE is up 0.61%. DAX is down -0.33%. CAC is up 0.23%. UK 10-year yield is down -0.042 at 4.703. Germany 10-year yield is down -0.017 at 2.738. Earlier in Asia, Nikkei fell -1.51%. Hong Kong HSI rose 0.17%. China Shanghai SSE rose 1.04%. Singapore Strait Times rose 0.08%. Japan 10-year JGB yield rose 0.01 to 1.608.
ECB’s Lagarde: EU–US trade deal offers relief but risks still hang over sectoral tariffs
Speaking today, ECB President Christine Lagarde said growth in the Eurozone is expected to weaken in Q3 as earlier tariff-related frontloading unwinds.
A key factor is the new EU–U.S. trade deal, which implies an effective tariff rate of 12–16% on EU goods entering the U.S. Lagarde stressed it is “still close to” the June baseline scenarios, and remains below the severe scenario of tariffs exceeding 20% that staff had also considered.
Nevertheless, “uncertainty persists as sector-specific tariffs on pharmaceuticals and semiconductors remain unclear”, she added.
Lagarde confirmed ECB will incorporate the updated tariff framework into its September projections, which will help shape policy decisions in the coming months.
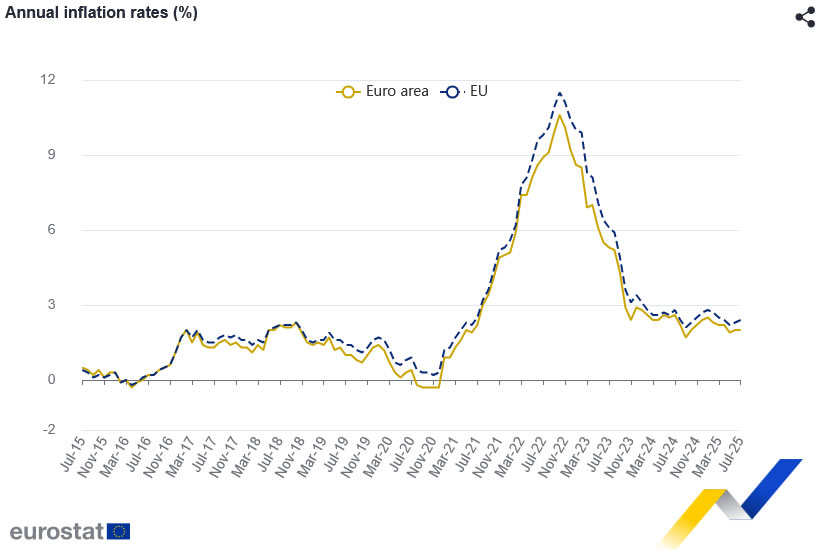
Eurozone CPI holds at 2%, core steady at 2.3%
Eurozone inflation dynamics showed little change in July, with headline CPI finalized at 2.0% yoy and core CPI at 2.3% yoy. Both were steady comparing to June’s readings.
Services remained the dominant driver, contributing +1.46 percentage points to annual inflation, followed by food, alcohol and tobacco at +0.63 pp. Non-energy industrial goods added a modest +0.18 pp, while energy subtracted -0.23 pp, highlighting that weak energy costs are still offsetting some domestic price persistence.
In contrast, the broader EU recorded a slight acceleration fro 2.3% yoy to 2.4% yoy. Country-level differences remain wide, with inflation near zero in Cyprus and below 1% in France, but still running above 6% in Romania.
UK CPI jumps to 3.8%, services inflation stays hot at 5%
UK inflation accelerated more than expected in July, with headline CPI rising to 3.8% yoy from 3.6% yoy, surpassing forecasts of 3.7% yoy and marking the highest level since early 2024. The biggest driver was transport costs, particularly higher airfares, which made the largest contribution to the monthly rise in annual rates.
Breakdown data showed broad-based strength. CPI goods inflation climbed to 2.7% yoy from 2.4% yoy, while CPI services surged to 5.0% yoy from 4.7% yoy. Meanwhile, core CPI edged up from 3.7% yoy to 3.8% yoy, topping expectations and matching the headline pace, highlighting persistent underlying pressures.
For BoE, the data poses a challenge. The uptick in both headline and core inflation risks slowing the recent easing cycle, as policymakers balance still-high inflation against weaker economic growth momentum. Markets may scale back expectations for near-term cuts if the stickiness persists.
GBP/AUD to clear 2.10, eyeing 2.16 as UK data lifts sterling, risk-off weighs on Aussie
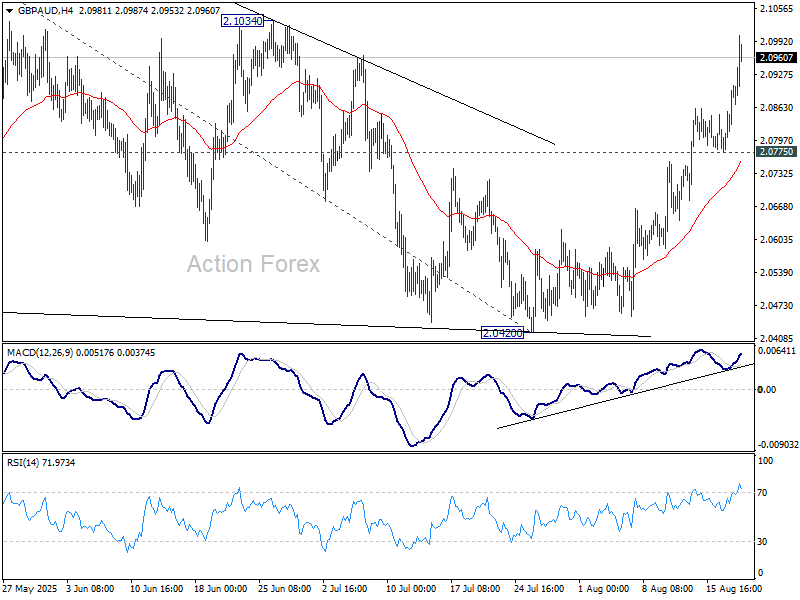
GBP/AUD pushed higher again today, extending its rebound from 2.0420 as Sterling found fresh support from hotter-than-expected UK inflation. The data have raised fresh doubts over whether BoE can cut again in November, shifting the near-term balance toward hawkish caution.
The backdrop is significant: BoE’s most recent 25bps cut to 4.00% was already a hawkishly split 5–4 decision. Today’s inflation release strengthens the case of hawks such as Chief Economist Huw Pill, potentially swaying some of the less dovish members of the MPC. While the staunchest doves like Alan Taylor may remain unmoved, the prospect of additional cuts is now less certain.
On the other side of the cross, the Australian Dollar is undermined by a mild risk-off tone in global markets. A bruising session for technology stocks yesterday saw the NASDAQ fall sharply, denting sentiment and prompting a rotation out of higher-beta sectors. Caution extended into Asia today, where the Nikkei posted a steep pullback.
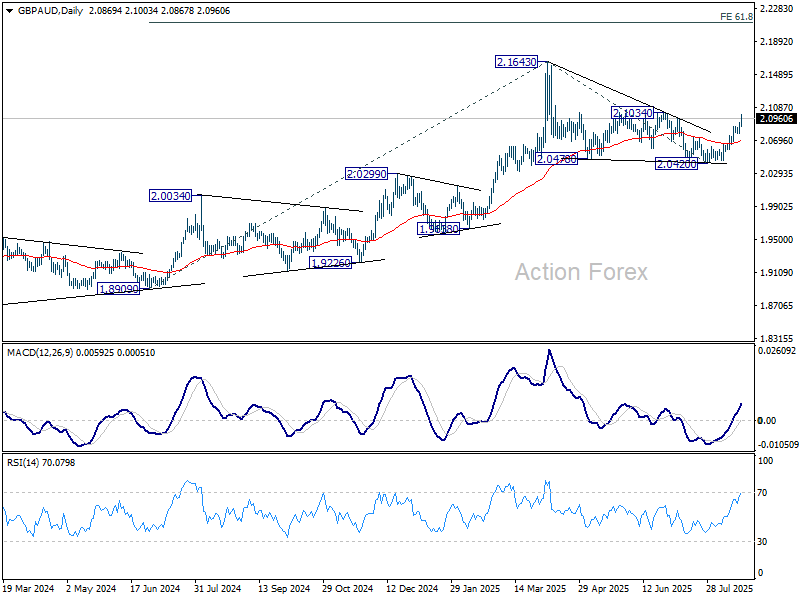
Technically, outlook is unchanged that GBP/AUD's correction from 2.1643 should have completed with three waves down to 2.0420. Firm break of 2.1034 resistance will solidify this bullish case and target a retest on 2.1643 high first. For now, outlook will stay cautiously bullish as long as 2.0775 support holds, in case of retreat.
RBNZ cuts, opens door to more
RBNZ delivered a 25bps cut to the Official Cash Rate, lowering it to 3.00% as widely expected. A more sizeable 50bps rate cut was discussed during the meeting. Policymakers maintained an easing bias, noting that “if medium-term inflation pressures continue to ease as expected, there is scope to lower the OCR further.”
The new projections point to the OCR dropping to 2.7% by Q4 2025, then settling between 2.5% and 2.6% in 2026 before edging back toward 2.7–2.8% in 2027. This outlook effectively signals room for one additional cut this year and another in early 2026.
The Bank highlighted ongoing slack in the economy and easing domestic inflation, projecting headline inflation to return to the 2% midpoint of target by mid-2026. However, New Zealand’s recovery has stalled, with household and business spending constrained by global policy uncertainty, weaker employment, higher costs for essentials, and falling house prices.
Japan exports slump -2.6% yoy in July, U.S. auto shipments hit hard
Japan’s exports fell -2.6% yoy in July to JPY 9.36 trillion, the sharpest drop since February 2021, driven by weaker demand from its two largest markets, the U.S. and China. Exports to the U.S. slid -10.1% yoy, with auto shipments plunging -28.4% yoy, a steeper decline than June’s -26.7%. Shipments to China also contracted -3.5% yoy, though exports to Hong Kong surged nearly 18% yoy.
The latest weakness highlights how external headwinds continue to weigh on Japan’s trade sector. While Tokyo reached a deal with Washington on July 22 to reduce reciprocal tariffs to 15% from 25%, the benefits will not be reflected until the August trade data. For now, auto exports remain a key drag on overall performance.
Imports fell -7.5% yoy to JPY 9.48 trillion, leaving Japan with a JPY 118 billion deficit. In seasonally adjusted terms, exports slipped -0.2% mom, while imports rose 0.4% mom, pushing the deficit wider to JPY 303 billion.
USD/JPY Mid-Day Outlook
Daily Pivots: (S1) 147.38; (P) 147.74; (R1) 148.04; More...
USD/JPY weakens today but stays well inside range of 146.20/148.51. Intraday bias remains neutral for the moment. On the upside, break of 148.51 will indicate that the pullback from 150.90 has completed, and bring retest of this high. This will also keep the whole rise from 139.87 alive. However, firm break of 145.84 support will argue that the rebound from 139.87 has completed, and turn near term outlook bearish.
In the bigger picture, price actions from 161.94 (2024 high) are seen as a corrective pattern to rise from 102.58 (2021 low). Decisive break of 61.8% retracement of 158.86 to 139.87 at 151.22 will argue that it has already completed with three waves at 139.87. Larger up trend might then be ready to resume through 161.94 high. In case the corrective pattern extends with another fall, strong support is expected from 38.2% retracement of 102.58 to 161.94 at 139.26 to bring rebound.
GBP/AUD to clear 2.10, eyeing 2.16 as UK data lifts sterling, risk-off weighs on Aussie
GBP/AUD pushed higher again today, extending its rebound from 2.0420 as Sterling found fresh support from hotter-than-expected UK inflation. The data have raised fresh doubts over whether BoE can cut again in November, shifting the near-term balance toward hawkish caution.
The backdrop is significant: BoE’s most recent 25bps cut to 4.00% was already a hawkishly split 5–4 decision. Today’s inflation release strengthens the case of hawks such as Chief Economist Huw Pill, potentially swaying some of the less dovish members of the MPC. While the staunchest doves like Alan Taylor may remain unmoved, the prospect of additional cuts is now less certain.
On the other side of the cross, the Australian Dollar is undermined by a mild risk-off tone in global markets. A bruising session for technology stocks yesterday saw the NASDAQ fall sharply, denting sentiment and prompting a rotation out of higher-beta sectors. Caution extended into Asia today, where the Nikkei posted a steep pullback.
Technically, outlook is unchanged that GBP/AUD's correction from 2.1643 should have completed with three waves down to 2.0420. Firm break of 2.1034 resistance will solidify this bullish case and target a retest on 2.1643 high first. For now, outlook will stay cautiously bullish as long as 2.0775 support holds, in case of retreat.
Nasdaq 100 Analysis: Tech Stocks Face Sell-Offs
As the chart shows, the Nasdaq 100 index (US Tech 100 mini on FXOpen) fell by approximately 1.6% yesterday.
According to media reports, bearish sentiment has been fuelled by the approach of key events:
→ the release of the FOMC meeting minutes (today at 21:00 GMT+3);
→ Jerome Powell’s speech at the Jackson Hole symposium on Friday. Market participants are preparing for remarks from the Fed Chair on the trajectory of interest rates.
Notably, the S&P 500 declined less significantly, while the Dow Jones remained virtually unchanged. This suggests that:
→ tech stocks are heavily overvalued due to AI-driven hype;
→ capital shifted yesterday from risk assets (including cryptocurrencies) into so-called safe havens.
Could tech stocks continue to decline?
Technical Analysis of the Nasdaq 100 (US Tech 100 mini on FXOpen)
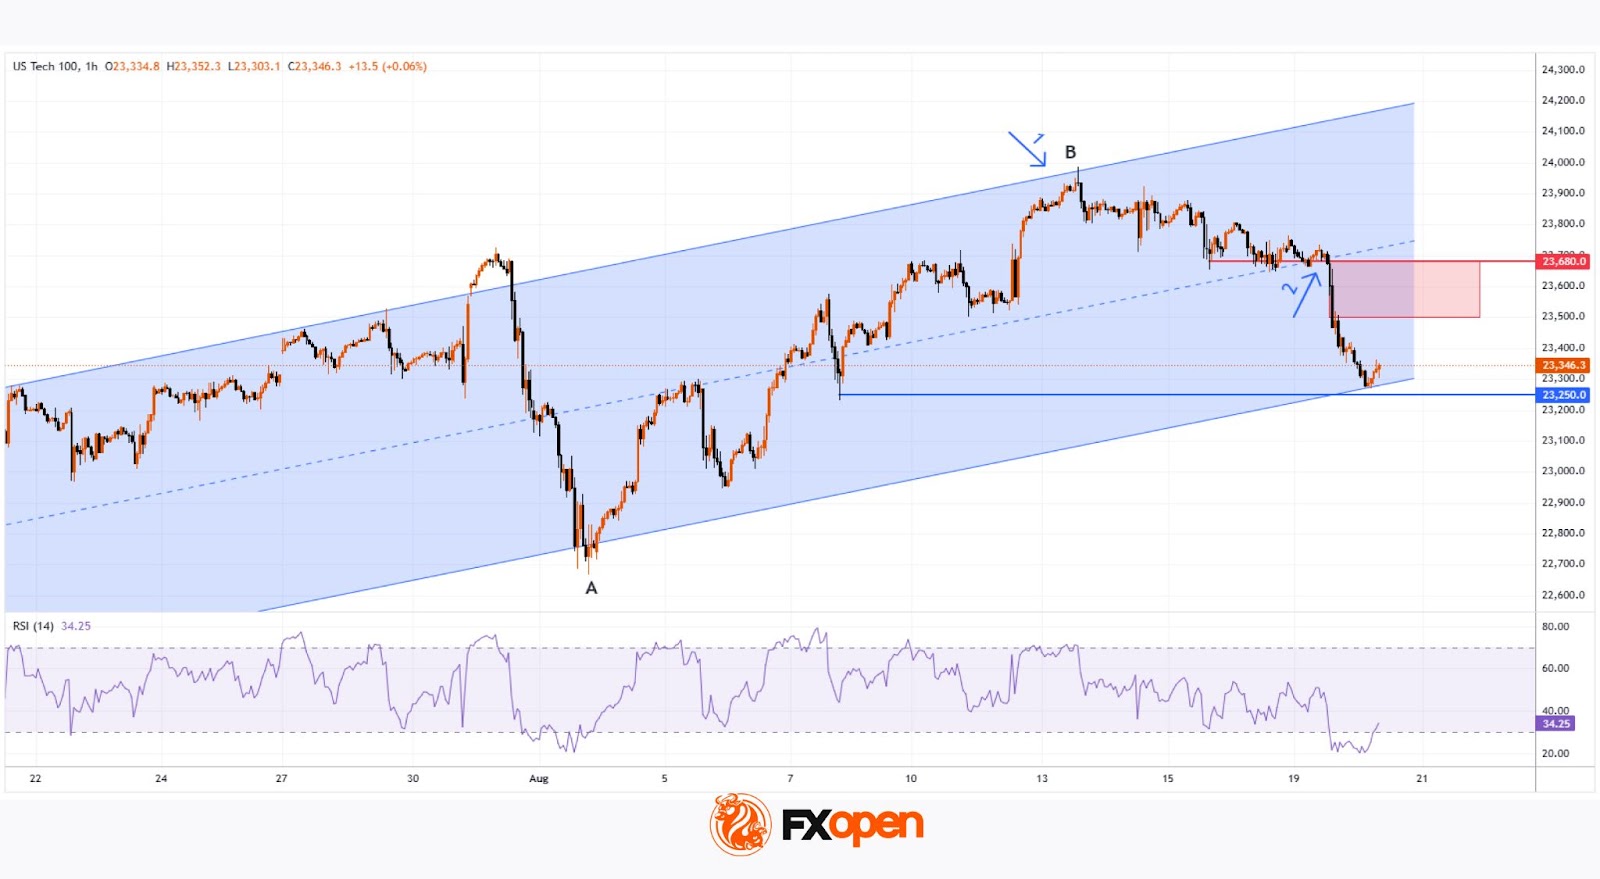
Analysing the Nasdaq 100 index chart (US Tech 100 mini on FXOpen) on 5 August, we plotted the main upward channel (shown in blue). It remains valid, as since then the price has:
1→ reached the upper boundary, which (as often happens) acted as resistance;
2→ retreated to the median line, where volatility decreased (a sign of balance between supply and demand), but only briefly.
Yesterday’s low coincided with the lower boundary of the channel.
From a bullish perspective, buyers might rely on:
→ a resumption of the uptrend from the lower boundary (as was the case in early August);
→ support at the 50% retracement level after the A→B impulse (located around the current price area);
→ a rebound from the oversold zone indicated by the RSI;
→ support at the 7 August low of 23,250 (a false bearish breakout remains possible).
On the other hand: the price has confidently broken through the channel median and then accelerated downwards (a sign of imbalance in favour of sellers). This imbalance zone (which, under the Smart Money Concept methodology, is considered a bearish Fair Value Gap) could act as resistance going forward.
Given the pace of yesterday’s decline, we could assume that sellers currently hold the initiative. Should we see weak rebounds (in the style of a dead cat bounce) from the channel’s lower boundary, the likelihood of a bearish breakout could increase.
Trade global index CFDs with zero commission and tight spreads. Open your FXOpen account now or learn more about trading index CFDs with FXOpen.
This article represents the opinion of the Companies operating under the FXOpen brand only. It is not to be construed as an offer, solicitation, or recommendation with respect to products and services provided by the Companies operating under the FXOpen brand, nor is it to be considered financial advice.
Eurozone CPI holds at 2%, core steady at 2.3%
Eurozone inflation dynamics showed little change in July, with headline CPI finalized at 2.0% yoy and core CPI at 2.3% yoy. Both were steady comparing to June's readings.
Services remained the dominant driver, contributing +1.46 percentage points to annual inflation, followed by food, alcohol and tobacco at +0.63 pp. Non-energy industrial goods added a modest +0.18 pp, while energy subtracted -0.23 pp, highlighting that weak energy costs are still offsetting some domestic price persistence.
In contrast, the broader EU recorded a slight acceleration fro 2.3% yoy to 2.4% yoy. Country-level differences remain wide, with inflation near zero in Cyprus and below 1% in France, but still running above 6% in Romania.
ECB’s Lagarde: EU–US trade deal offers relief but risks still hang over sectoral tariffs
Speaking today, ECB President Christine Lagarde said growth in the Eurozone is expected to weaken in Q3 as earlier tariff-related frontloading unwinds.
A key factor is the new EU–U.S. trade deal, which implies an effective tariff rate of 12–16% on EU goods entering the U.S. Lagarde stressed it is "still close to" the June baseline scenarios, and remains below the severe scenario of tariffs exceeding 20% that staff had also considered.
Nevertheless, "uncertainty persists as sector-specific tariffs on pharmaceuticals and semiconductors remain unclear", she added.
Lagarde confirmed ECB will incorporate the updated tariff framework into its September projections, which will help shape policy decisions in the coming months.