Sample Category Title
USDJPY Declines: Market Unfazed by Weak Japanese Statistics
On Wednesday, the USDJPY pair consolidated near 147.50, extending the previous session's decline, despite weak Japanese foreign trade figures.
Exports dropped by 2.6% y/y in July, marking the steepest decline in over four years, largely due to pressure from US tariffs. Imports fell by 7.5%, the fourth drop since the beginning of the year. However, the data still came in better than expectations, which pointed to a 10.4% decline.
In contrast, equipment orders — a proxy for capital investment — rose unexpectedly in June, following two months of contraction, signalling some resilience in corporate spending.
Meanwhile, investors remain uncertain about the Bank of Japan’s future steps. Governor Kazuo Ueda maintains a cautious stance, highlighting that core inflation is still below the 2.0% target.
The yen has also seen temporary demand as a safe-haven asset, supporting its appreciation.
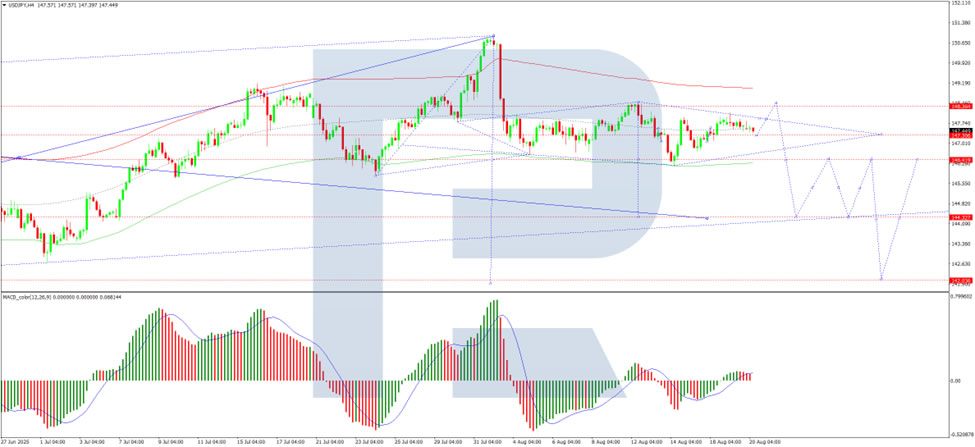
Technical analysis of USDJPY
On the H4 USDJPY chart, the market continues to develop a downward wave towards 146.14. This level is expected to be reached today. A temporary rebound to 147.30 cannot be ruled out. Following that, we anticipate a further decline to 145.45, with the potential for the trend to extend to 144.30. The target remains local. This bearish scenario is technically supported by the MACD indicator, whose signal line is below zero and pointing strictly downwards, indicating ongoing downside momentum.
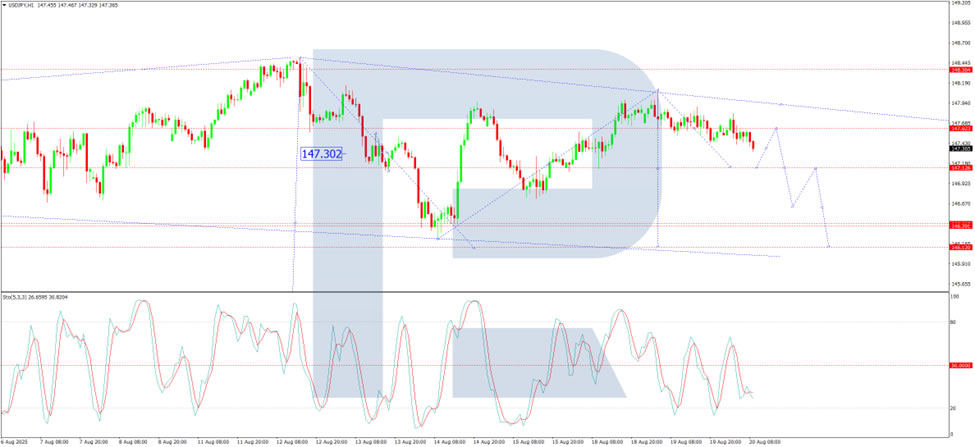
On the H1 chart, the market is shaping a downward wave structure towards 146.12. Today, we are considering a short-term move to 147.12, followed by a potential growth link to 147.60. After that, the market is likely to decline again to 146.60, and further to 146.12, continuing the bearish trend. The Stochastic oscillator confirms this view, with its signal line below the 50 level, directed sharply towards 20, reflecting a strong bearish bias.
Summary
Despite weak trade statistics, USDJPY is falling amid resilient investment data and growing demand for the yen as a safe-haven. Technical indicators point towards a continued downward trend, with key targets at 146.14, 145.45, and 144.30, while any rebounds are likely to remain temporary.
Bitcoin (BTCUSD) Elliott Wave: Forecasting the Path
Hello fellow traders.
As our members know, we’ve been long in Bitcoin. The crypto has made a solid rally toward new all-time highs, gaining more than 20% since our entry on the June 22nd. In this technical article, we are going to present short term Elliott Wave forecast of BTCUSD. We were calling for a short-term weakness within the pullback against the 111,984 low.
BTCUSD Elliott Wave 1 Hour Weekend Chart 08.17.2025
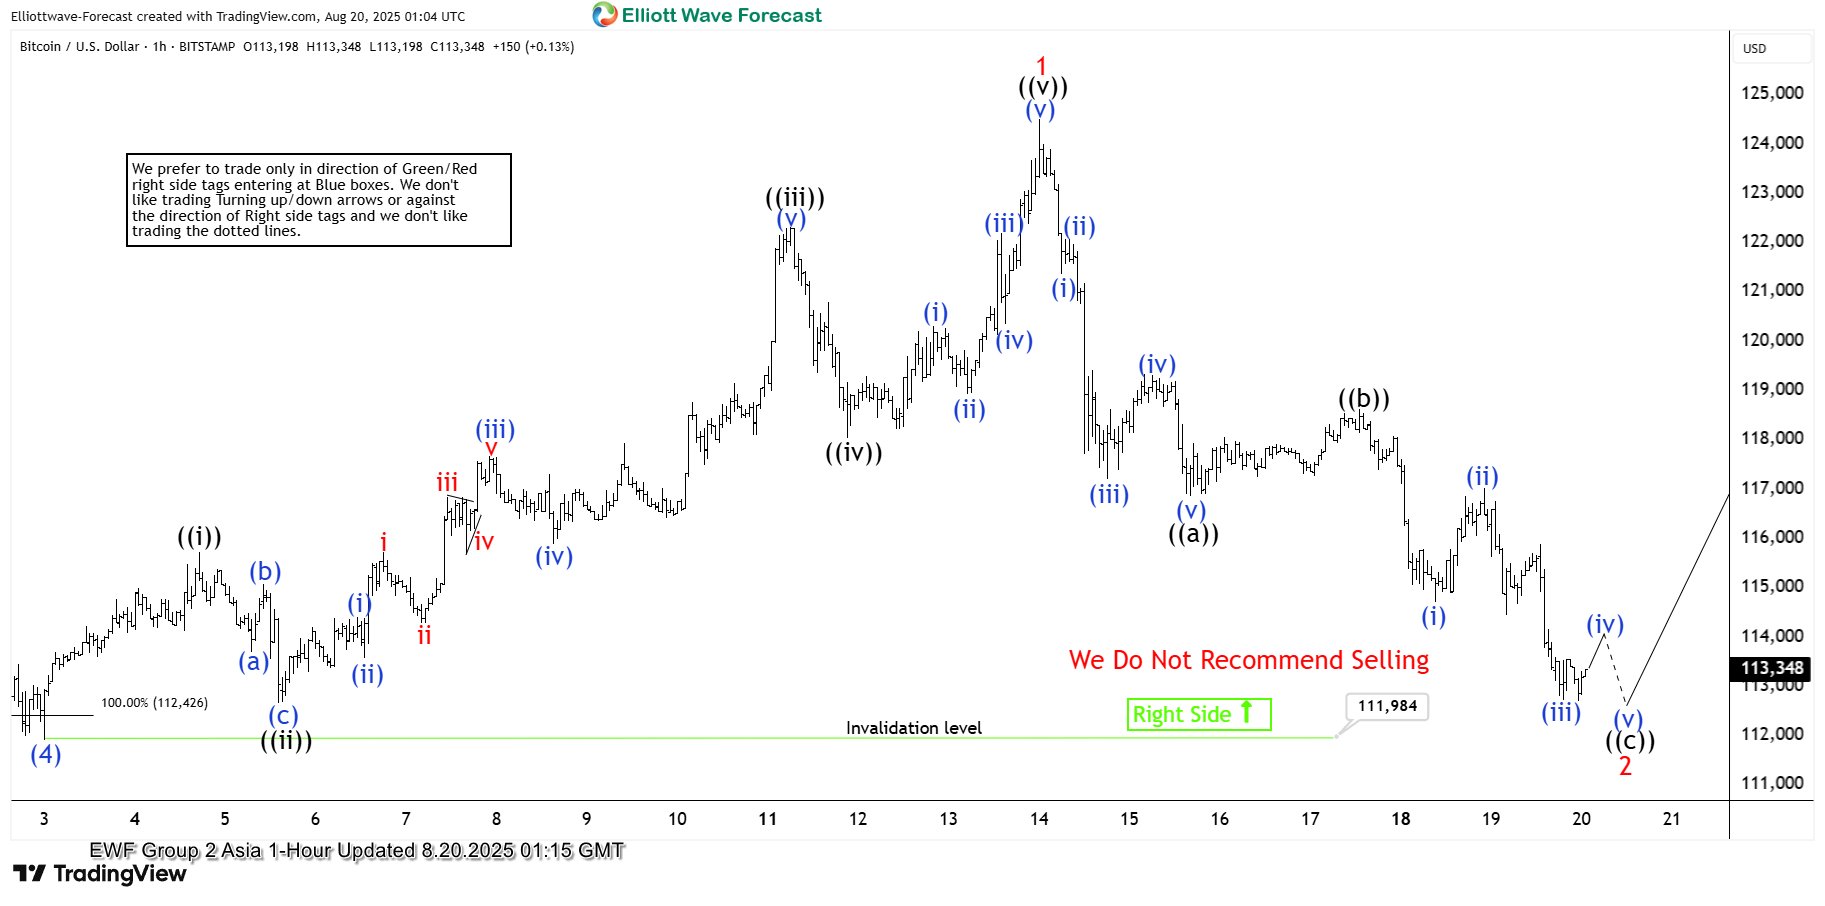
Current view suggests Bitcoin is doing a correction against the 111,984 low. We can count clear 5 waves in the drop from the peak which indicates we have got most likely on the first leg of pull back thaat is unfolding as a Zig Zag 5-3-5 structure. So,we expect another leg down to retest the 111,984 low.
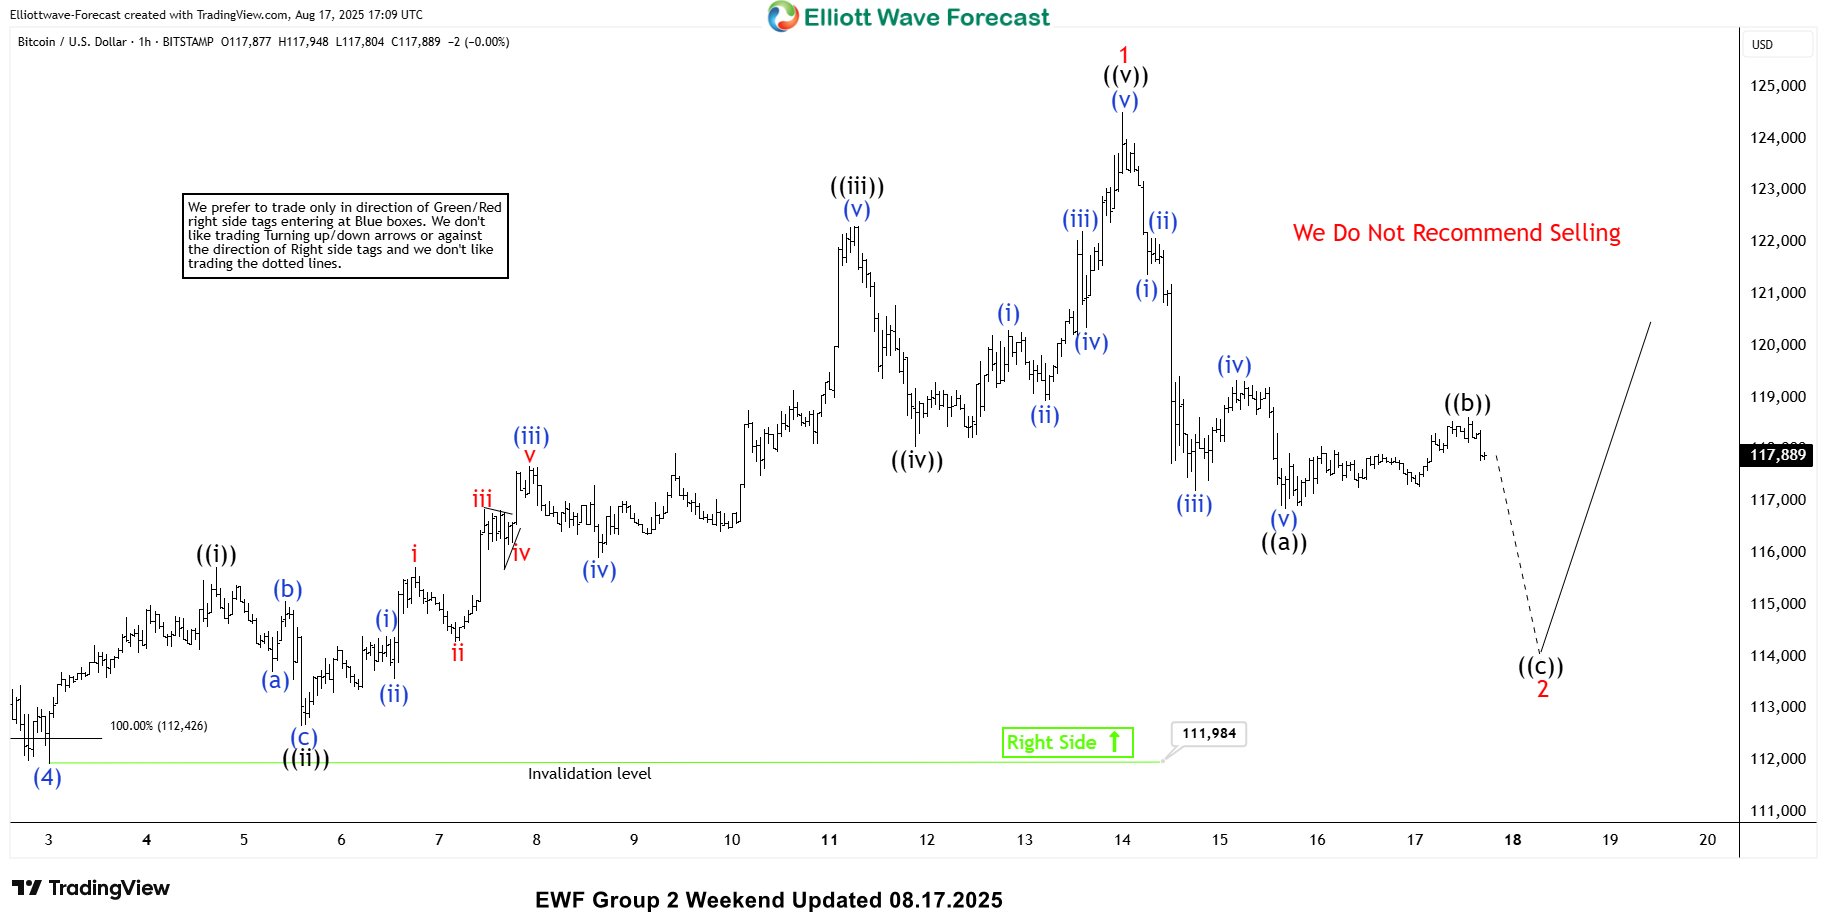
BTCUSD Elliott Wave 1 Hour Weekend Chart 08.17.2025
Bitcoin made the drop as expected. So far, we can count only three waves from the peak, which is an incomplete structure for the ((c)) leg. We expect a short-term bounce followed by a final push down to complete five waves in the ((c)) leg. If the price breaks below the 111,984 low, it will invalidate the Elliott Wave count.
EURUSD Trading Setup Explained : Buying the Dips in the Blue Box
As our members know we have had many profitable trading setups recently. In this technical article, we are going to talk about another Elliott Wave trading setup we got in EURUSD. The pair has completed its correction exactly at the Equal Legs zone, also known as the Blue Box Area. In this article, we’ll break down the Elliott Wave forecast, explain the trading setup in detail, and provide the upside target.
EURUSD Elliott Wave 4 Hour Chart 07.28.2025
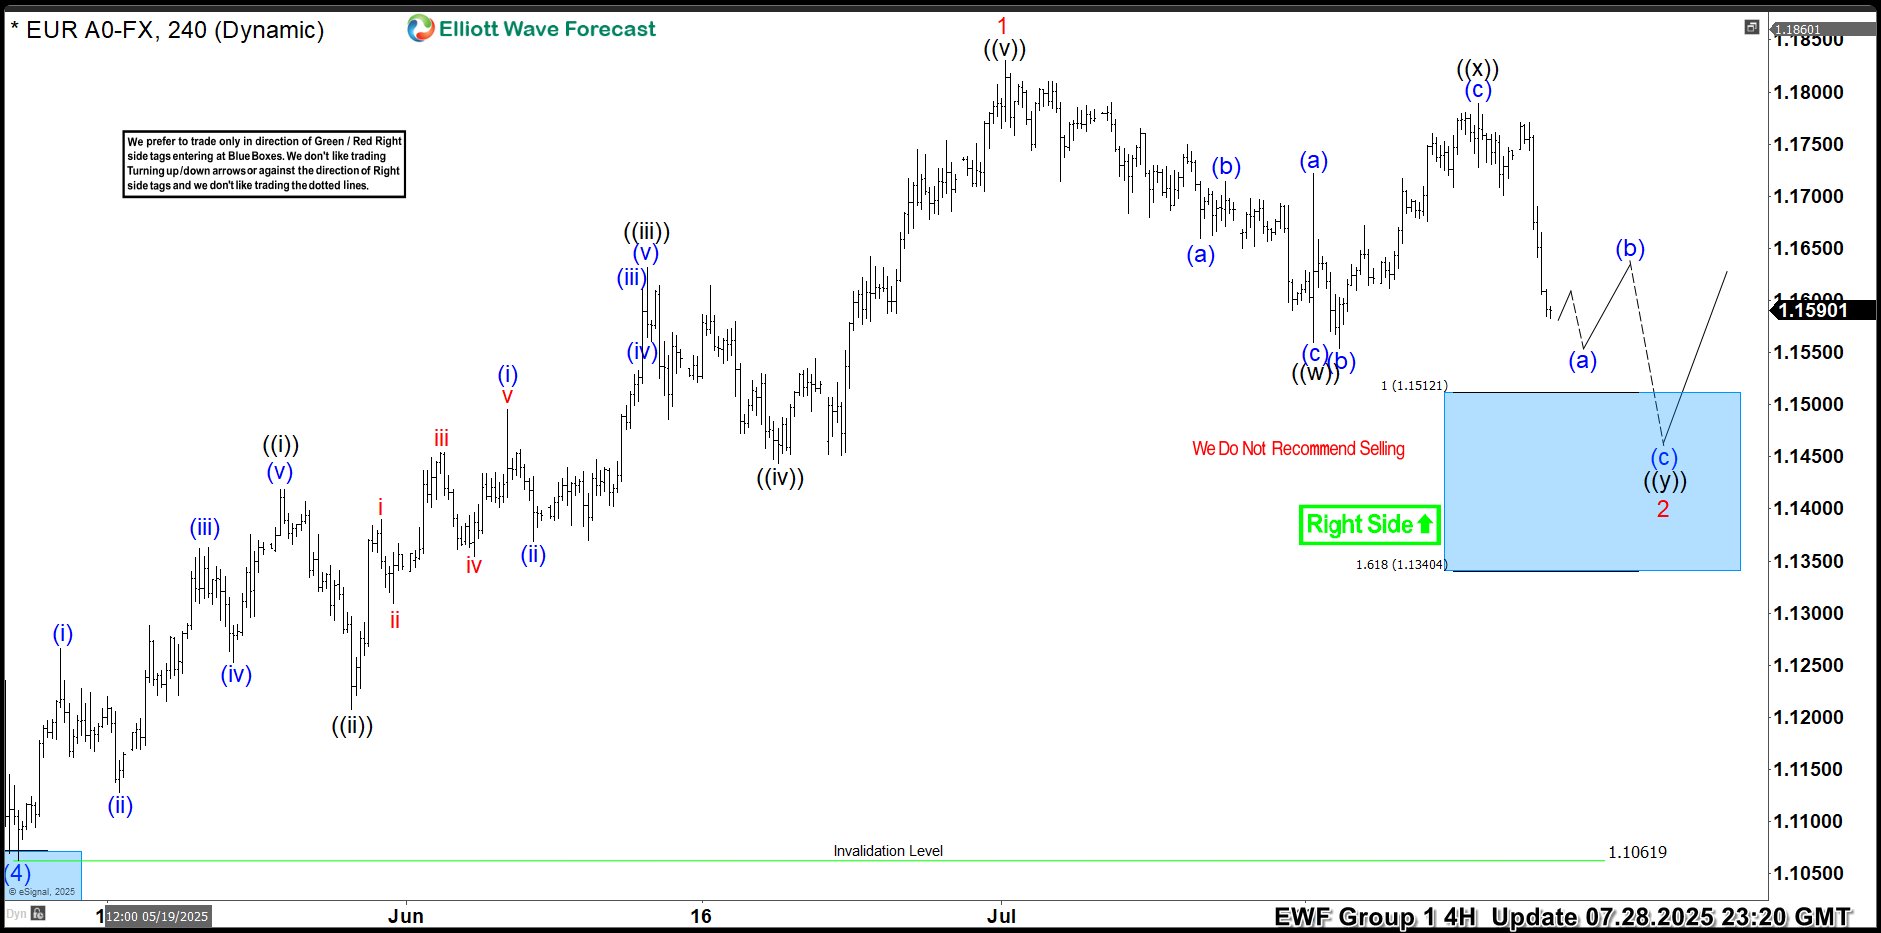
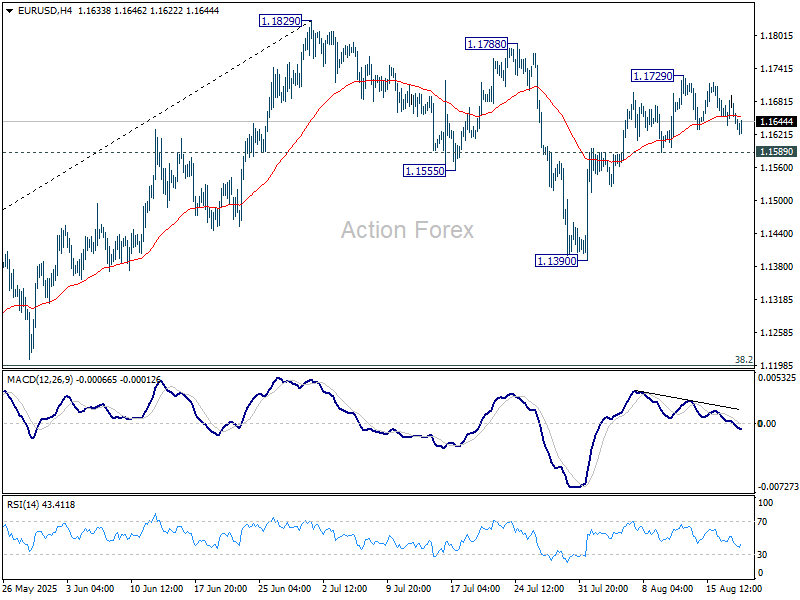
EURUSD is forming a 3 waves pullback against the 1.10619 low. While price remains below the red ((x)) connector, we believe the correction is still in progress and expect another leg lower toward the 1.1512-1.1340 area , where we are looking to re-enter as buyers. We recommend that members avoid selling EURUSD. We expect at least a three-wave bounce from the Blue Box area.Once the price reaches the 50% Fibonacci retracement against the black ((x)) connector, we will make the position risk-free by moving the stop loss to breakeven and booking partial profits.
EURUSD Elliott Wave 4 Hour Chart 08.19.2025
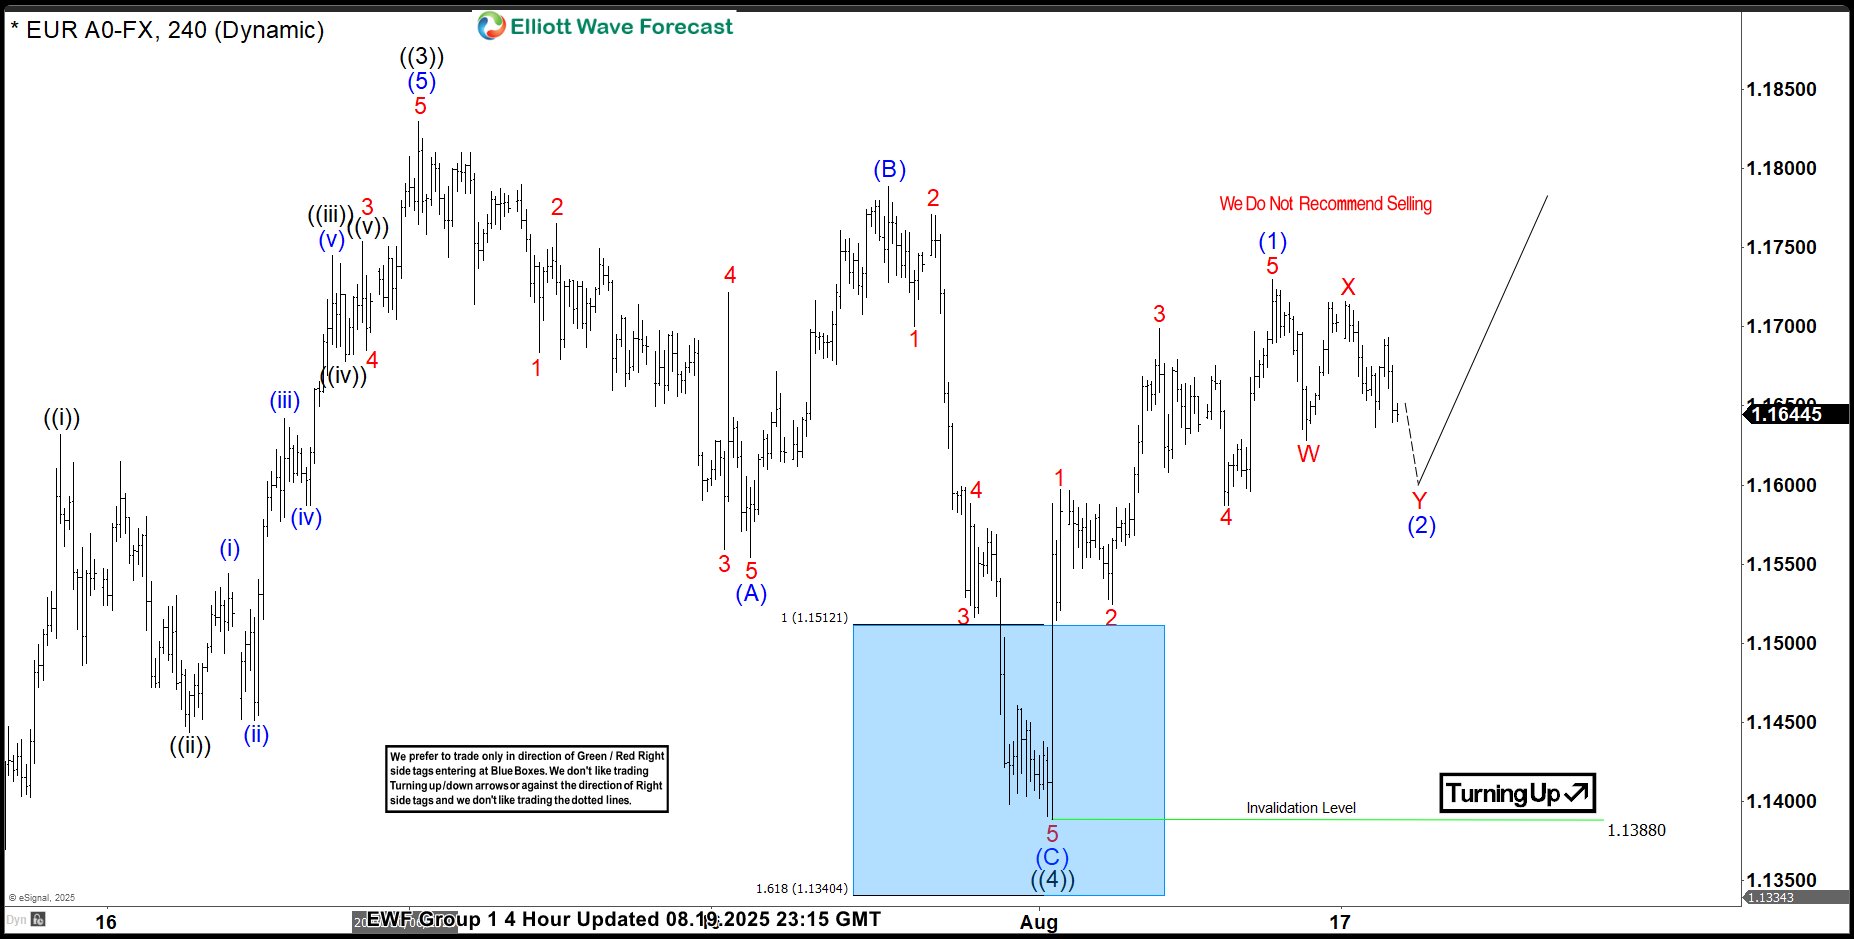
The pair has made drop toward our buying zone- Blue Box area. EURUSD found buyers as expected, making decent reaction. The rally from from the buying zone has exceeded 50 fibs against the (B) blue connector. Consequently, any long positions from the Blue Box should now be risk-free. We’ve set our stop loss at breakeven and have already secured partial profits. While price holds above 1.1388, we consider the wave ((4)) correction complete and see potential for wave ((5)) to be in progress toward new highs.
Short term : rally from the 1.1388 low shows 5 waves structure. Currently the pair is doing a 3 waves pull back which can complete around 1.1620-1.1559 area.
EUR/USD Dips Again While USD/JPY Aims Fresh Surge
EUR/USD declined from 1.1720 and traded below 1.1650. USD/JPY is rising and might gain pace above 148.20.
Important Takeaways for EUR/USD and USD/JPY Analysis Today
- The Euro started a fresh decline after a decent move above 1.1680.
- There was a break below a key bullish trend line with support at 1.1650 on the hourly chart of EUR/USD at FXOpen.
- USD/JPY climbed higher above the 147.00 and 147.40 levels.
- There is a major bearish trend line forming with resistance at 147.70 on the hourly chart at FXOpen.
EUR/USD Technical Analysis
On the hourly chart of EUR/USD at FXOpen, the pair rallied above the 1.1680 resistance zone before the bears appeared, as discussed in the previous analysis. The Euro started a fresh decline and traded below 1.1660 against the US Dollar.
There was a break below a key bullish trend line with support at 1.1650, and a low was formed near 1.1622. After that, the pair started a consolidation phase.
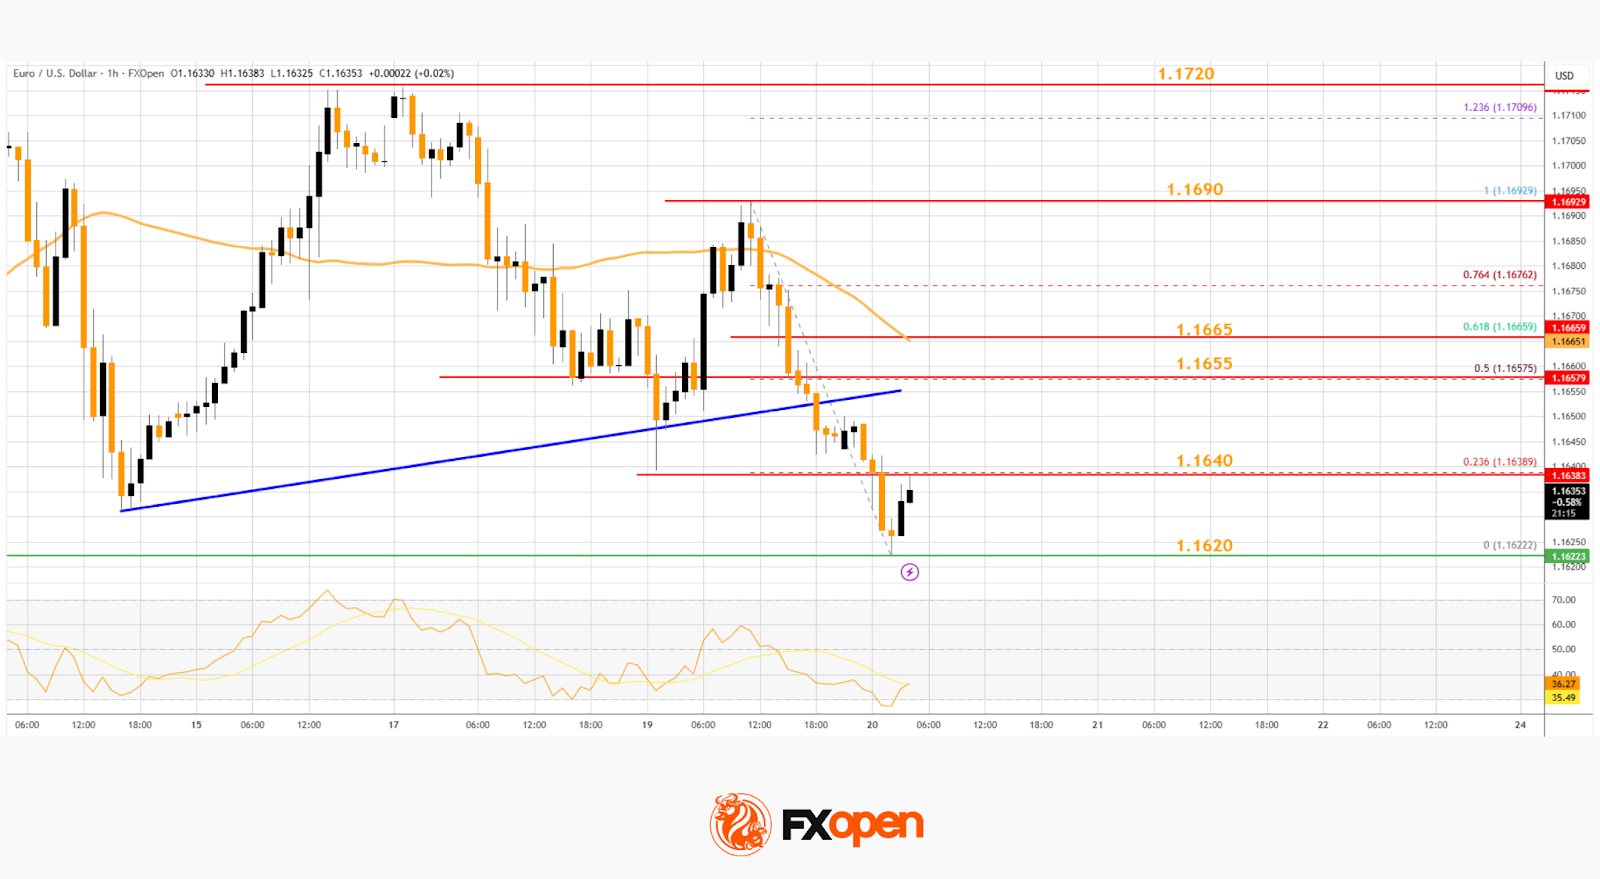
There was a minor recovery wave above 1.1630. EUR/USD is now trading below 1.1650 and the 50-hour simple moving average. On the upside, the pair is now facing hurdles near the 23.6% Fib retracement level of the downward move from the 1.1692 swing high to the 1.1622 low at 1.1640.
The next key resistance is 1.1655 and the 50% Fib retracement. The main barrier for the bulls could be 1.1665. A clear move above 1.1665 could send the pair toward 1.1690. An upside break above 1.1690 could set the pace for another increase. In the stated case, the pair might rise toward the 1.1720 zone.
If not, the pair might resume its decline. The first major support on the EUR/USD chart is near 1.1620. The next important region for buyers sits at 1.1600. If there is a downside break below 1.1600, the pair could drop toward 1.1550. Any more losses might send the pair toward 1.1500.
USD/JPY Technical Analysis
On the hourly chart of USD/JPY at FXOpen, the pair started a fresh upward move from 146.20. The US Dollar gained bullish momentum above 146.50 against the Japanese Yen.
It even cleared the 50-hour simple moving average and 147.50. The pair climbed above 148.00 and traded as high as 148.10. It’s now consolidating gains above the 50% Fib retracement level of the upward move from the 146.73 swing low to the 148.10 high.
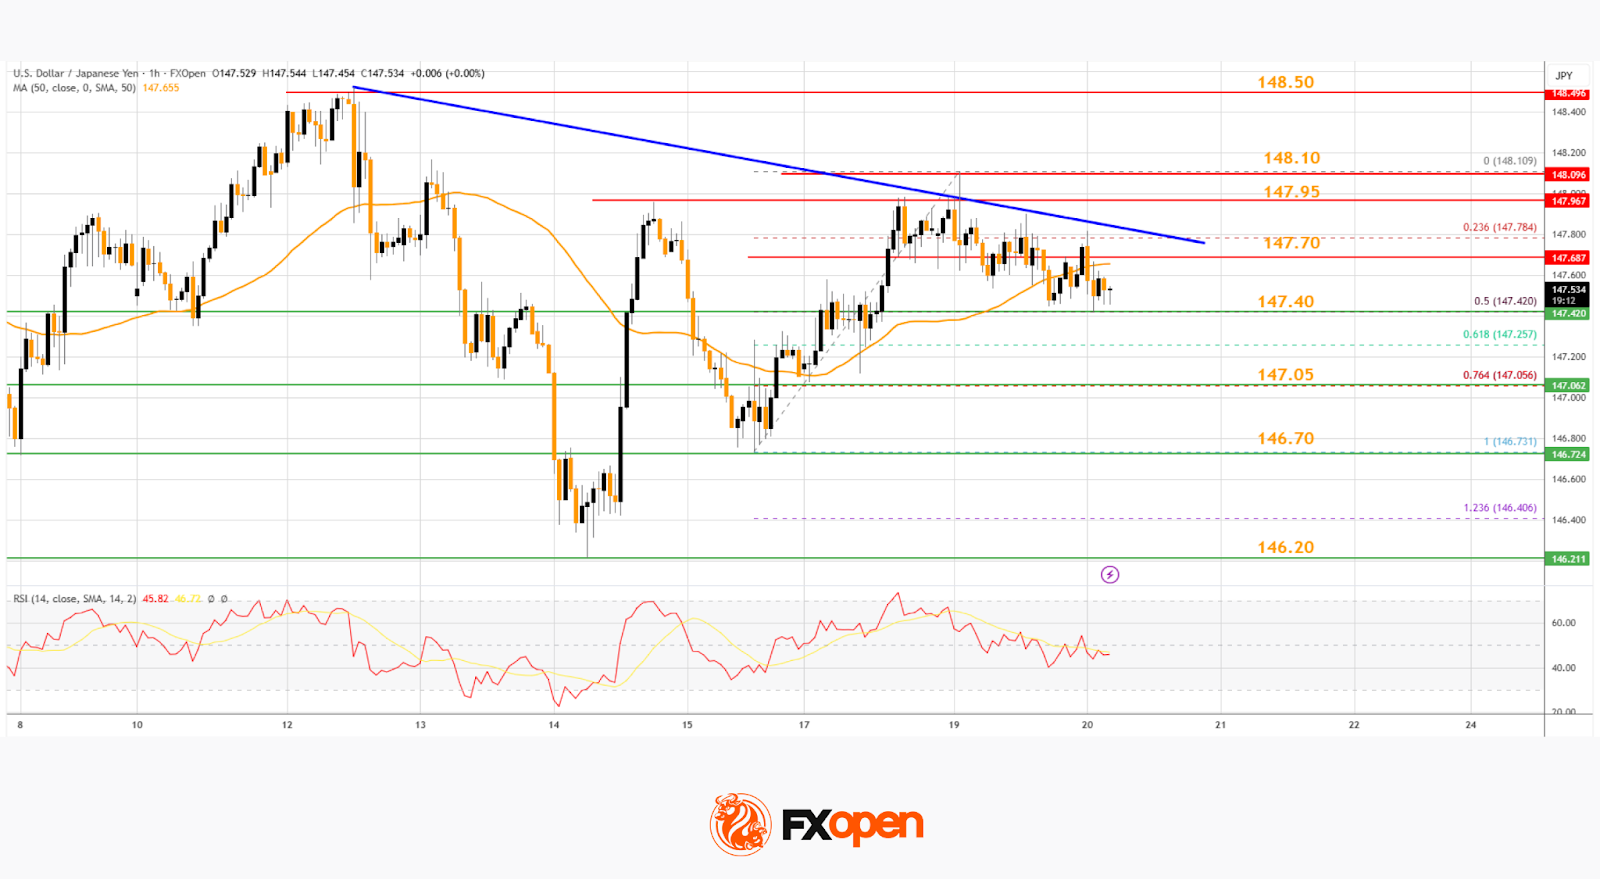
The current price action above 147.40 is positive. Immediate resistance on the USD/JPY chart is near a bearish trend line at 147.70 and the 50-hour simple moving average.
The first key hurdle is near 147.95. If there is a close above 147.95 and the RSI moves above 50, the pair could rise toward 148.10. The next major stop for the bulls could be 148.50, above which the pair could test 150.00 in the coming days.
On the downside, the first major support is 147.40. The next area of interest for buyers could be near the 76.4% Fib retracement at 147.05.
If there is a close below 147.05, the pair could decline steadily. In the stated case, the pair might drop toward 146.20. Any more losses might open the doors for a drop to 145.00.
Trade over 50 forex markets 24 hours a day with FXOpen. Take advantage of low commissions, deep liquidity, and spreads from 0.0 pips. Open your FXOpen account now or learn more about trading forex with FXOpen.
This article represents the opinion of the Companies operating under the FXOpen brand only. It is not to be construed as an offer, solicitation, or recommendation with respect to products and services provided by the Companies operating under the FXOpen brand, nor is it to be considered financial advice.
EUR/USD Daily Outlook
Daily Pivots: (S1) 1.1627; (P) 1.1660; (R1) 1.1681; More...
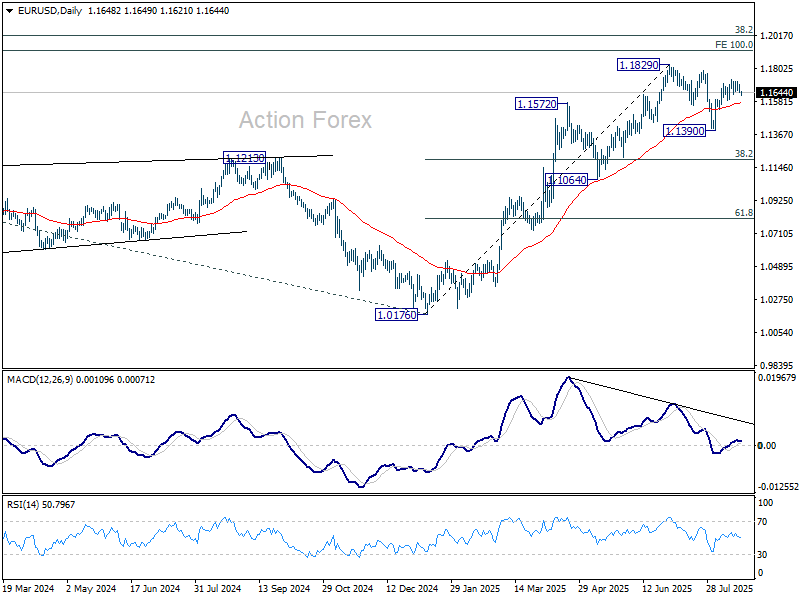
No change in EUR/USD's outlook as range trading continues and intraday bias remains neutral. Further rally is expected as long as 1.1589 support holds. Above 1.1729 will bring retest of 1.1829 high. On the downside, however, firm break of 1.1589 will turn bias to the downside, and extend the corrective pattern from 1.1829 with another fall.
In the bigger picture, rise from 0.9534 long term bottom could be correcting the multi-decade downtrend or the start of a long term up trend. In either case, further rise should be seen to 100% projection of 0.9534 to 1.1274 from 1.0176 at 1.1916. This will remain the favored case as long as 1.1604 support holds.
USD/JPY Daily Outlook
Daily Pivots: (S1) 147.38; (P) 147.74; (R1) 148.04; More...
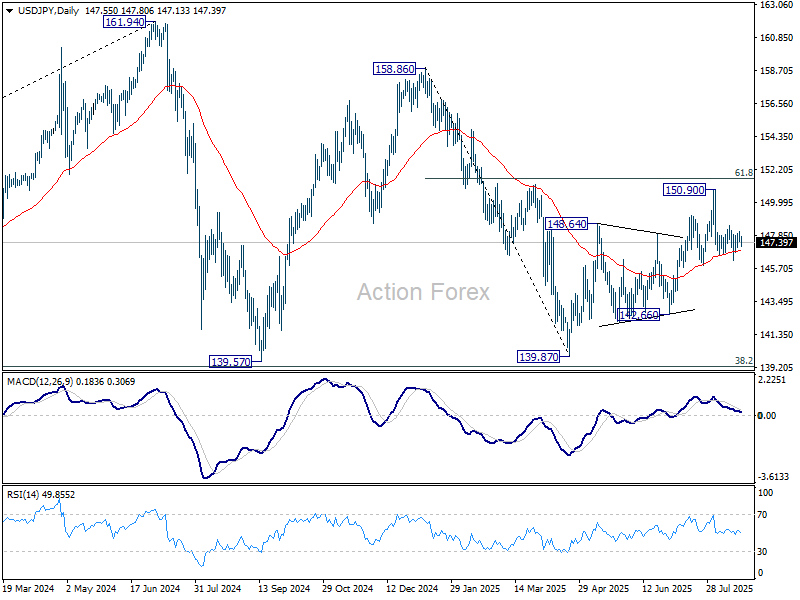
USD/JPY is still bounded in range of 146.20/148.51 and intraday bias remains neutral. On the upside, break of 148.51 will indicate that the pullback from 150.90 has completed, and bring retest of this high. This will also keep the whole rise from 139.87 alive. However, firm break of 145.84 support will argue that the rebound from 139.87 has completed, and turn near term outlook bearish.

In the bigger picture, price actions from 161.94 (2024 high) are seen as a corrective pattern to rise from 102.58 (2021 low). Decisive break of 61.8% retracement of 158.86 to 139.87 at 151.22 will argue that it has already completed with three waves at 139.87. Larger up trend might then be ready to resume through 161.94 high. In case the corrective pattern extends with another fall, strong support is expected from 38.2% retracement of 102.58 to 161.94 at 139.26 to bring rebound.
GBP/USD Daily Outlook
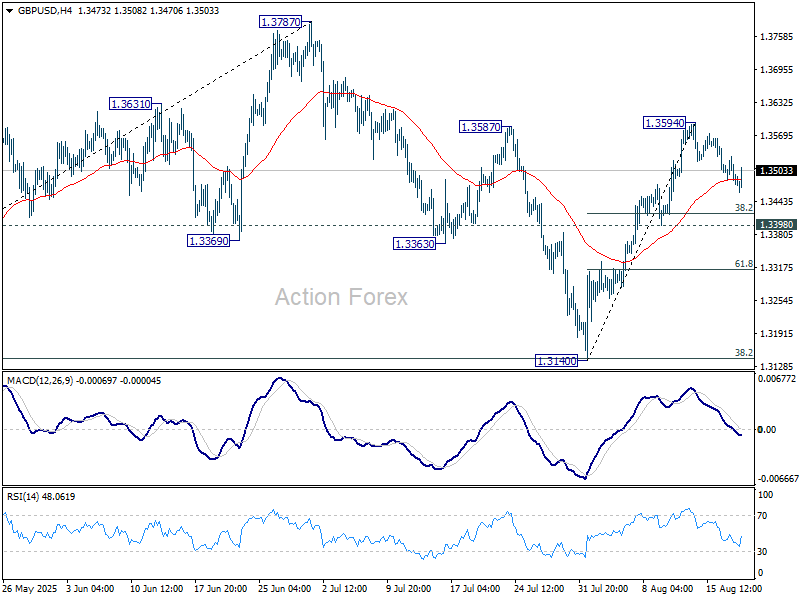
Daily Pivots: (S1) 1.3469; (P) 1.3500; (R1) 1.3522; More...
No change in GBP/USD's outlook as correction from 1.3594 is still extending. Intraday bias remains neutral. Deeper retreat might be seen but downside should be contained well above 1.3398 support. On the upside, break of 1.3594 will resume the rise from 1.3140 to retest 1.3787 high.
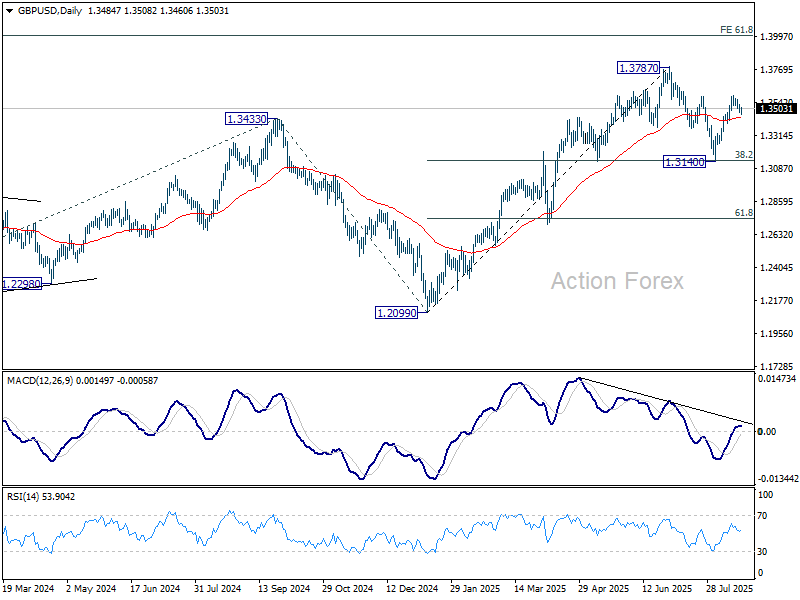
In the bigger picture, up trend from 1.3051 (2022 low) is in progress. Next medium term target is 61.8% projection of 1.0351 to 1.3433 from 1.2099 at 1.4004. Outlook will now stay bullish as long as 55 W EMA (now at 1.3090) holds, even in case of deep pullback.
USD/CHF Daily Outlook
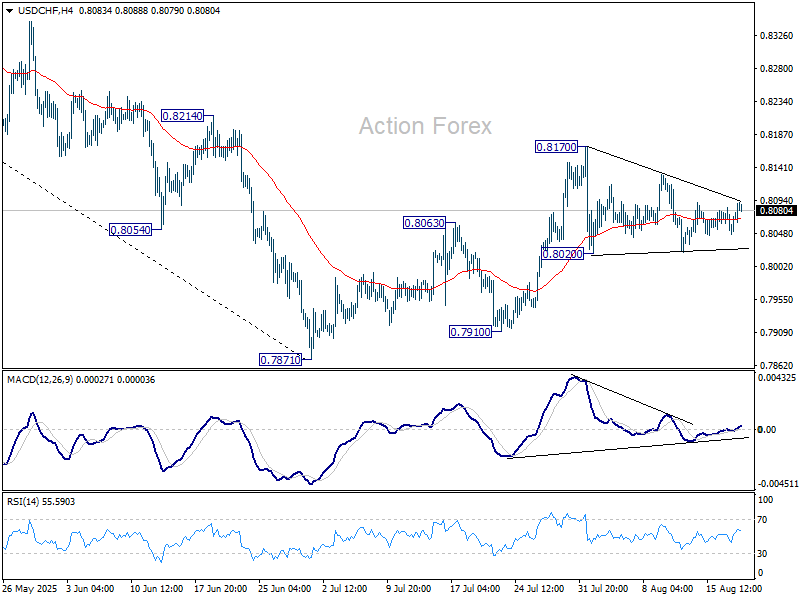
Daily Pivots: (S1) 0.8055; (P) 0.8070; (R1) 0.8094; More….
No change in USD/CHF's outlook as range trading continues. On the downside, break of 0.8020 will revive that case that the corrective pattern from 0.7871 has completed, and target a retest on 0.7871 low. On the upside, firm break of 0.8710 will resume the corrective from 0.7871. Intraday bias will be back on the upside for 38.2% retracement of 0.9200 to 0.7871 at 0.8379.
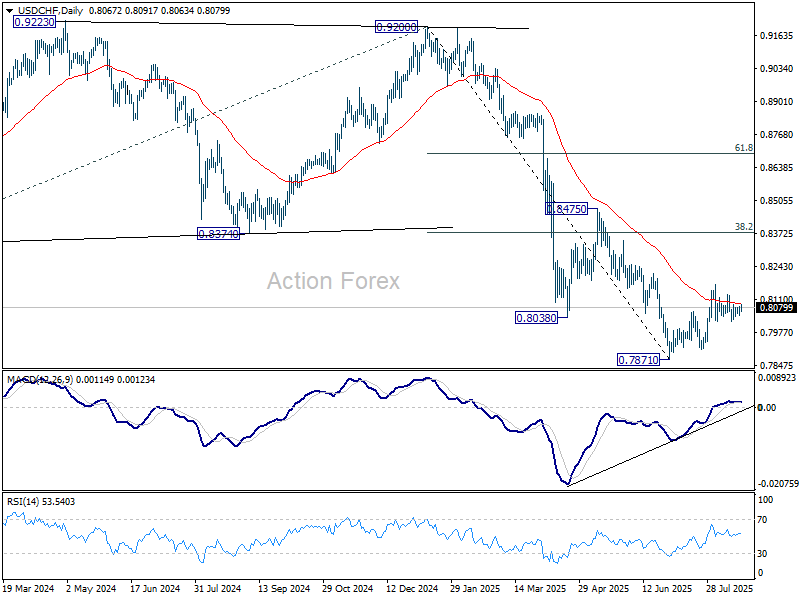
In the bigger picture, long term down trend from 1.0342 (2017 high) is still in progress. Next target is 100% projection of 1.0146 (2022 high) to 0.8332 from 0.9200 at 0.7382. In any case, outlook will stay bearish as long as 0.8475 resistance holds.
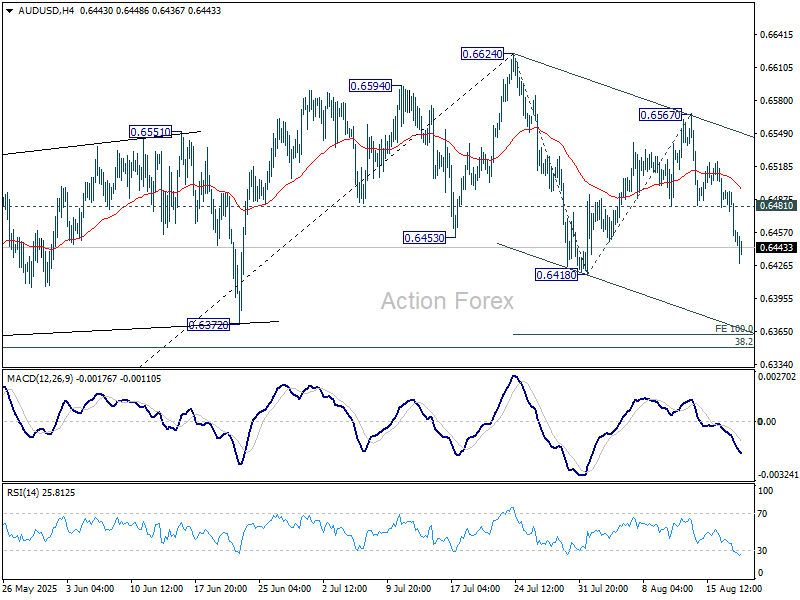
AUD/USD Daily Report
Daily Pivots: (S1) 0.6436; (P) 0.6468; (R1) 0.6487; More...
Intraday bias in AUD/USD is back on the downside with strong break of 0.6481 support. Corrective fall from 0.6624 should be resuming. Break of 0.6418 will target 38.2% retracement of 0.5913 to 0.6624 at 0.6352. On the upside, above 0.6481 support turned resistance will turn intraday bias neutral again first.
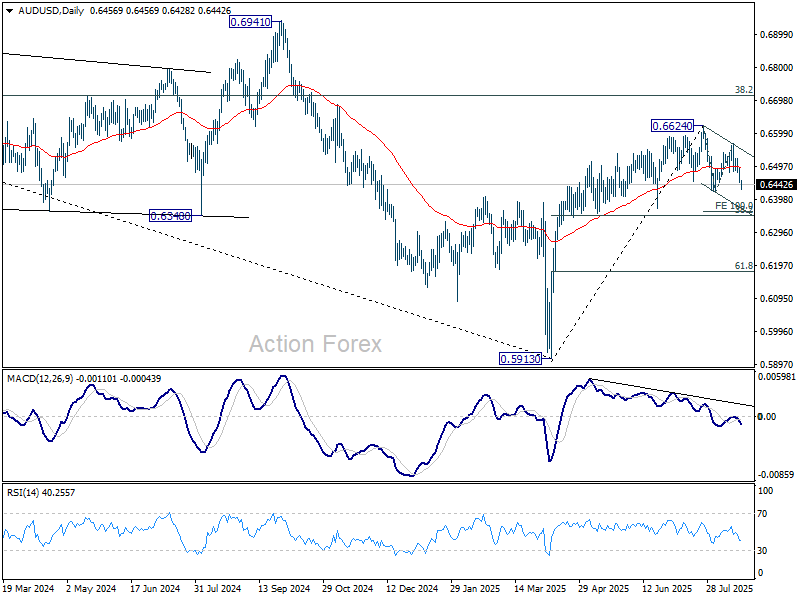
In the bigger picture, there is no clear sign that down trend from 0.8006 (2021 high) has completed. Rebound from 0.5913 is seen as a corrective move. While stronger rally cannot be ruled out, outlook will remain bearish as long as 38.2% retracement of 0.8006 to 0.5913 at 0.6713 holds. Nevertheless, considering bullish convergence condition in W MACD, even in case of another fall through 0.5913, downside should be contained above 0.5506 (2020 low).
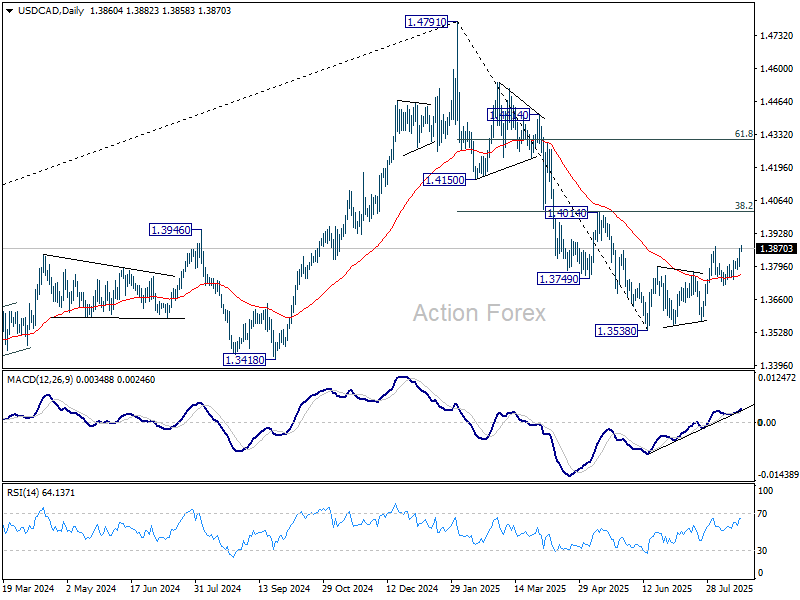
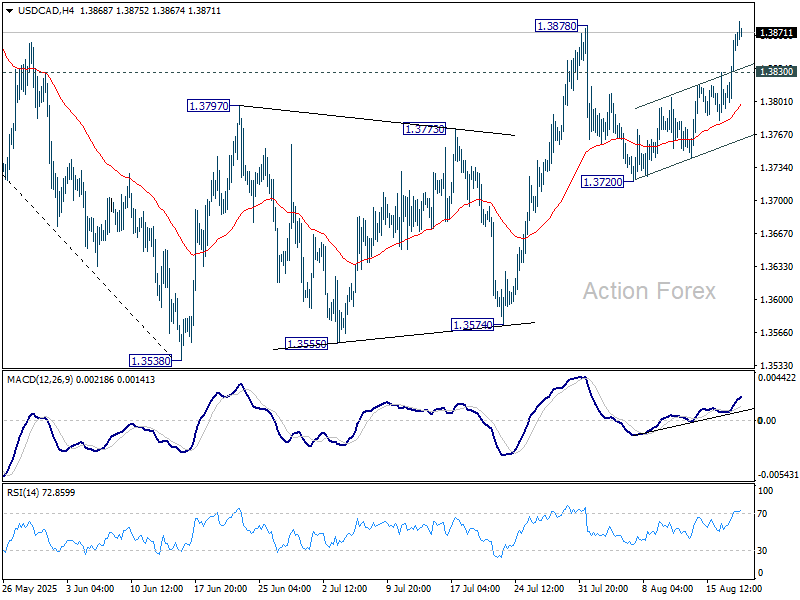
USD/CAD Daily Outlook
Daily Pivots: (S1) 1.3820; (P) 1.3845; (R1) 1.3893; More...
USD/CAD's upside acceleration and breach of 1.3878 resistance suggests that rebound from 1.3538 is resuming. Intraday bias is now on the upside. Sustained trading above 1.3878 will target 1.4014 cluster resistance (38.2% retracement of 1.4791 to 1.3538 at 1.4017). Strong resistance should be seen there to complete the corrective bounce. On the downside, below 1.3830 minor support will turn intraday bias neutral again first.
In the bigger picture, price actions from 1.4791 medium term top could either be a correction to rise from 1.2005 (2021 low), or trend reversal. In either case, further decline is expected as long as 1.4014 resistance holds. Next target is 61.8% retracement of 1.2005 (2021 low) to 1.4791 at 1.3069.