Sample Category Title
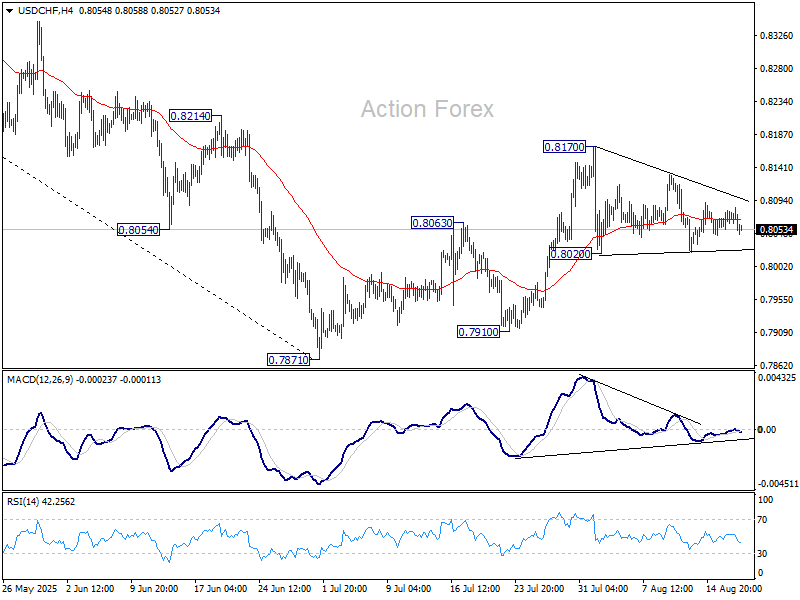
USD/CHF Mid-Day Outlook
Daily Pivots: (S1) 0.8058; (P) 0.8069; (R1) 0.8087; More….
Intraday bias in USD/CHF remains neutral and outlook is unchanged. On the downside, break of 0.8020 will revive that case that the corrective pattern from 0.7871 has completed, and target a retest on 0.7871 low. On the upside, firm break of 0.8710 will resume the corrective from 0.7871. Intraday bias will be back on the upside for 38.2% retracement of 0.9200 to 0.7871 at 0.8379.
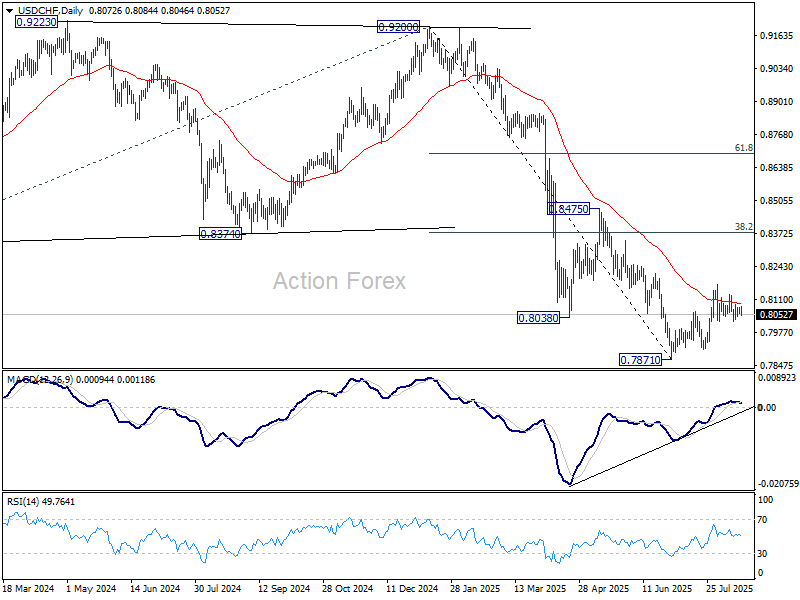
In the bigger picture, long term down trend from 1.0342 (2017 high) is still in progress. Next target is 100% projection of 1.0146 (2022 high) to 0.8332 from 0.9200 at 0.7382. In any case, outlook will stay bearish as long as 0.8475 resistance holds.
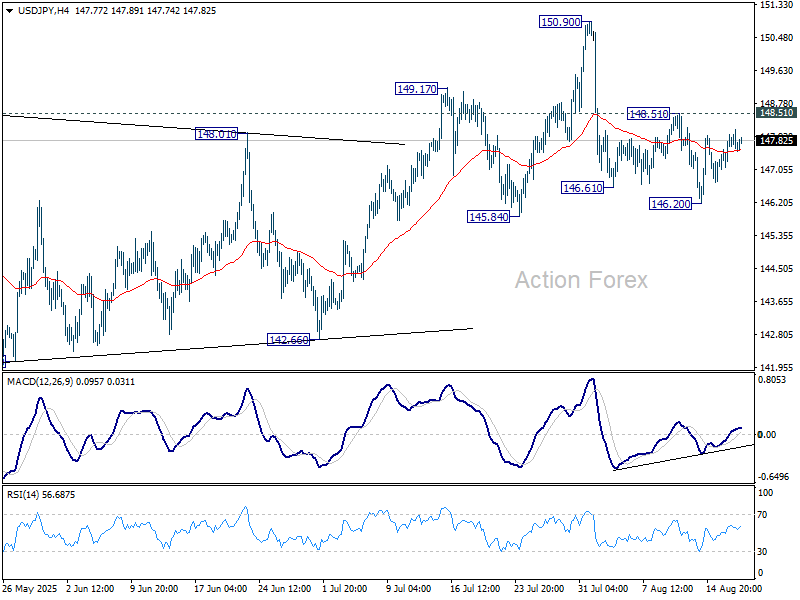
USD/JPY Mid-Day Outlook
Daily Pivots: (S1) 147.29; (P) 147.64; (R1) 148.20; More...
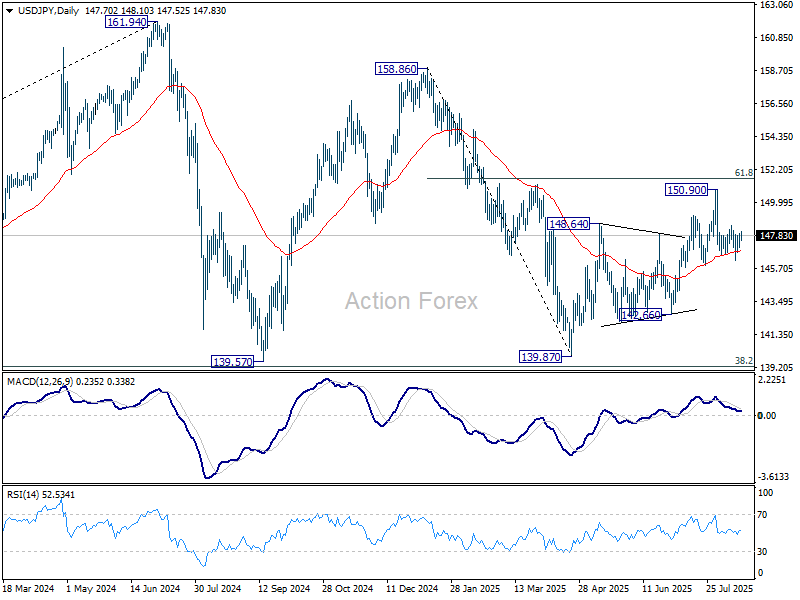
Intraday bias in USD/JPY stays neutral and outlook is unchanged. On the upside, break of 148.51 will indicate that the pullback from 150.90 has completed, and bring retest of this high. This will also keep the whole rise from 139.87 alive. However, firm break of 145.84 support will argue that the rebound from 139.87 has completed, and turn near term outlook bearish.
In the bigger picture, price actions from 161.94 (2024 high) are seen as a corrective pattern to rise from 102.58 (2021 low). Decisive break of 61.8% retracement of 158.86 to 139.87 at 151.22 will argue that it has already completed with three waves at 139.87. Larger up trend might then be ready to resume through 161.94 high. In case the corrective pattern extends with another fall, strong support is expected from 38.2% retracement of 102.58 to 161.94 at 139.26 to bring rebound.
Canada: Inflation Moves Lower in July, Keeping Door Open for Further Rate Relief
Headline CPI inflation for July came in at 1.7% year-on-year (y/y), cooling from the 1.9% in June and below expectations for a 1.8% y/y print.
Gasoline prices falling 0.7% on the month on lower geopolitical tensions and increased OPEC+ output were a drag on the index.
Shelter price inflation rose for the first time since February 2024, rising 3.0% y/y from 2.9% in June. This was mostly attributed to a greater influence from the natural gas and rent indexes. The contraction in natural gas prices slowed in July, propping up shelter costs while tent inflation increased to 5.1% y/y, from 4.7% in June.
The Bank of Canada's (BoC) CPI-trim measure was unchanged for the third month in a row at 3.0% y/y, while the CPI-median index ticked higher to 3.1% y/y. The CPI excluding food and energy ticked down to 2.5% y/y from 2.6% the month prior and the CPI excluding the eight most volatile components and indirect taxes (CPIX) also took a step back to 2.6% y/y (from 2.7% in June). All four of the core measures decelerated on a seasonally adjusted monthly basis in July, with the trim and median registering 0.18% m/m and 0.19% m/m, respectively, while the CPI excluding food and energy and CPIX were effectively flat at 0.06% m/m.
Key Implications
Energy prices continue to do the heavy lifting on the top-line measure, but the softer trend in core inflation is what really jumps out from this report. The monthly pattern is suggestive of an economy where prices pressures are increasingly offset by growing economic slack.
On a go-forward basis this report builds on what we saw last month, slowing momentum in core prices as slack in the economy builds. Between February (when trade tensions really flared) and July the economy has added a total of 27k jobs, and now core inflation appears to be losing steam. All together this looks like the scenario the BoC highlighted as giving rise to the "need for a further reduction in the policy interest rate". From our lens, we think the BoC will have room to deliver more easing later this year as the economic slack continues to build and offset inflation pressure.
USD/CAD Mid-Day Outlook
Daily Pivots: (S1) 1.3780; (P) 1.3806; (R1) 1.3828; More...
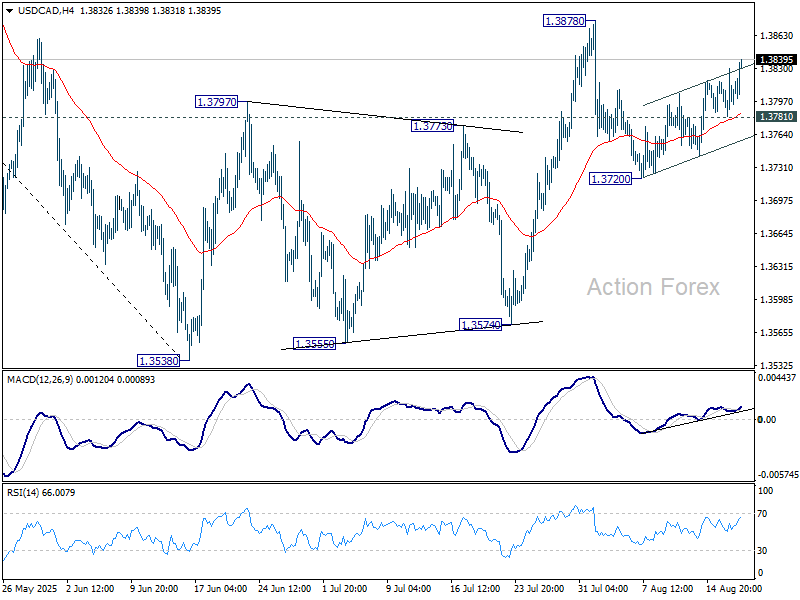
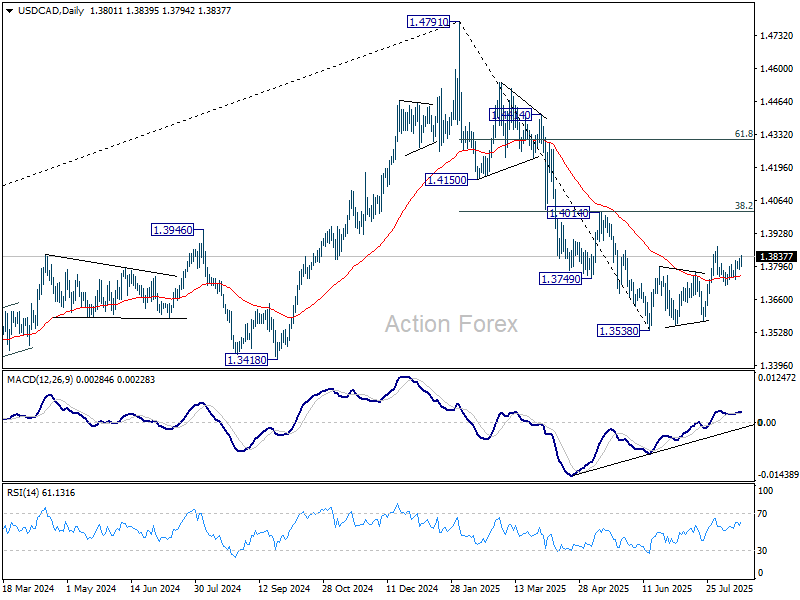
USD/CAD rebounds further today but stays below 1.3878 resistance. Intraday bias remains neutral first. On the upside, firm break of 1.3878 will resume the corrective rebound from 1.3538 with another rising leg. Intraday bias will be back to the upside for 1.4014 cluster resistance (38.2% retracement of 1.4791 to 1.3538 at 1.4017). On the downside, though, below 1.3781 will turn bias to the downside to extend the fall from 1.3878 through 1.3720 support.
In the bigger picture, price actions from 1.4791 medium term top could either be a correction to rise from 1.2005 (2021 low), or trend reversal. In either case, further decline is expected as long as 1.4014 resistance holds. Next target is 61.8% retracement of 1.2005 (2021 low) to 1.4791 at 1.3069.
Loonie Dips After CPI Miss, Attention Turns to RBNZ
Canadian Dollar weakened broadly in early US session after inflation came in slightly below expectations. The data miss was modest, but enough to put the Loonie under pressure in otherwise quiet markets. The softer reading is not significant enough to force an immediate policy response from the BoC. Nor does it resolve concerns about sticky underlying inflation, with core measures still elevated.
Still, the lack of any resurgence in inflation allows policymakers to focus more squarely on risks to growth and employment. This backdrop could make it easier for the BoC to deliver another cut in September if incoming data — particularly on the labor market — shows further weakness.
In broader currency market, risk sentiment remains sluggish. Kiwi, Aussie, and Loonie are the weakest performers on the day so far, while Swiss Franc leads gains, followed by Euro and Yen. Sterling and Dollar are mixed in the middle of the pack.
That said, outside of a few Loonie and Aussie crosses, most major pairs remain trapped inside last week’s ranges. Trading conditions are subdued as investors avoid making large bets ahead of the Jackson Hole Symposium later in the week, where Fed commentary is expected to provide direction.
Looking forward, focus will first shifts to RBNZ’s policy decision in the coming Asian session. A 25bps cut to 3.00% is widely expected, but guidance will be key. Markets and economists remain split on whether the easing cycle ends here or if further cuts will follow into 2026. The tone of the statement will be scrutinized for clues on the next steps.
In Europe, at the time of writing, FTSE is up 0.34%. DAX is up 0.30%. CAC is up 1.05%. UK 10-year yield is down -0.007 at 4.736. Germany 10-year yield is up 0.004 at 2.771. Earlier in Asia, Nikkei fell -0.38%. Hong Kong HSI fell -0.21%. China Shanghai SSE fell -0.02%. Singapore Strait Times rose 0.69%. Japan 10-year JGB yield rose 0.026 to 1.597.
Canada CPI slows to 1.7% on gasoline drop, core still elevated
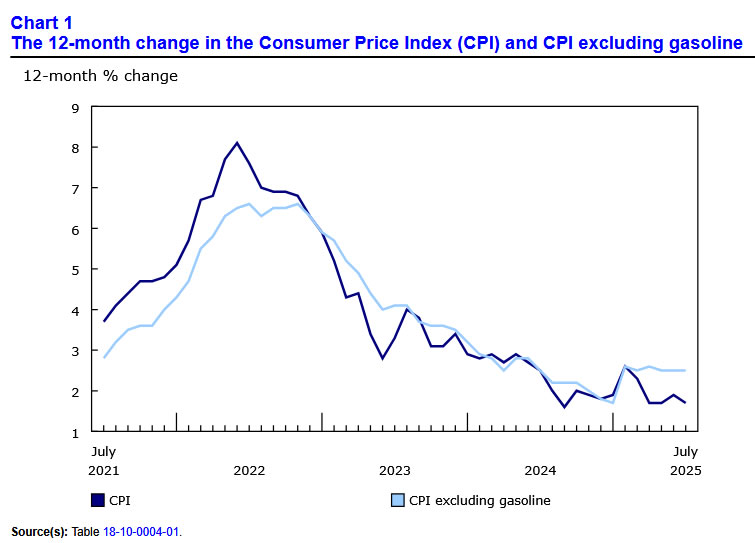
Canada’s headline CPI eased to 1.7% yoy in July, down from 1.9% yoy and below expectations for no change. The decline was driven by a sharp -16.1% yoy drop in gasoline prices, deepening from June’s -13.4% yoy. Excluding gasoline, CPI held steady at 2.5% yoy, in line with the prior two months. On a monthly basis, CPI rose 0.3% mom, matching forecasts.
Core measures delivered a mixed picture. CPI median ticked up to 3.1% yoy, as expected, while CPI trimmed held at 3.0% yoy. CPI common stayed at 2.6% yoy, a touch softer than anticipated rise to 2.7% yoy. Together, the readings show inflation has not accelerated, though underlying pressures remain sticky.
The figures reinforce the view that while headline inflation is cooling, the BoC cannot declare victory yet. Policymakers must weigh the relief from falling energy costs against stubborn core pressures. That balance will be crucial in shaping whether the Bank resumes easing at the September meeting or holds back to assess further data.
Australia's Westpac consumer sentiment hits 3.5-year high on RBA boost
Australian consumer confidence surged in August, with the Westpac index rising 5.7% mom to 98.5, the strongest reading since early 2022. Westpac attributed the rebound to RBA’s recent rate cuts, noting that a “long period of pessimism” among households may finally be drawing to a close. Consumers are less worried about their finances and more willing to take a cautiously positive view on the economy.
While policy easing is clearly helping, Westpac said the recovery is still fragile. Sustaining gains will likely require further RBA support, though there is no urgency to cut again at the September 29–30 meeting. With inflation well within the target range and unemployment low, the Board has room to wait and respond to incoming data.
On balance, Westpac expects RBA to hold steady in September before delivering another 25bp rate cut in November.
USD/CAD Mid-Day Outlook
Daily Pivots: (S1) 1.3780; (P) 1.3806; (R1) 1.3828; More...
USD/CAD rebounds further today but stays below 1.3878 resistance. Intraday bias remains neutral first. On the upside, firm break of 1.3878 will resume the corrective rebound from 1.3538 with another rising leg. Intraday bias will be back to the upside for 1.4014 cluster resistance (38.2% retracement of 1.4791 to 1.3538 at 1.4017). On the downside, though, below 1.3781 will turn bias to the downside to extend the fall from 1.3878 through 1.3720 support.
In the bigger picture, price actions from 1.4791 medium term top could either be a correction to rise from 1.2005 (2021 low), or trend reversal. In either case, further decline is expected as long as 1.4014 resistance holds. Next target is 61.8% retracement of 1.2005 (2021 low) to 1.4791 at 1.3069.
Canada CPI slows to 1.7% on gasoline drop, core still elevated
Canada’s headline CPI eased to 1.7% yoy in July, down from 1.9% yoy and below expectations for no change. The decline was driven by a sharp -16.1% yoy drop in gasoline prices, deepening from June’s -13.4% yoy. Excluding gasoline, CPI held steady at 2.5% yoy, in line with the prior two months. On a monthly basis, CPI rose 0.3% mom, matching forecasts.
Core measures delivered a mixed picture. CPI median ticked up to 3.1% yoy, as expected, while CPI trimmed held at 3.0% yoy. CPI common stayed at 2.6% yoy, a touch softer than anticipated rise to 2.7% yoy. Together, the readings show inflation has not accelerated, though underlying pressures remain sticky.
The figures reinforce the view that while headline inflation is cooling, the BoC cannot declare victory yet. Policymakers must weigh the relief from falling energy costs against stubborn core pressures. That balance will be crucial in shaping whether the Bank resumes easing at the September meeting or holds back to assess further data.
AUD/USD: Neutral Near-Term Tone While Price Ranges Within Daily Cloud
AUDUSD remains in a sideways mode for the third straight day, with near term price action moving within a narrow daily cloud.
Upticks above cloud top (0.6512) were repeatedly capped by daily Kijun-sen (0.6522) that resulted in attack at cloud base (0.6474, also Fibo 61.8% of 0.6419/0.6568 upleg), which so far contained dips.
No clear direction signal expected while the price stays within the cloud, though strengthening positive momentum on daily chart, Stochastic about to emerge from oversold territory and converged daily Tenkan/Kijun-sen attempting to form a bull-cross, point to slight bullish alignment.
Bullish scenario sees break above cloud top and Kijun-sen, to open way for attack at 0.6568 (Aug 14 high) and possibly unmask 2025 peak (0.6625, posted on July 24)
Conversely, sustained break below cloud base would expose supports at 0.6450 (100DMA) and 0.6419 (Aug 1 low).
Res: 0.6512; 0.6522; 0.6568; 0.6595.
Sup: 0.6474; 0.6450; 0.6419; 0.6372.
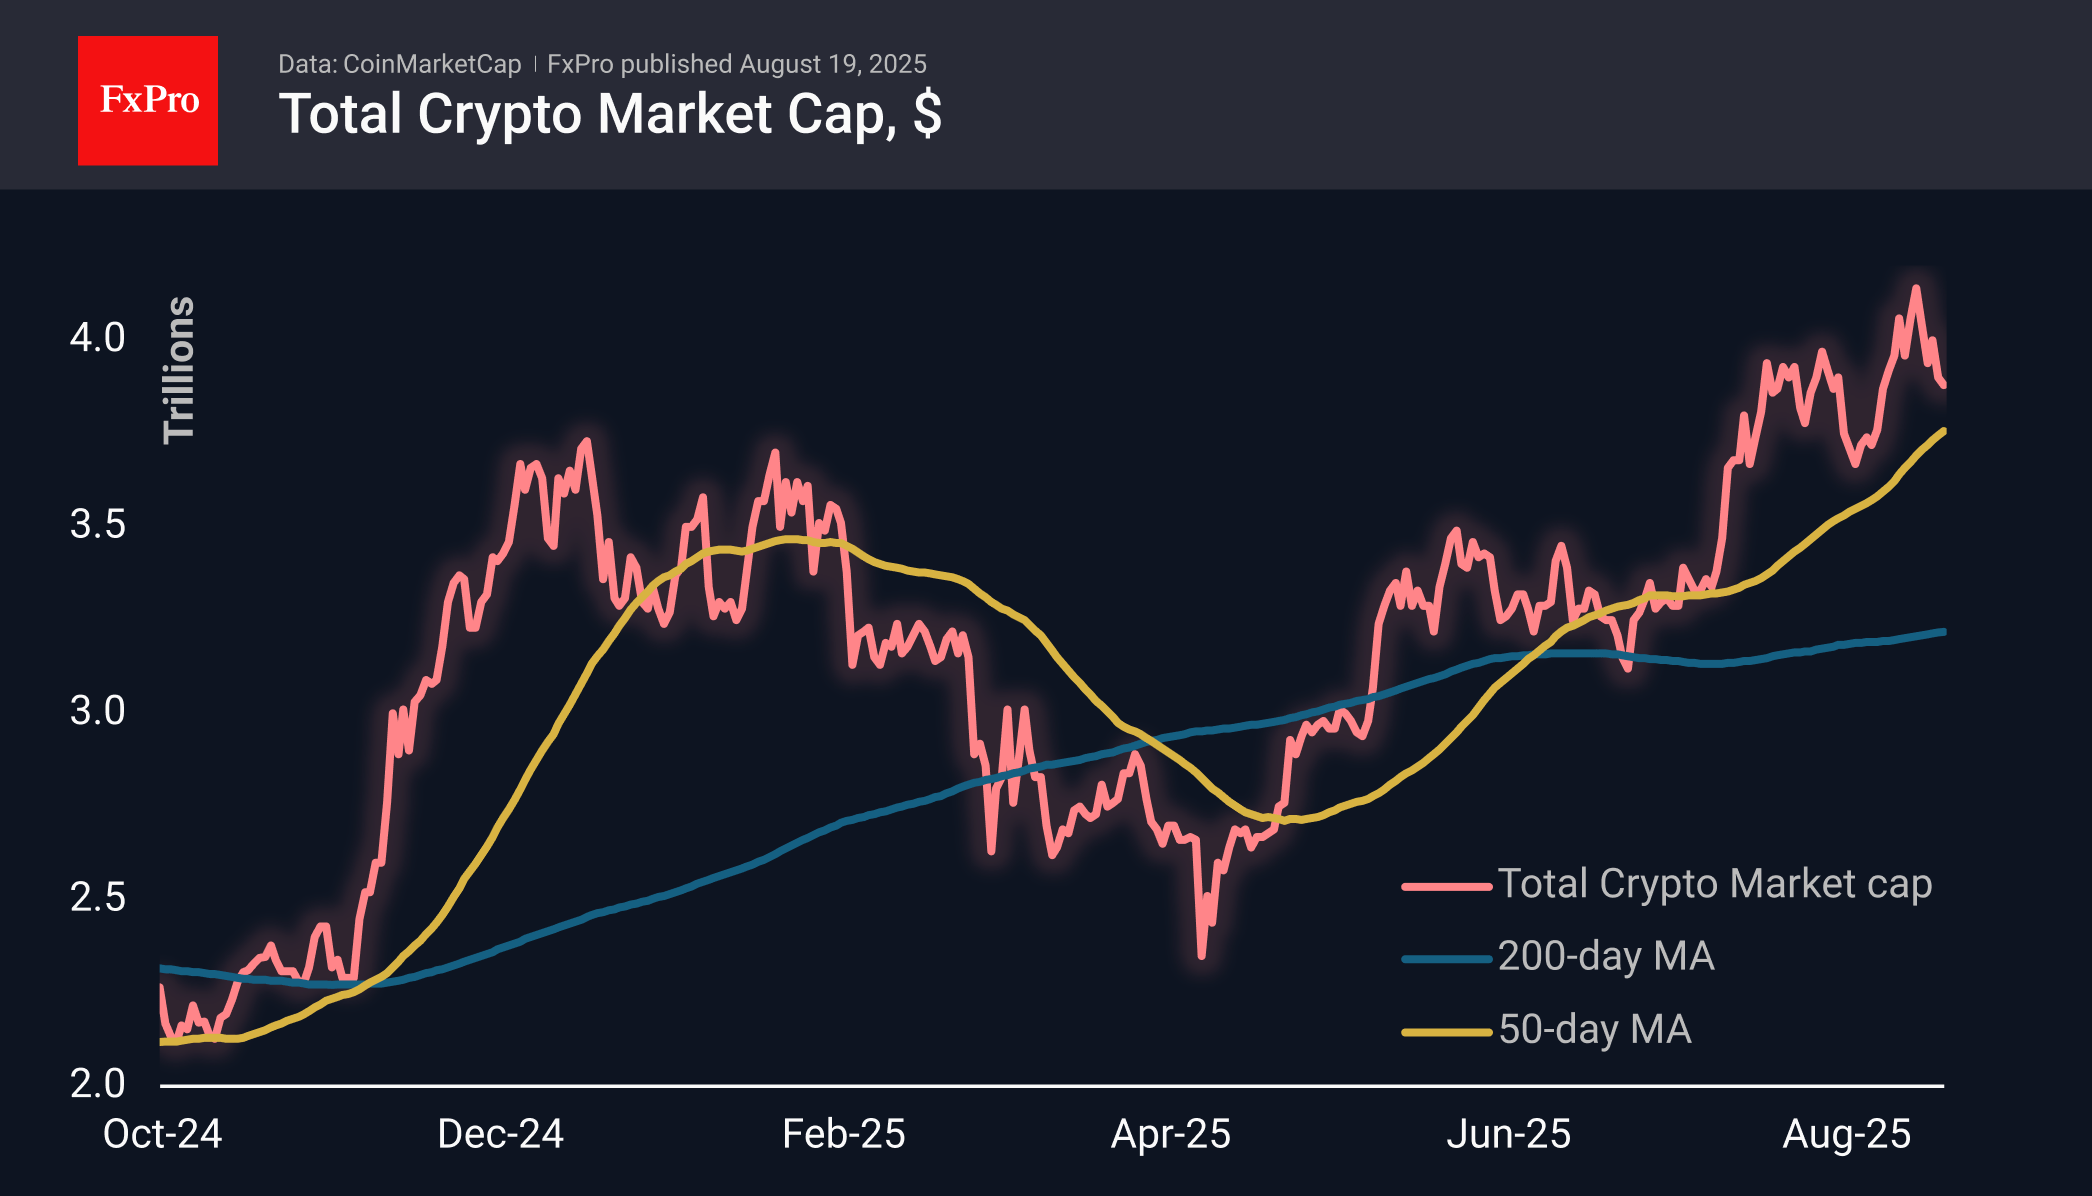
Cryptocurrency Market Nervousness Grows
Market Overview
The crypto market cap fell by another 0.4% to $3.87 trillion. The market is plunging below the former resistance level, raising speculators’ fears of a possible major correction towards $3.6 trillion.
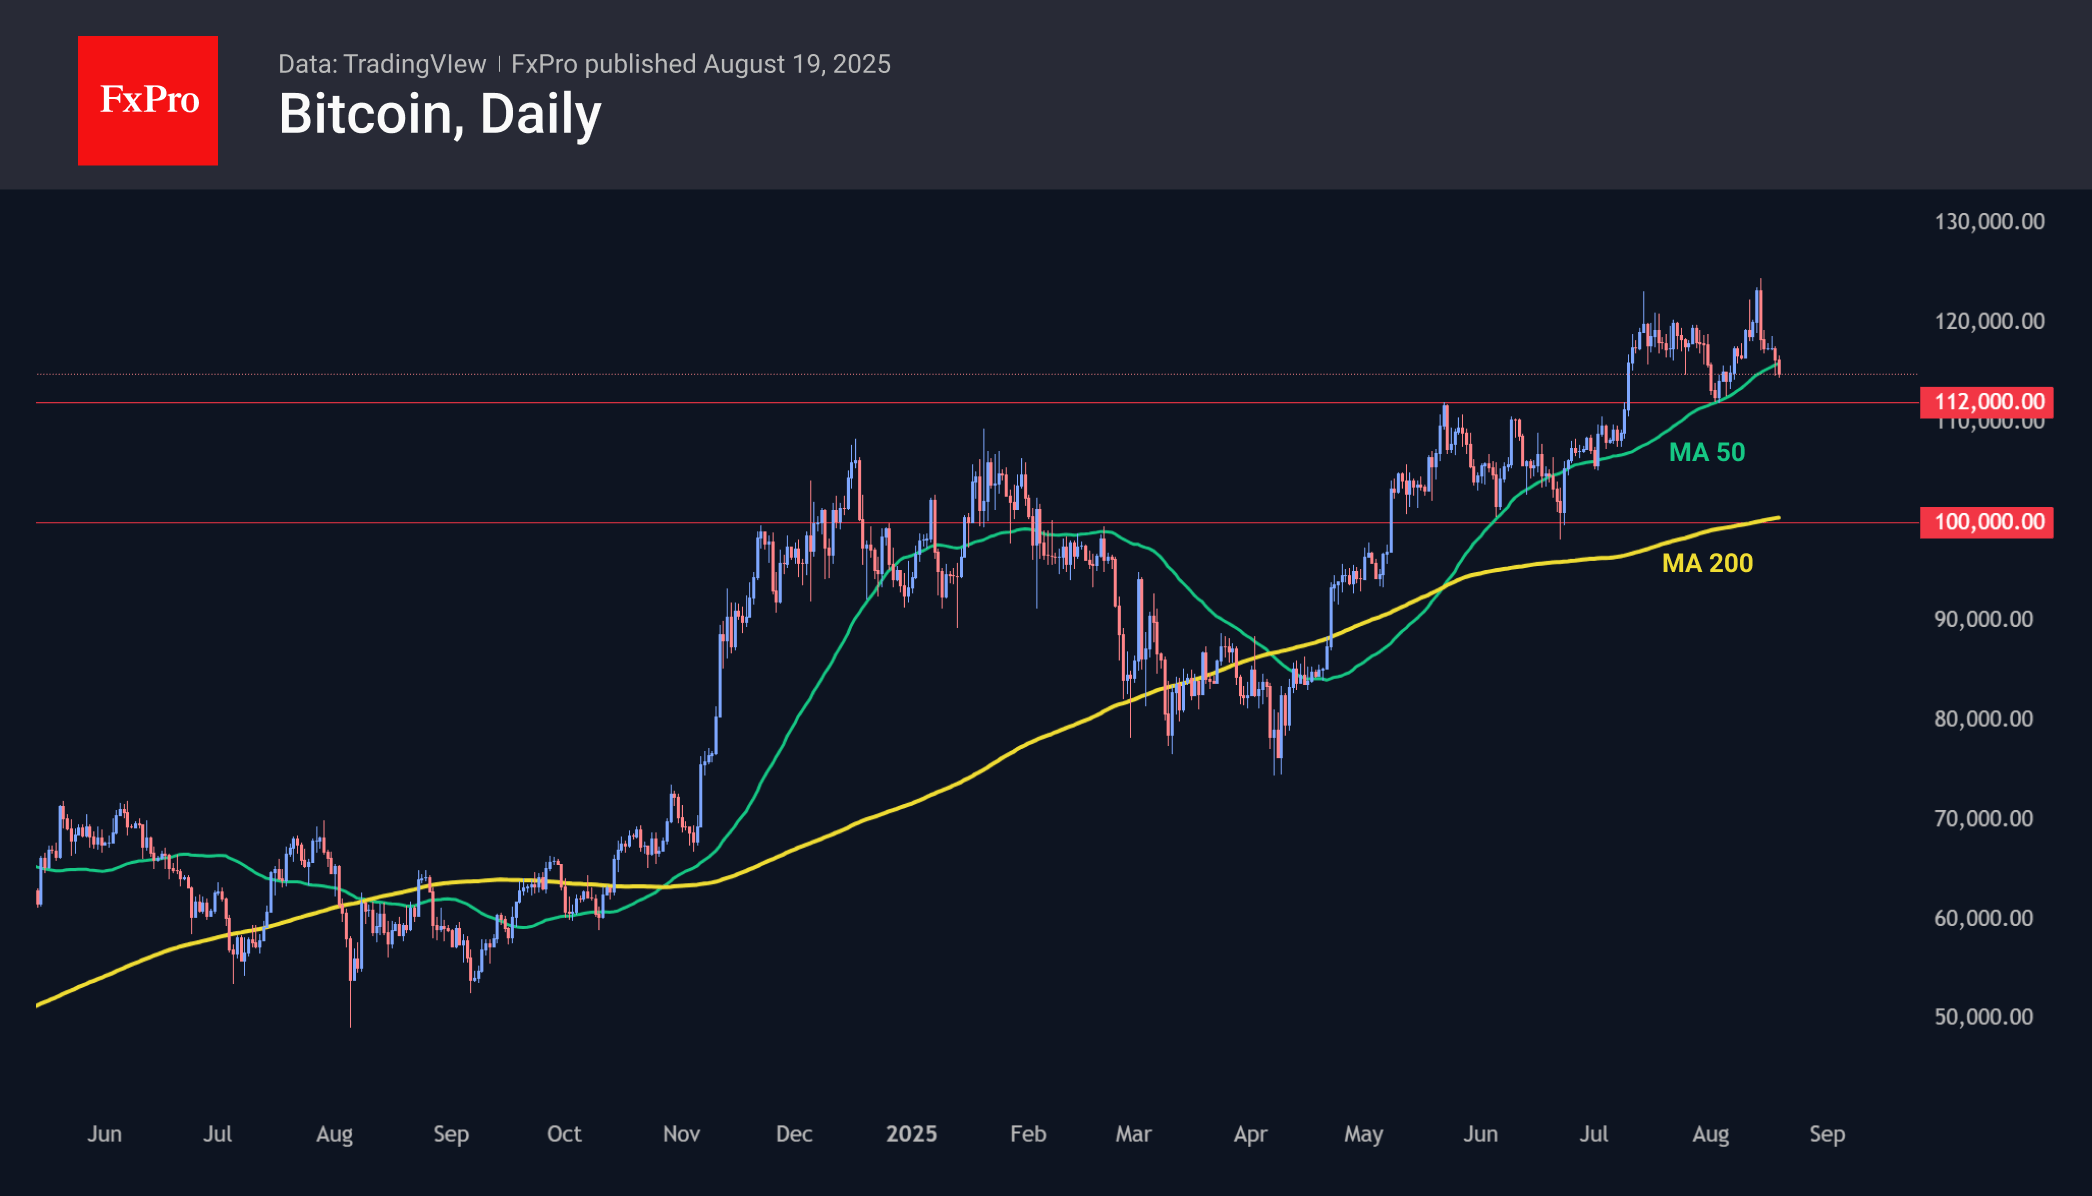
Bitcoin fell to $114.7k, rolling back to levels seen two weeks ago and below the medium-term trend line, which is a 50-day moving average. This dynamic reinforces fears of a deeper correction, which could affect the entire crypto market, potentially triggering a deeper correction to $100K, near the 200-day MA.
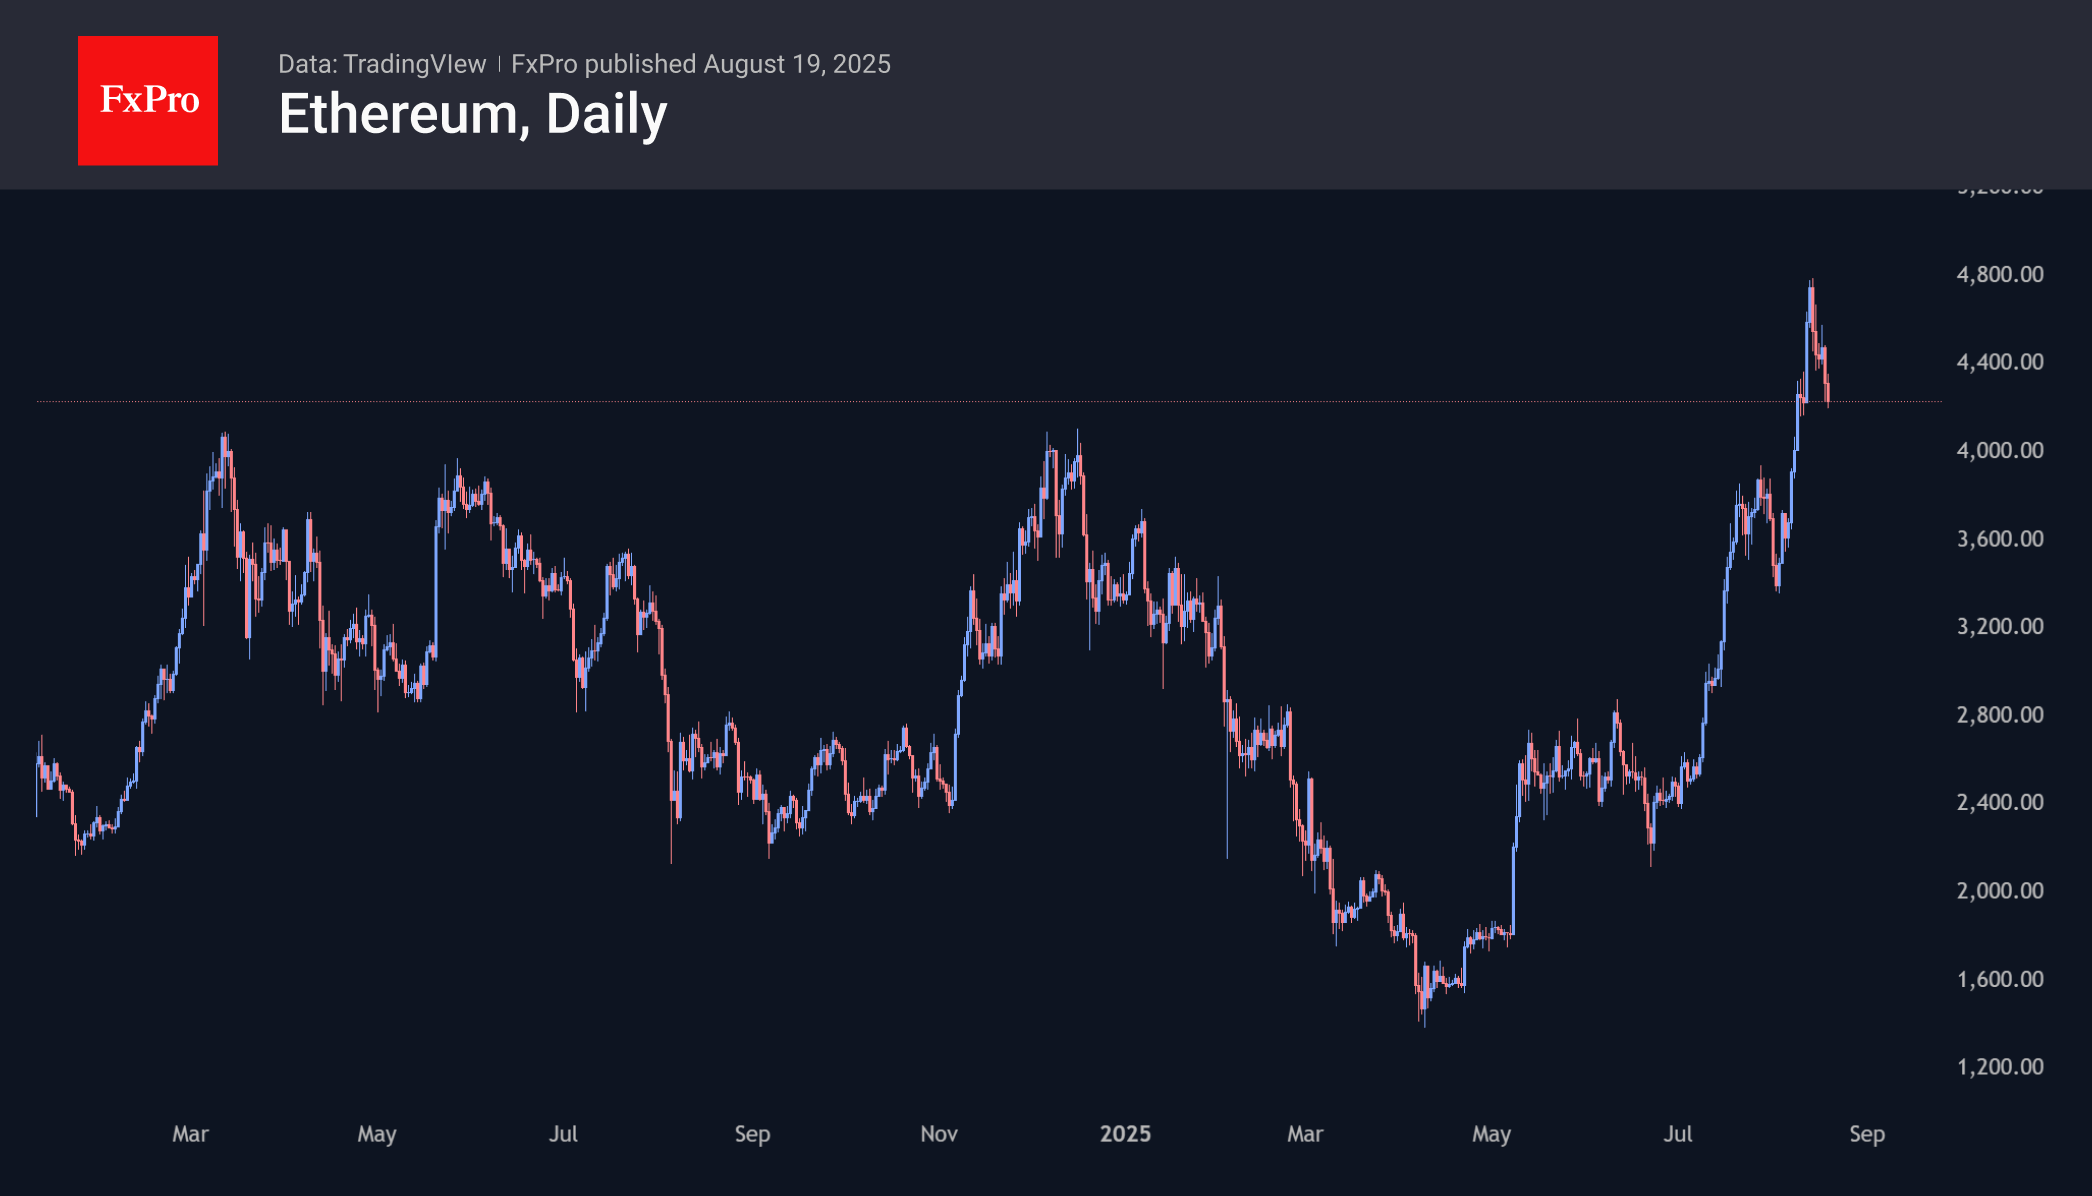
Ethereum rolled back to $4,200, losing more than 12% from its peak. The second-largest coin by capitalisation seems to be seriously aiming to test the strength of the former resistance area near $4,100, which has been holding back price growth since March 2024. The ability to stay above this level will indicate a change in the market regime for this cryptocurrency. The abundant capital inflows also point to this.
News Background
According to CoinShares, global investment in crypto funds rose more than sixfold last week to $3.748 billion, the highest inflow in the last four weeks. Investments in Bitcoin increased by $552 million, Ethereum jumped by $2.868 million, Solana grew by $177 million, XRP by $126 million, and Sui by $11 million.
According to Glassnode, the number of addresses with a balance of more than 10,000 BTC fell to an annual low, and the number of wallets with 1,000–10,000 BTC also decreased. This indicates that large holders are taking profits after reaching record highs.
According to Canary Capital, Bitcoin is 50% likely to reach $140,000–$150,000 by the end of 2025, but a bear market will come next year.
Solana became the first network to reach 107,540 transactions per second (TPS) during a stress test. The actual throughput of the blockchain is lower, at around 3,700 TPS, which is 59 times higher than that of the main Ethereum network.
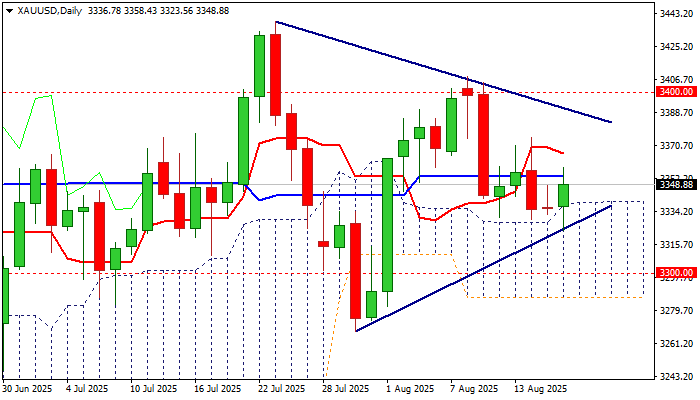
XBR/USD Chart Analysis: Brent Crude Nears Its Lowest Level Since Early Summer
According to the XBR/USD chart, this morning (19 August) Brent crude oil price is showing bearish momentum, moving towards its lowest level since early summer (set last week). The key bearish drivers in the market include:
→ OPEC+ policy aimed at increasing production;
→ expectations that negotiations to end the war in Ukraine could lead to the lifting of sanctions on Russian oil exports, which would further expand global supply.
Technical Analysis of the XBR/USD Chart
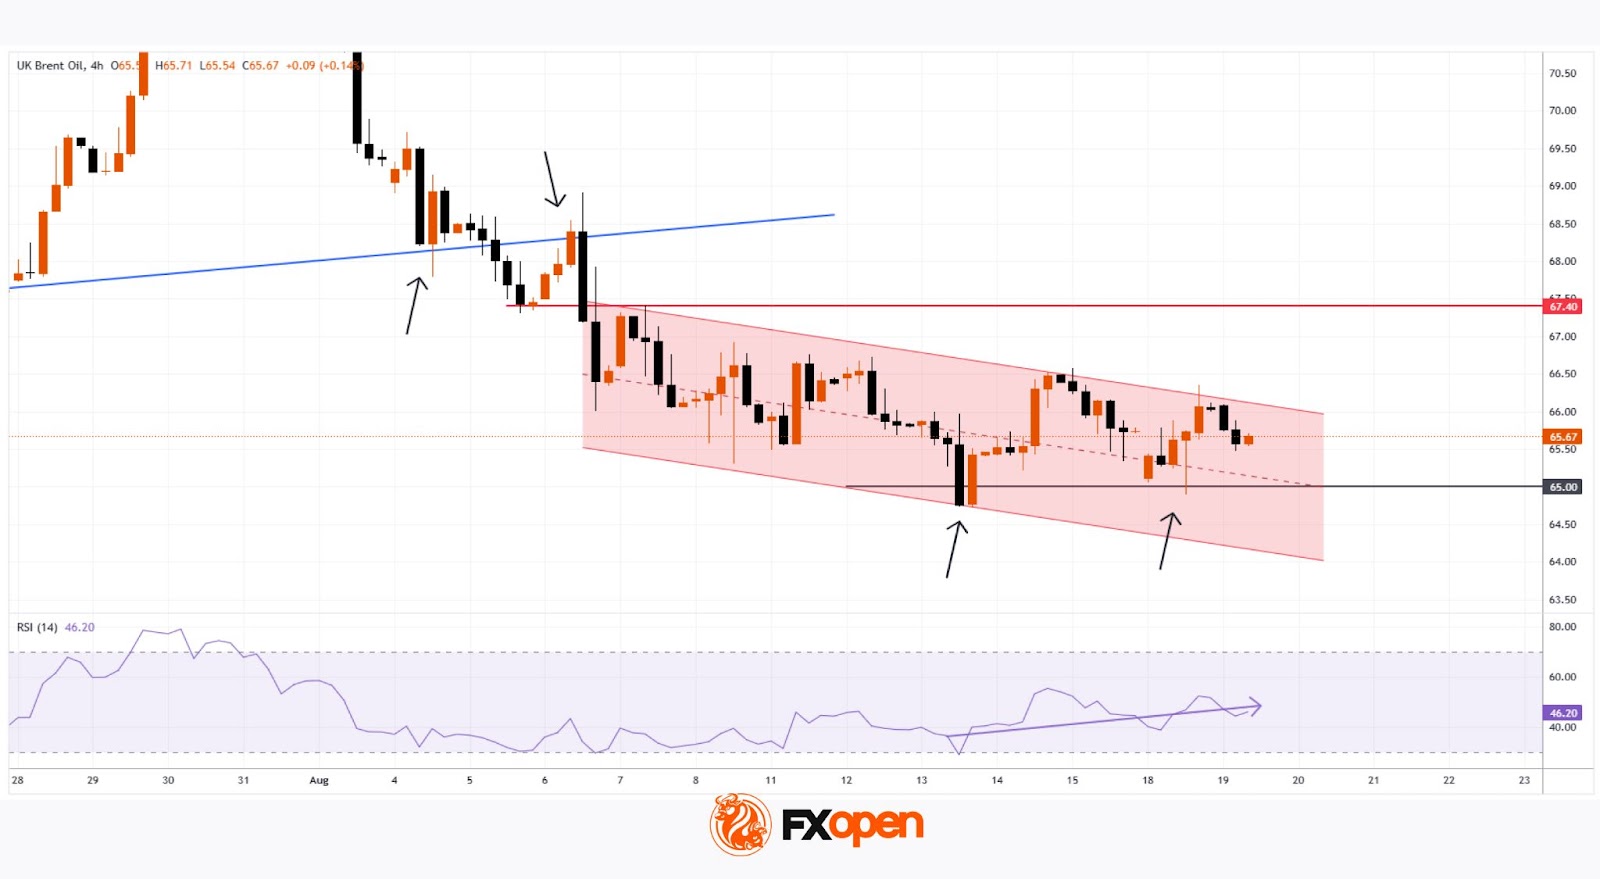
In our analysis on 5 August, we noted that:
→ Brent crude had fallen to an important support level (marked in blue), which held throughout July;
→ a bearish breakout attempt below the blue support line was possible.
Indeed, in early August the price confirmed a bearish breakout of the blue line, accompanied by signs of rising volatility – the line subsequently reversed its role from support to resistance (as indicated by the arrows on the left-hand side of the chart).
Bears then consolidated their position, continuing to apply pressure and forming a downward channel (shown in red). The question now is whether Brent prices can continue their decline.
From a bullish perspective, there are grounds for demand to strengthen around the key support level at $65.00 (as indicated by the arrows on the right-hand side of the chart):
→ during an attempt to move lower, the chart formed a bullish harami reversal pattern;
→ this level acted as support following the bearish gap at this week’s market opening;
→ yesterday’s long lower shadow highlights aggressive buying activity.
From a bearish perspective, August’s downtrend remains intact – though it may be losing momentum. Note the RSI indicator, which is gradually leaning towards the 50 level (if bears were still firmly in control, it would remain closer to oversold territory).
This suggests that bulls may attempt to seize the initiative and challenge the upper boundary of the descending channel, seeking to offset at least part of Brent’s nearly 10% decline since late July. In this scenario, the $67.40 level – where bears previously demonstrated strong control – could become a critical test of demand resilience.
Tomorrow’s key releases could significantly influence price action: crude oil inventories (15:30 GMT+3) and the FOMC minutes (21:00 GMT+3).
Start trading commodity CFDs with tight spreads. Open your trading account now or learn more about trading commodity CFDs with FXOpen.
This article represents the opinion of the Companies operating under the FXOpen brand only. It is not to be construed as an offer, solicitation, or recommendation with respect to products and services provided by the Companies operating under the FXOpen brand, nor is it to be considered financial advice.
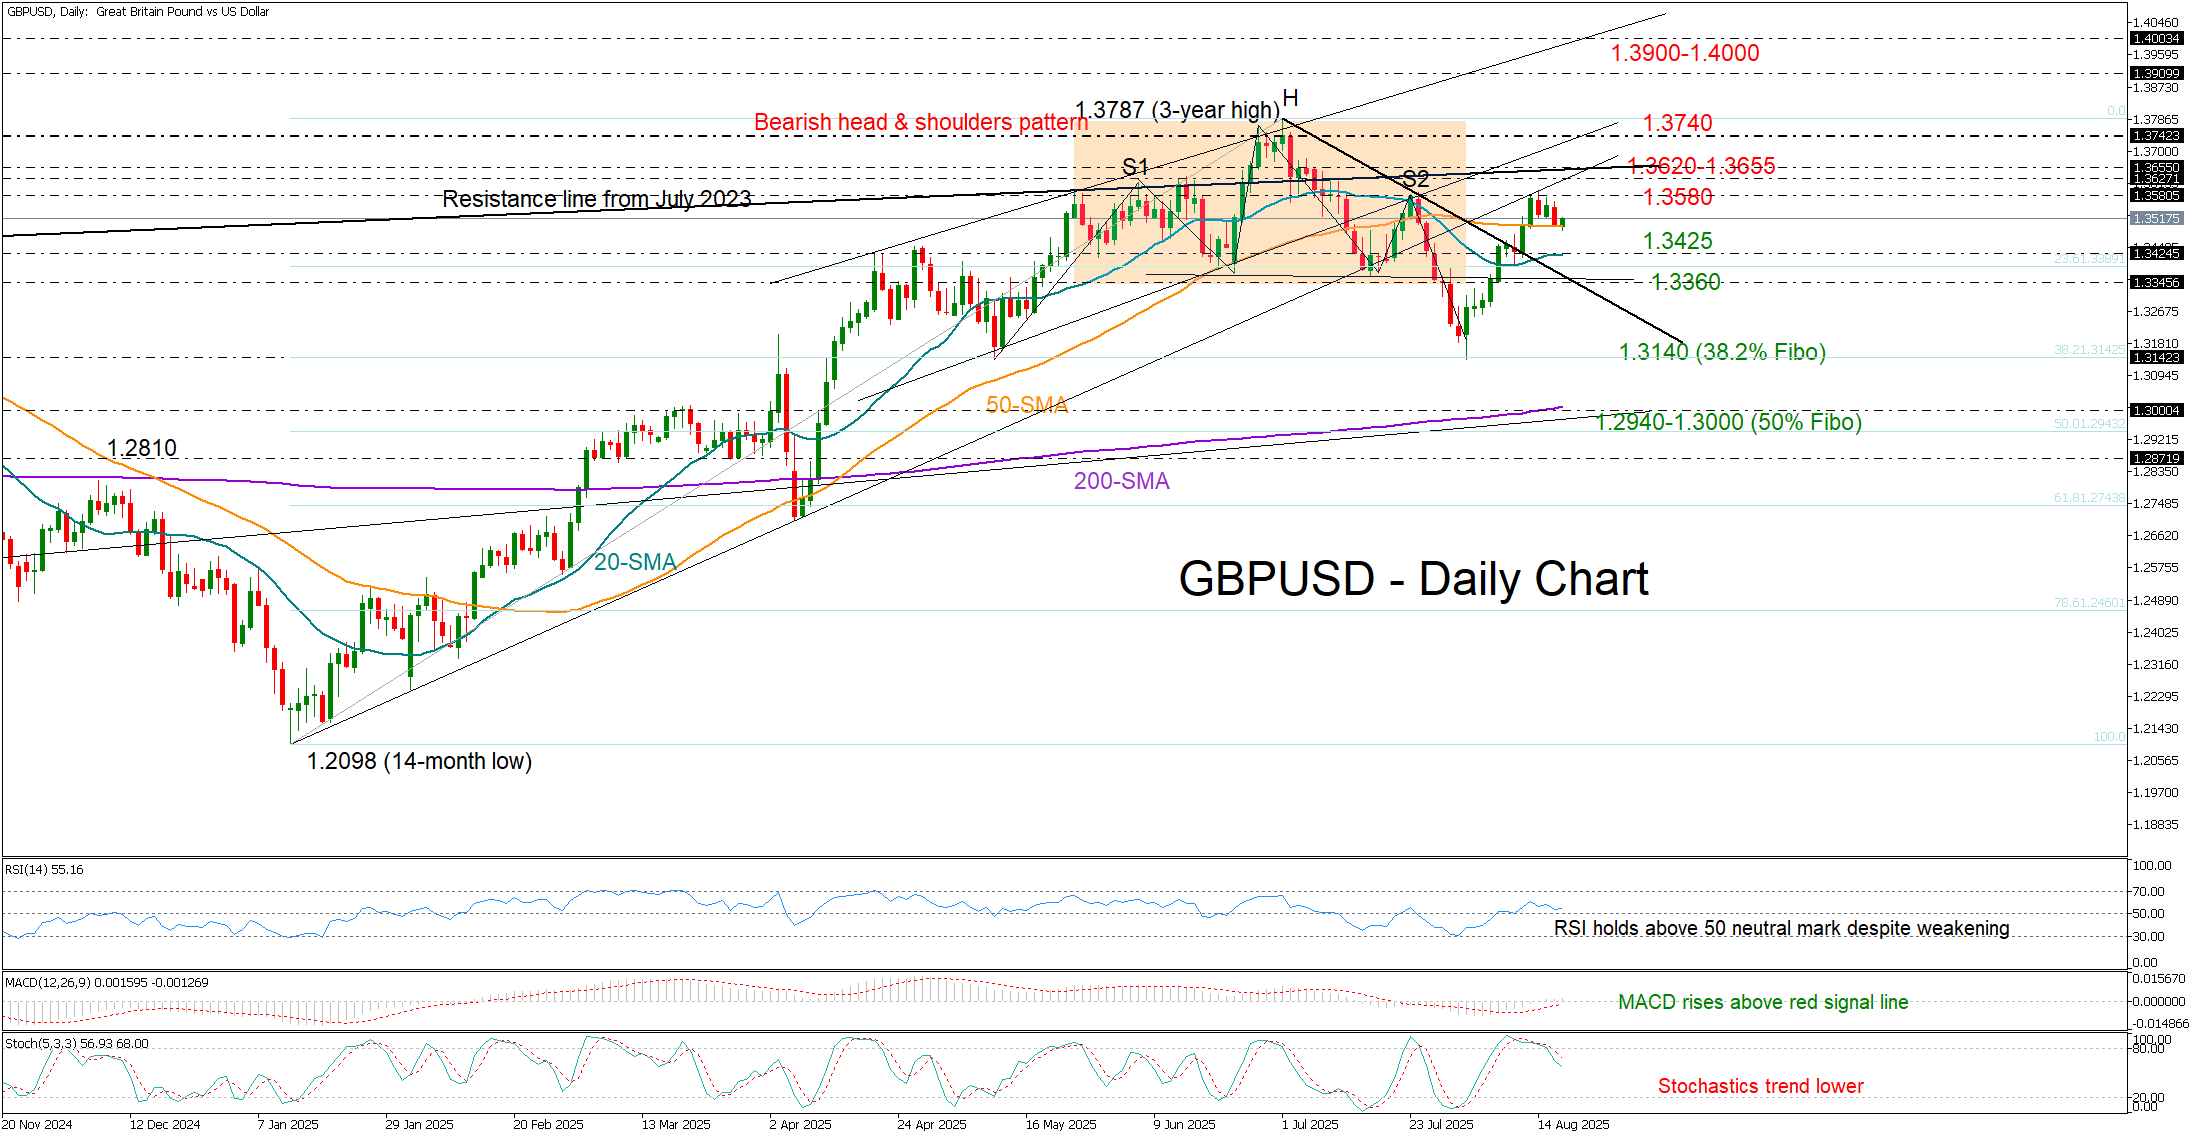
GBP/USD Keeps August Rally on Pause
- GBPUSD faces low volatility but holds above 50-day SMA.
- Bearish short-term structure intact; bullish bias could emerge above 1.3655.
GBPUSD is trading quietly ahead of a busy UK data calendar, consolidating between the recent high of 1.3580 and the 50-day simple moving average (SMA) at 1.3500.
So far, August has been favorable for the pair, with the price climbing more than 3% from the low of 1.3139, largely driven by a weaker US dollar. Stronger-than-expected UK GDP growth figures failed to negate the bearish head-and-shoulders pattern, leaving attention now on upcoming CPI inflation, S&P Global business PMIs, and retail sales. These releases could provide fresh insight into whether a pause in the BoE’s rate-cut cycle is possible in the coming months.
Technical indicators suggest there is still some upside potential. The MACD is gradually strengthening in positive territory, while the RSI is holding above its neutral 50 mark. If the 50-day SMA holds firm, the pair may attempt a move higher towards the key resistance area at 1.3620–1.3655. A break above this zone could open the way for a retest of July’s high at 1.3740, with further gains targeting 1.3900–1.4000 or even 1.4070.
On the downside, a drop below 1.3500 could see the pair testing support between the 20-day SMA at 1.3425 and the broken resistance trendline near 1.3360. A decisive bearish move there could drive the price down to August’s low of 1.3139. Below that, the 200-day SMA at 1.3000 would come into focus.
In summary, while technical signals point to some buying interest, GBPUSD will need to invalidate the short-term bearish structure with a move above 1.3655 to strengthen market confidence.