Sample Category Title
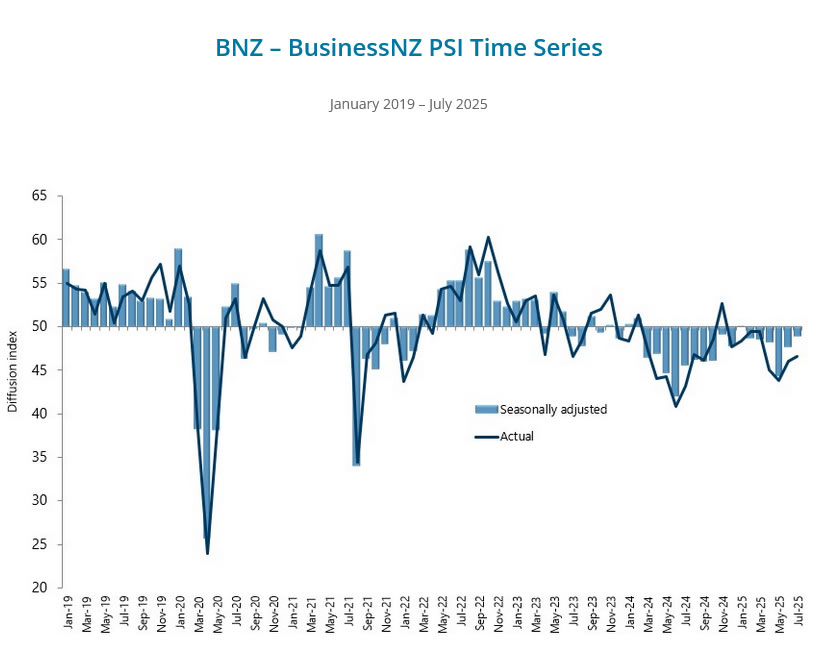
NZ BNZ services uptick to 48.9, contraction persists
New Zealand’s BusinessNZ Performance of Services Index improved slightly in July, rising from 47.6 to 48.9. But the sector remained in contraction for the sixth consecutive month. Also, the latest reading is still well below the long-run survey average of 52.9.
Details showed mixed conditions. Activity/Sales stayed in contraction at 47.5, and New Orders stalled at 50.0. On the positive side, Inventories expanded for the second month at 51.4. Employment component slid to 47.1, extending its losing streak to 20 months.
Business sentiment, while slightly less negative, continued to reflect difficult conditions. Around 58.5% of comments were pessimistic, down from 66.2% in June. Firms pointed to declining sales, reduced spending, and persistent cost-of-living pressures. Inflation, high interest rates, weather disruptions, staffing shortages, and global uncertainty all weighed on confidence.
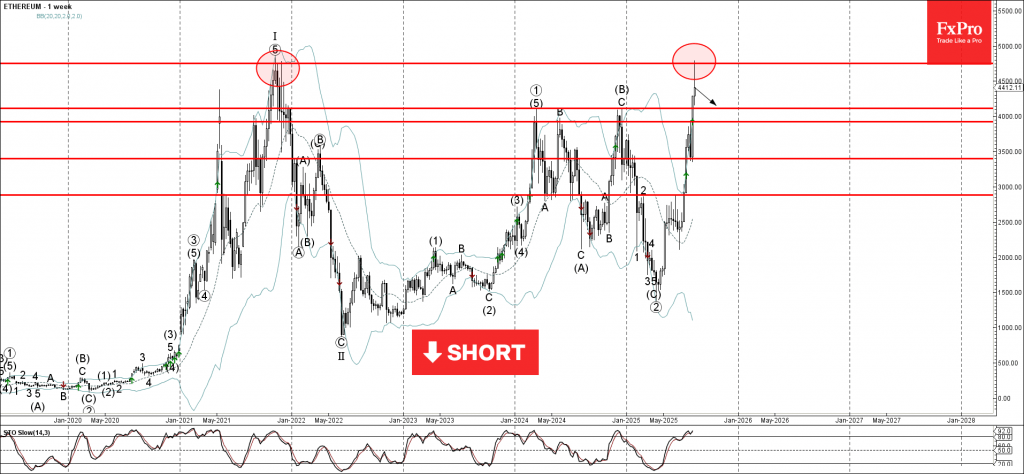
Ethereum Wave Analysis
Ethereum: ⬇️ Sell
- Ethereum reversed from the long-term resistance level 4755.
- Likely to fall to support level 4115.00
Ethereum cryptocurrency recently reversed from the major long-term resistance level 4755.00 (which stopped the earlier sharp weekly uptrend at the end of 2021).
The downward reversal from the resistance level 4755.00 stopped the previous sharp weekly upward impulse sequence 1 from the start of this year.
Given the strength of the resistance level 4755.00 and the still overbought weekly Stochastic, Ethereum cryptocurrency can be expected to fall to the next support level 4115.00 (former yearly top from 2024).
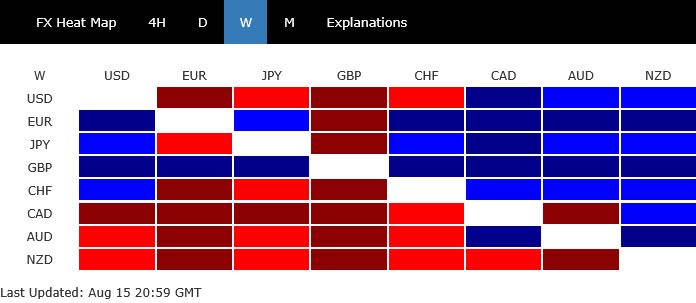
Currencies Split: Pound, Euro, Yen Firm While Antipodeans Sink
Markets spent the past week navigating a narrow path between relief and reality. Relief came from headline trade developments that bought more time for diplomacy. Reality showed up in the form of fresh price pressures and unresolved global tensions. The contrast defined how investors approached risk, producing a complex mix of resilience and unease.
On the surface, equity markets offered plenty for the bulls. Major indices in the US and Japan reached fresh highs, fueled by optimism that worst-case trade scenarios could be postponed. Gains were not limited to tech or narrow groups; instead, breadth across sectors and geographies hinted at deeper undercurrents of confidence.
But confidence has limits, and last week exposed them. Price data out of the United States suggested that tariff pass-through effects are already embedding themselves in inflation. This leaves policymakers in a difficult position: acknowledge the risks and hold steady, or push ahead with easing to reassure growth. Neither choice is without cost, and traders know it.
Japan added its own twist. Growth came in stronger than expected, bolstering the case for further monetary adjustment. Investors welcomed the momentum but quickly recognized the tension it created for the yen. A stronger economy that invites tighter policy should support the currency, yet robust global risk appetite continues to suppress its safe-haven appeal.
In the currency markets, the weekly scoreboard told its own story. Sterling emerged as the clear leader, backed by firm data, while euro and yen followed closely. At the bottom, Kiwi, Loonie, and Aussie reflected a mix of weak domestic signals and external headwinds, particularly from China. Dollar and Swiss Franc, meanwhile, drifted somewhere between strength and hesitation.
US Stocks Push Higher, Dollar Stays Fragile Ahead of Long Term Channel Support
Risk appetite held up well last week, with Wall Street finishing higher even as fresh inflation worries clouded the Fed’s outlook. DOW led the pack, advancing 1.74% as cyclical sectors outperformed. S&P 500 gained 0.94%, while NASDAQ managed a more modest 0.81%, signaling that broader market strength extended beyond technology.
The positive tone owed much to the extension of the US-China tariff truce by another 90 days. This bought time for negotiators and gave markets a reprieve from escalation risks. In the same vein, US President Donald Trump’s summit with Russian President Vladimir Putin in Alaska, while failing to yield progress on Ukraine, removed another source of immediate tension. Trump made clear he would not sanction China over its Russian oil imports “for now,” easing fears of a fresh flashpoint in US-China relations.
On the negative side, however, inflation jitters resurfaced. July’s CPI data was largely in line with forecasts, rising 2.7% year-on-year, but core inflation ticked up to 3.1%. While not alarming in itself, the persistence of sticky services inflation raised eyebrows.
The bigger shock came from producer prices. The July PPI surged 0.9% month-on-month, the sharpest increase since mid-2022. The jump was broad-based, with final demand services climbing 1.1% and goods up 0.7%. The core PPI, excluding food, energy, and trade, rose 0.6%—its highest since March 2022. These figures signaled tariff pass-through effects are already feeding into price dynamics.
Fed officials took note. Chicago Fed President Austan Goolsbee said the CPI and PPI data “put in a note of unease,” warning that services inflation was “not obviously transitory.” St. Louis Fed’s Alberto Musalem added that tariff impacts could last two to three quarters, keeping price pressures elevated into 2026, limiting Fed’s flexibility in the coming months.
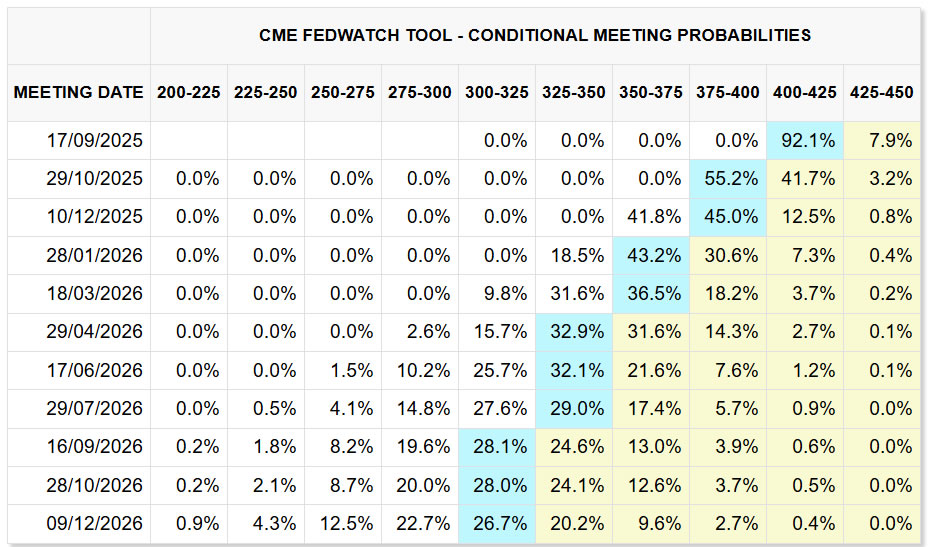
Even so, markets remain confident of a September cut. Futures now price a 92% chance of a 25bps reduction, while the odds of a jumbo 50bps cut—floated repeatedly by Treasury Secretary Scott Bessent—have effectively vanished. San Francisco Fed’s Mary Daly and others pushed back firmly on the idea of an aggressive move. Traders still expect two cuts this year, with 55% odds for the second cut in October and nearly 87% in December.
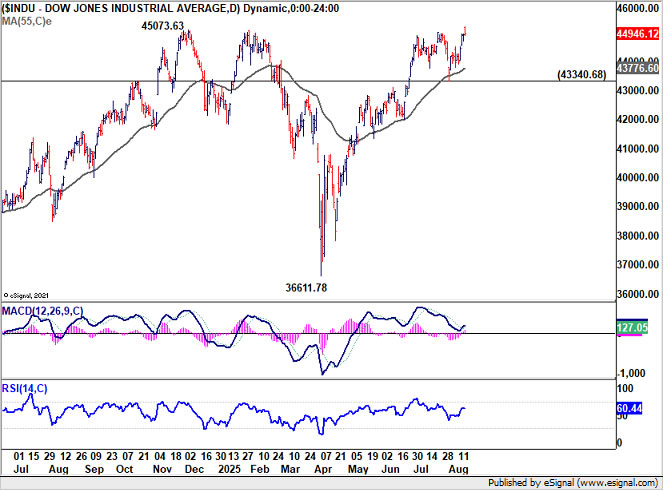
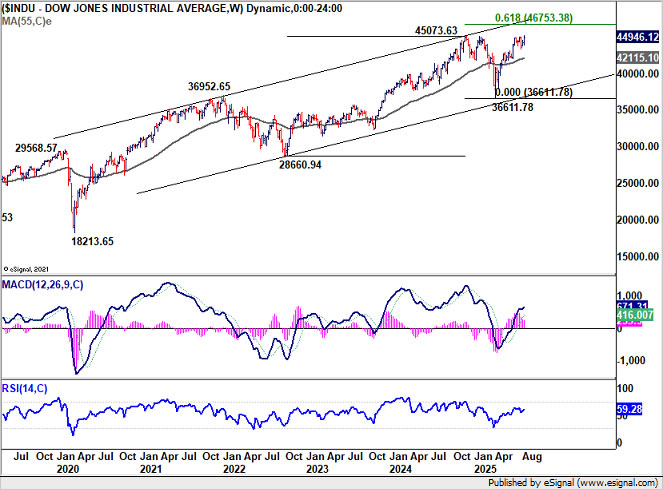
Technically, DOW finally broke to a fresh intraday record high. Sustained trading above 45,073.63 key resistance will confirm long term uptrend resumption. That would set the stage for 61.8% projection of 28,660.94 to 45,073.63 from 36,611.78 at 46,753.38. Near term outlook will stay bullish as 43,340.68 support holds, in case of a retreat.
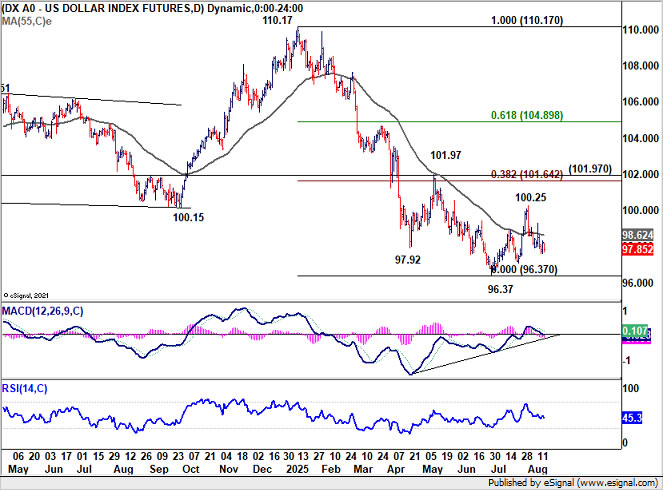
As for Dollar Index, the key question remains unanswered. It's now sitting very close to the long term channel support that started back in 2011. It's an ideal area for Dollar Index to conclude the corrective down trend from 114.77 (2022 high).
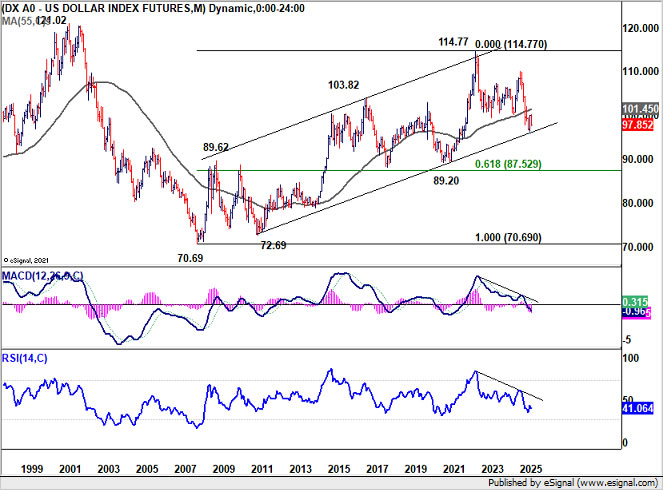
But so far, price actions from 96.37 short term bottom did little to warrant that Dollar Index is setting up bullish trend reversal. For now, while another near term bounce could be seen, outlook will stay bearish as long as 101.97 resistance zone holds, (38.2% retracement of 110.17 to 96.37 at 101.64). Break of 96.37 to resume larger down trend is still in favor.
Japan’s Resilience Lifts Nikkei to Record; Yen Stuck in Cross-Currents
Japanese equities also delivered a strong performance last week, with Nikkei 225 closing at a new record weekly high. In the background, risk appetite was bolstered by two major external drivers: the extension of the US–China tariff truce and the formal US–Japan trade deal reached on July 23.
Adding fuel to the rally was the latest Q2 GDP report, which beat expectations at 0.3% qoq growth. The headline result was particularly notable given the persistent drag from tariffs earlier in the year. Exports made a strong contribution with a 0.3 percentage-point boost. The data signals that Japan’s external sector has proven more resilient than feared, helping the economy extend its streak of growth to a fifth straight quarter.
BoJ, which recently upgraded its FY2025 growth outlook to 0.6%, may now find itself facing upside risk to its projections. Market chatter is increasingly shifting to the prospect of another rate hike before year-end, with October flagged as a realistic option. While the BoJ is unlikely to move in September, the stronger data has clearly made the policy debate more balanced.
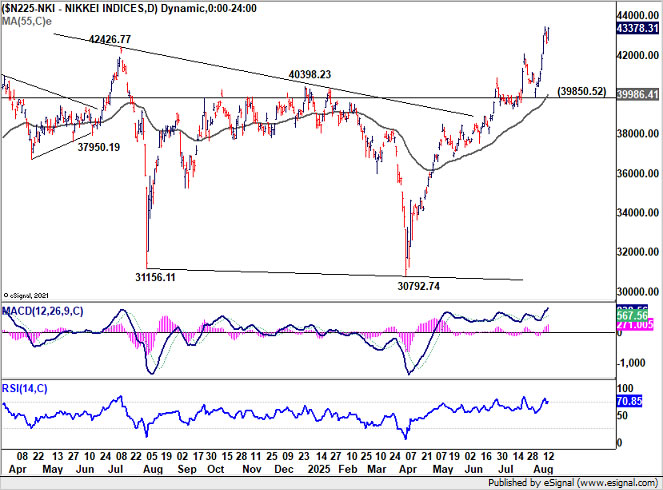
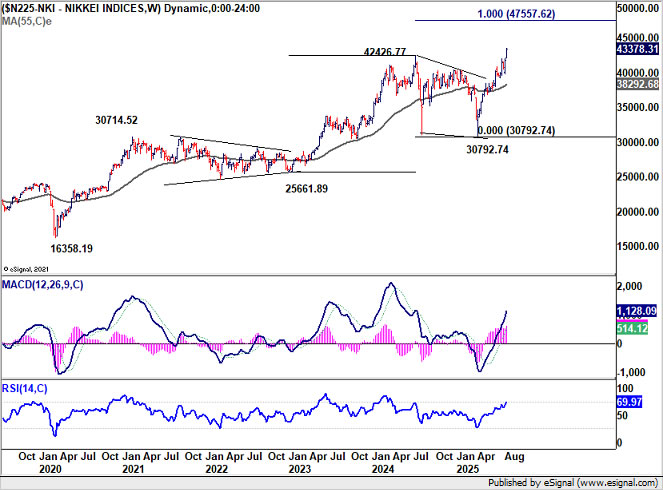
Technically, with 42426.77 key resistance cleared, Nikkei should now be targeting 100% projection of 25661.89 to 42426.77 from 30792.74 at 47557.62 in the medium term. Near term outlook will stay bullish as long as 39850.52 support holds, in case of retreat.
For Yen, the picture is less straightforward. Rising odds of a BoJ hike should be supportive, but equity strength and risk-on flows are undermining safe-haven demand. For now, the latter appears to be dominating, keeping the currency under pressure even as policy expectations tilt hawkish.
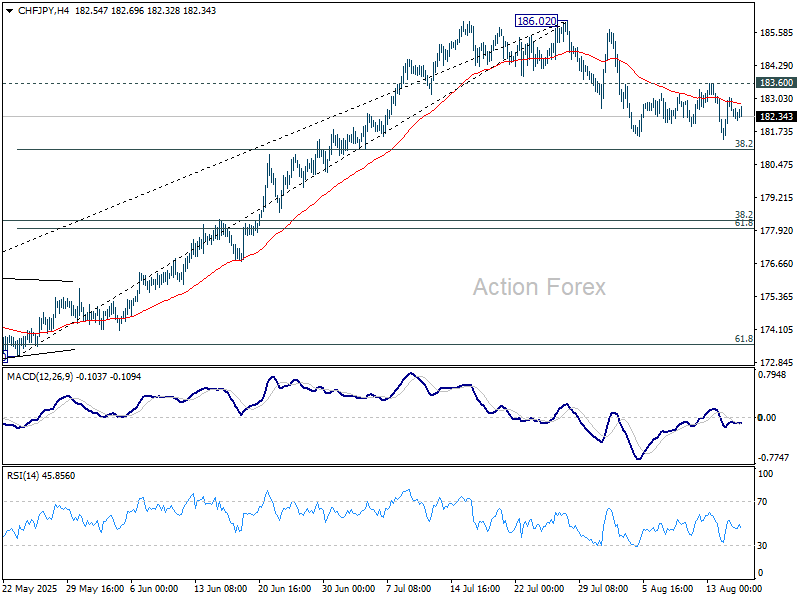
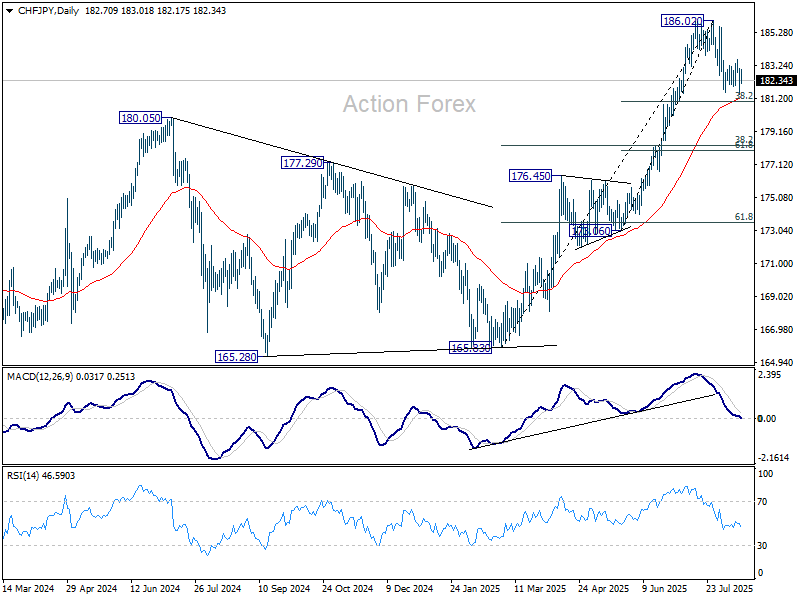
Even against the Swiss Franc, where monetary policy divergence should favor Yen, the currency has failed to mount a convincing rebound. CHF/JPY's pullback from 186.02 short term top is losing momentum as seen in 4H MACD. Even in case of another fall, downside could be contained by 38.2% retracement of 173.06 to 186.02 at 181.06, which is close to 55 D EMA (now at 181.26). Break of 183.60 resistance will bring retest of 186.02 high, with prospect of resuming larger up trend.
GBP/AUD Rises on UK Growth Beats, China Weakness Drags AUD
GBP/AUD was one of the standout movers in the FX market last week, climbing nearly 1% .
On the UK side, growth momentum surprised firmly to the upside. Q2 GDP expanded 0.3% qoq, above expectations, but the more striking signal came from June’s 0.4% mom surge. The pickup was broad-based across services, industrial and construction activity, countering fears of stagnation. Labor market data further supported the hawkish case for BoE, with unemployment steady at 4.7% and pay growth slowing only modestly. Together, the numbers reinforced the view that while BoE is in an easing cycle, it will proceed cautiously rather than aggressively.
In Australia, RBA cut rates by 25bps to 3.60% as widely expected. However, the tone of the accompanying forecasts was less dovish than markets had feared. Projections suggested room for only one more rate cut this year and two in 2026. In addition, the rebound in job creation reduced immediate pressure on the RBA to accelerate its easing cycle. While supportive in isolation, these positives for the Aussie Dollar were overshadowed elsewhere.
China’s economic data delivered a blow to regional sentiment. Industrial production, retail sales, and fixed-asset investment all slowed sharply, underscoring fragility in domestic demand. Given Australia’s heavy trade exposure to China, the releases dragged the Aussie lower despite a more balanced domestic backdrop.
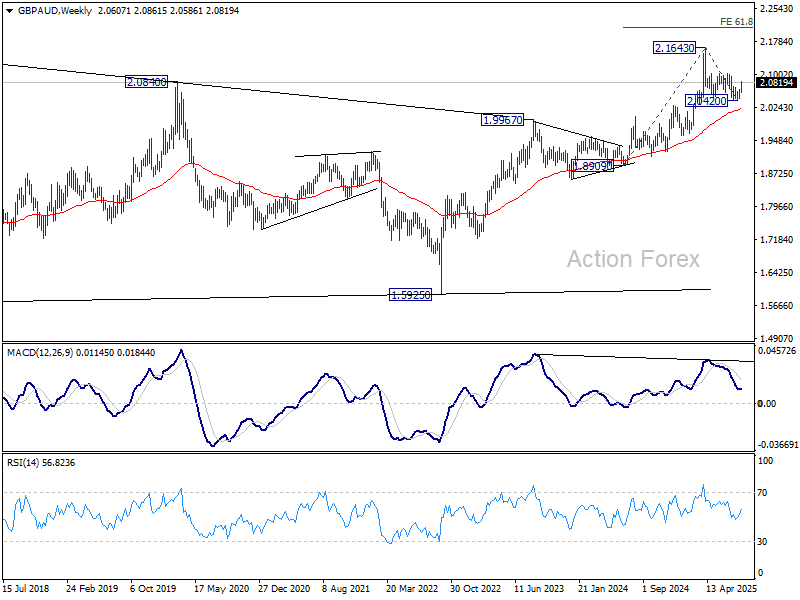
Technically, the extended rebound in GBP/AUD last week suggests that corrective pattern from 2.1643 has completed with three waves down to 2.0420. Further rise is now in favor to 2.1034 resistance first. Firm break there will solidify the case of up trend resumption and target 2.1643 high next.
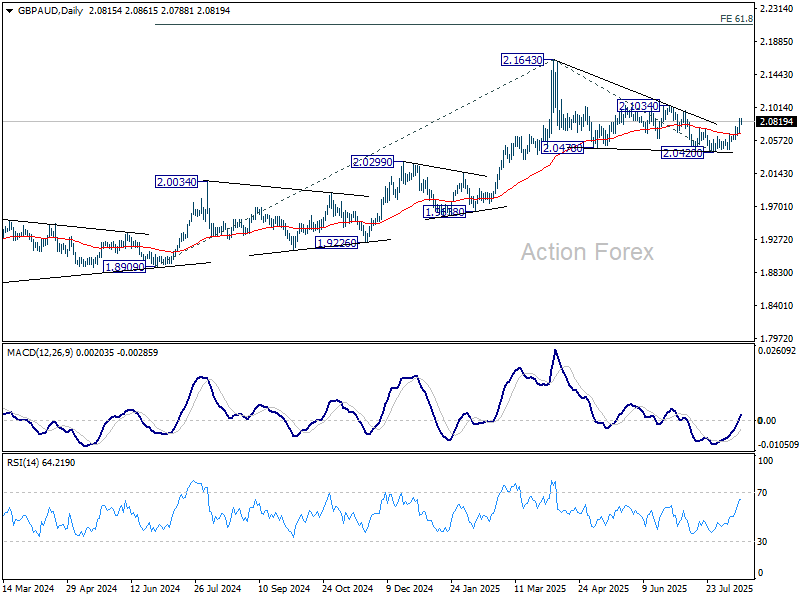
Looking longer-term, the uptrend from 1.5925 (2022 low) remains intact. On resumption, next medium term target is 61.8% projection of 1.8909 to 2.1643 from 2.0420 at 2.2110.
EUR/USD Weekly Outlook
EUR/USD edged higher to 1.1729 last week but retreated since then. Initial bias remains neutral this week for consolidations. Further rally is expected as long as 1.1589 support holds. Above 1.1729 will bring retest of 1.1829 high. On the downside, however, firm break of 1.1589 will turn bias to the downside, and extend the corrective pattern from 11829 with another fall.
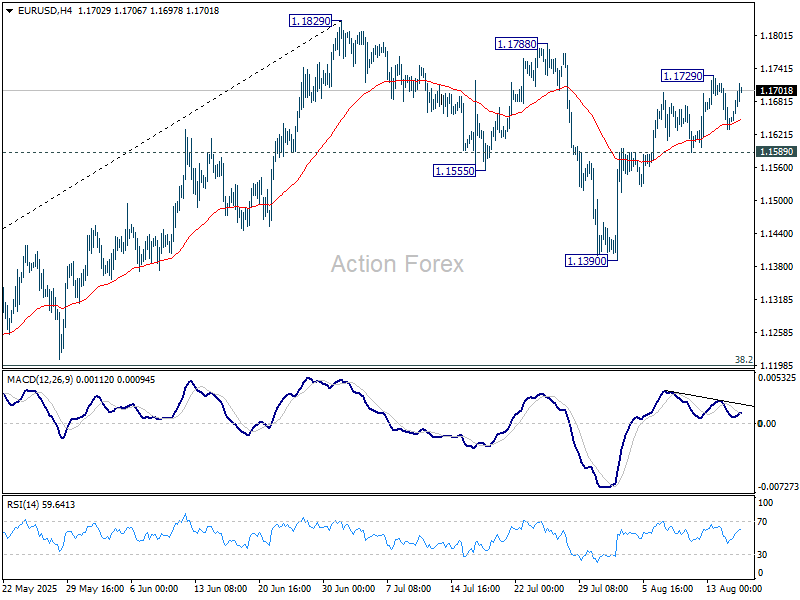
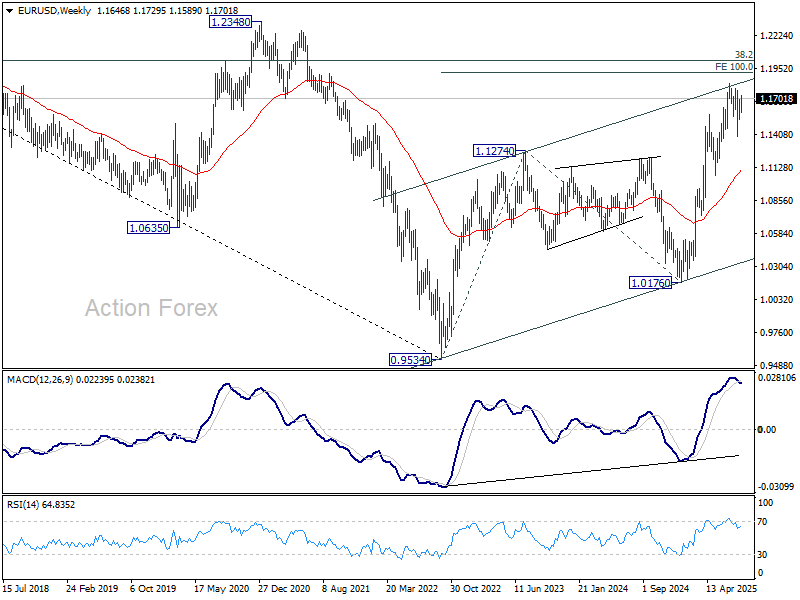
In the bigger picture, rise from 0.9534 long term bottom could be correcting the multi-decade downtrend or the start of a long term up trend. In either case, further rise should be seen to 100% projection of 0.9534 to 1.1274 from 1.0176 at 1.1916. This will remain the favored case as long as 1.1604 support holds.
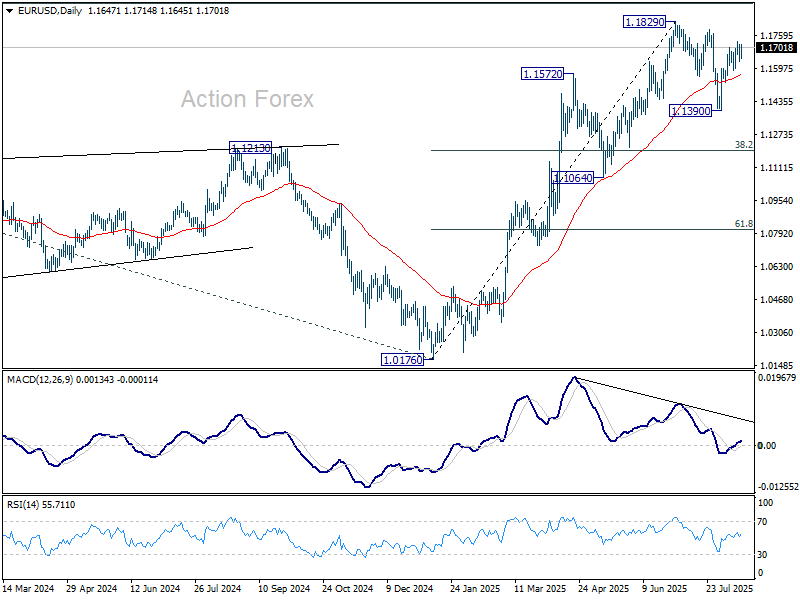
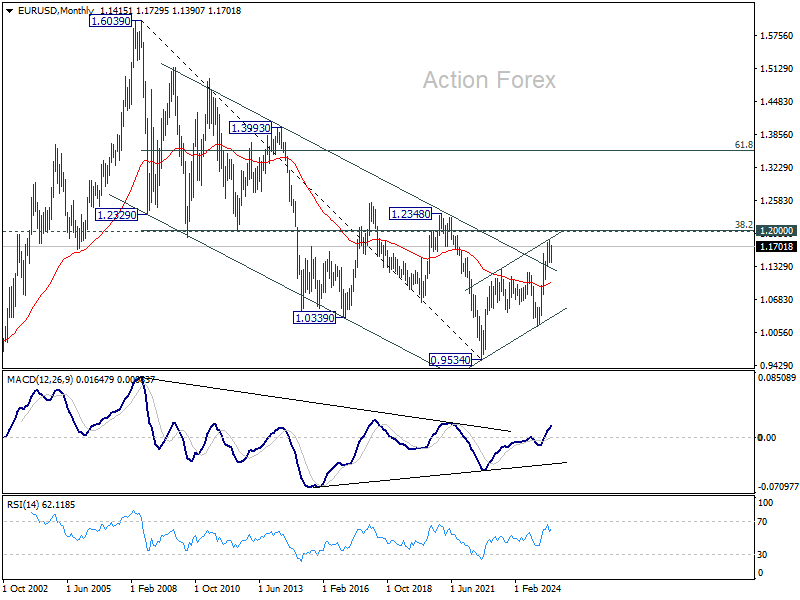
In the long term picture, a long term bottom was in place already at 0.9534, on bullish convergence condition in M MACD. Further rise should be seen to 38.2% retracement of 1.6039 to 0.9534 at 1.2019. Rejection by 1.2019 will keep the price actions from 0.9534 as a corrective pattern. But sustained break of 1.2019 will suggest long term bullish trend reversal, and target 61.8% retracement at 1.3554.
EUR/USD Weekly Outlook
EUR/USD edged higher to 1.1729 last week but retreated since then. Initial bias remains neutral this week for consolidations. Further rally is expected as long as 1.1589 support holds. Above 1.1729 will bring retest of 1.1829 high. On the downside, however, firm break of 1.1589 will turn bias to the downside, and extend the corrective pattern from 11829 with another fall.
In the bigger picture, rise from 0.9534 long term bottom could be correcting the multi-decade downtrend or the start of a long term up trend. In either case, further rise should be seen to 100% projection of 0.9534 to 1.1274 from 1.0176 at 1.1916. This will remain the favored case as long as 1.1604 support holds.
In the long term picture, a long term bottom was in place already at 0.9534, on bullish convergence condition in M MACD. Further rise should be seen to 38.2% retracement of 1.6039 to 0.9534 at 1.2019. Rejection by 1.2019 will keep the price actions from 0.9534 as a corrective pattern. But sustained break of 1.2019 will suggest long term bullish trend reversal, and target 61.8% retracement at 1.3554.
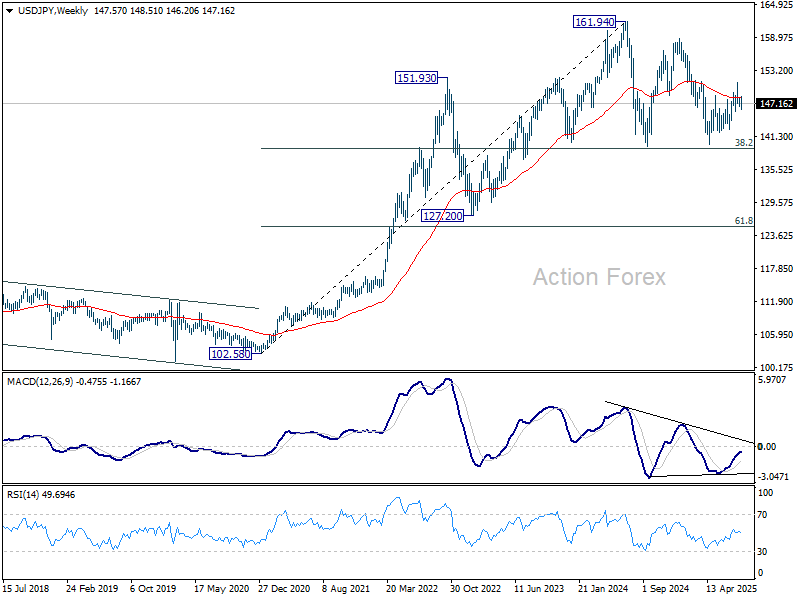
USD/JPY Weekly Outlook
USD/JPY edged lower to 146.20 last week but recovered ahead of 145.84 support. Initial bias stays neutral this week first. On the upside, break of 148.51 will indicate that the pullback from 150.90 has completed, and bring retest of this high. This will also keep the whole rise from 139.87 alive. However, firm break of 145.84 support will argue that the rebound from 139.87 has completed, and turn near term outlook bearish.
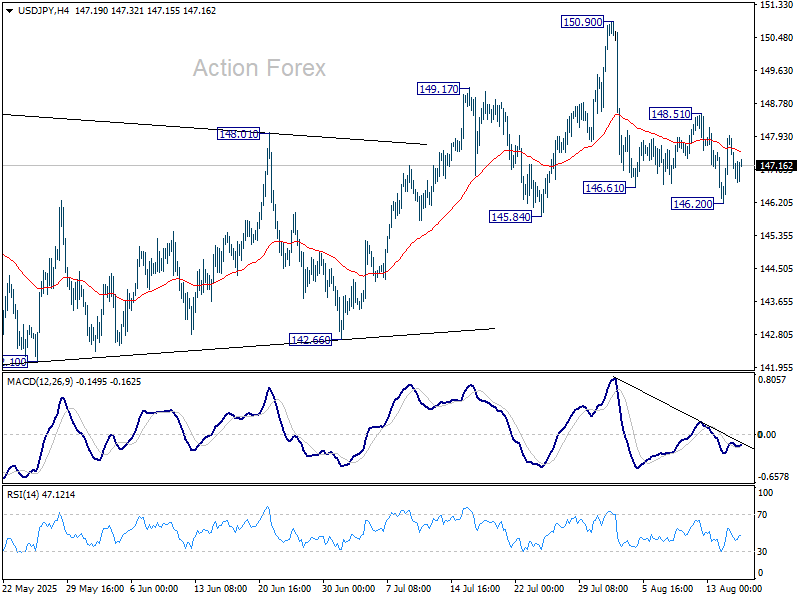
In the bigger picture, price actions from 161.94 (2024 high) are seen as a corrective pattern to rise from 102.58 (2021 low). Decisive break of 61.8% retracement of 158.86 to 139.87 at 151.22 will argue that it has already completed with three waves at 139.87. Larger up trend might then be ready to resume through 161.94 high. In case the corrective pattern extends with another fall, strong support is expected from 38.2% retracement of 102.58 to 161.94 at 139.26 to bring rebound.
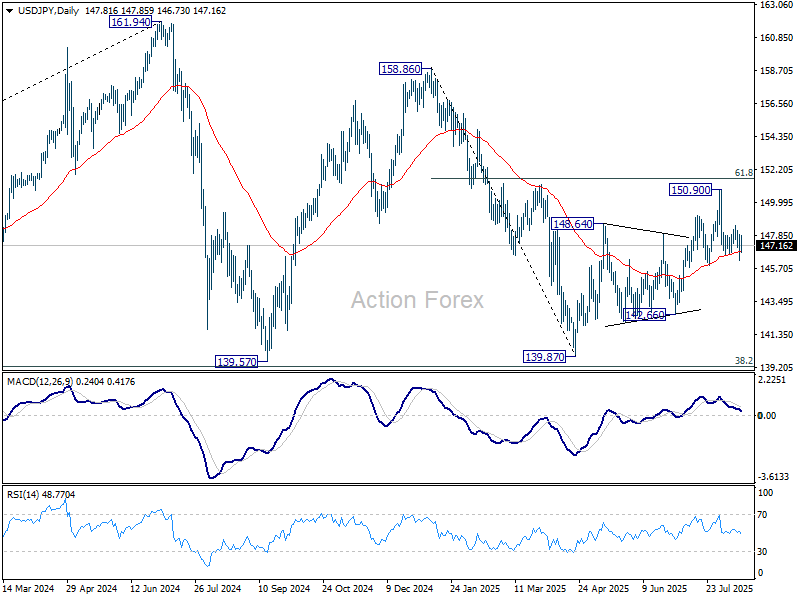
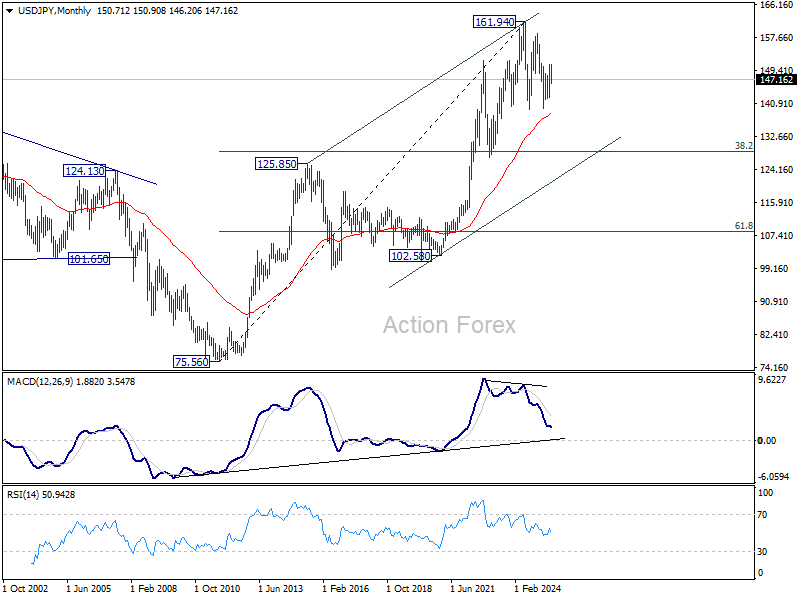
In the long term picture, there is no sign that up trend from 75.56 (2011 low) has completed. But then, firm break of 161.94 is needed to confirm resumption. Otherwise, more medium term range trading could still be seen.
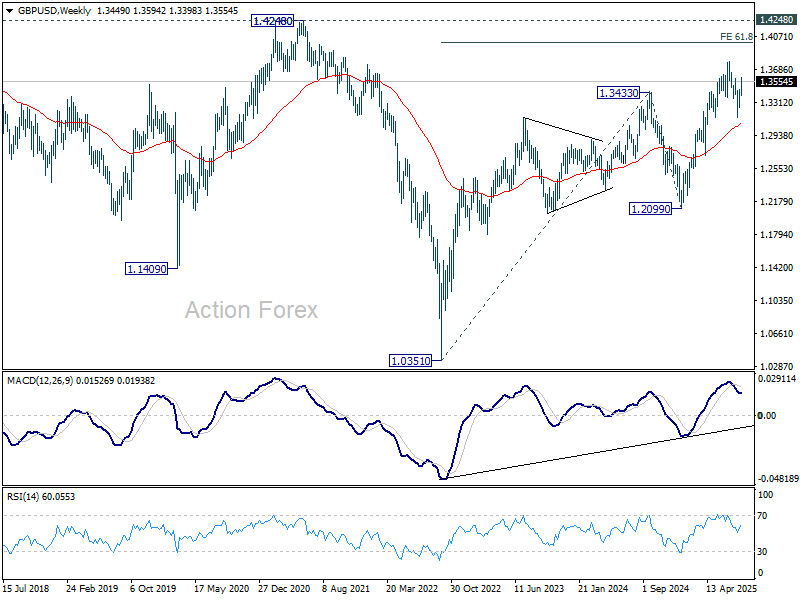
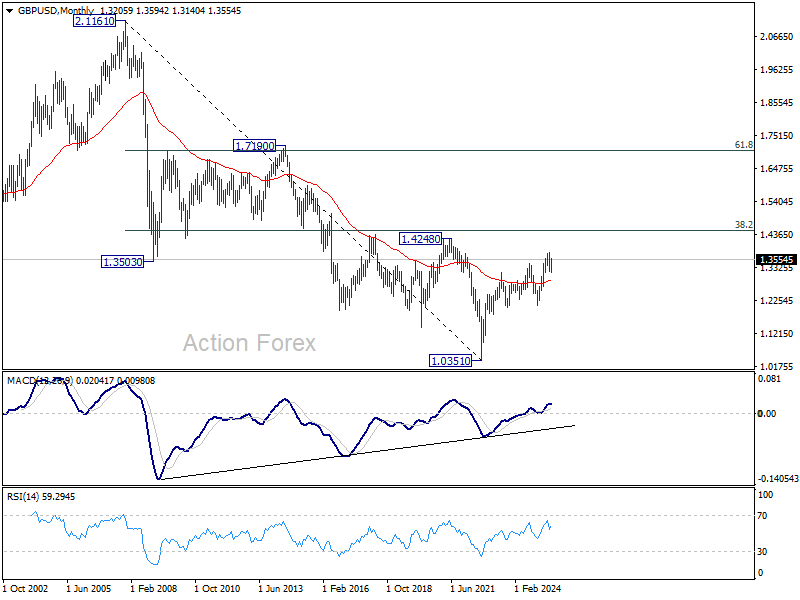
GBP/USD Weekly Outlook
GBP/USD's rally extended to 1.3594 last week and breached 1.3587 resistance. But a temporary top was formed with subsequent retreat. Initial bias remains neutral this week for consolidations. Downside of pullback should be contained above 1.3398 support. On the upside, break of 1.3594 will resume the rise from 1.3140 to retest 1.3787 high.
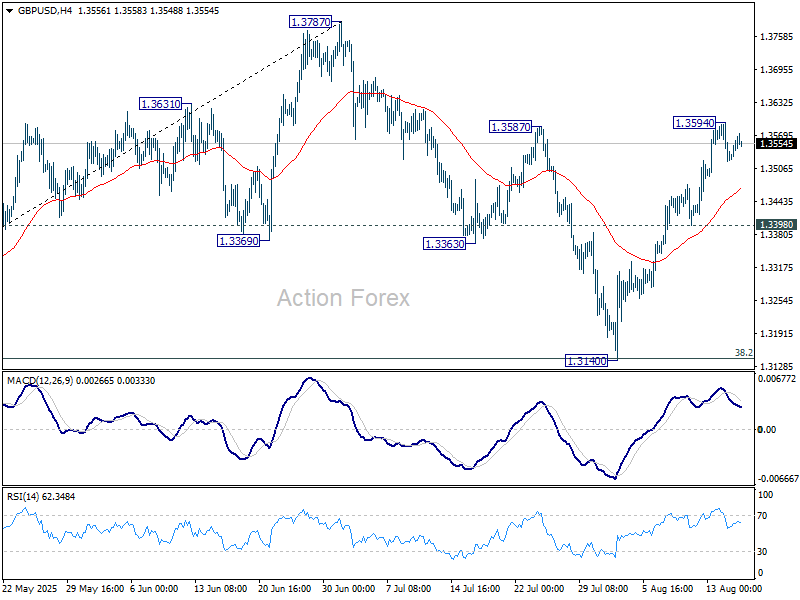
In the bigger picture, up trend from 1.3051 (2022 low) is in progress. Next medium term target is 61.8% projection of 1.0351 to 1.3433 from 1.2099 at 1.4004. Outlook will now stay bullish as long as 55 W EMA (now at 1.3073) holds, even in case of deep pullback.
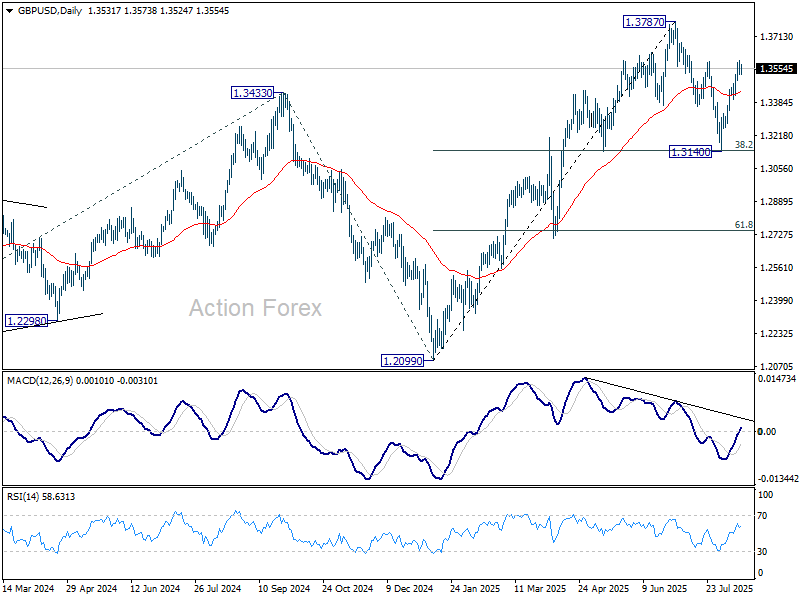
In the long term picture, for now, price actions from 1.0351 (2022 low) are still seen as a corrective pattern to the long term down trend from 2.1161 (2007 high) only. However, firm break of 1.4248 resistance (38.2% retracement of 2.1161 to 1.0351 at 1.4480) will be a strong sign of long term bullish reversal.
USD/CHF Weekly Outlook
USD/CHF stayed in consolidation inside 0.8020/8170 last week. Initial bias remains neutral this week first. On the downside, break of 0.8020 will revive that case that the corrective pattern from 0.7871 has completed, and target a retest on 0.7871 low. On the upside, firm break of 0.8710 will resume the corrective from 0.7871. Intraday bias will be back on the upside for 38.2% retracement of 0.9200 to 0.7871 at 0.8379.
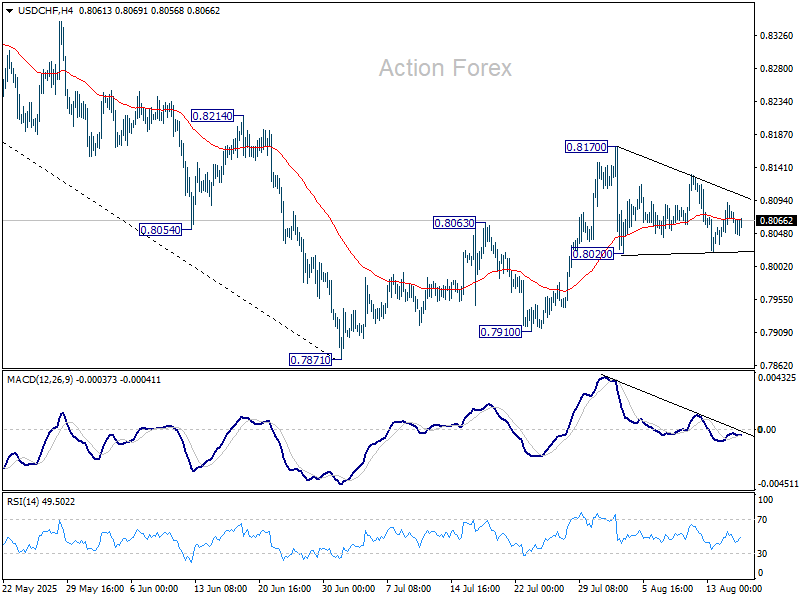
In the bigger picture, long term down trend from 1.0342 (2017 high) is still in progress. Next target is 100% projection of 1.0146 (2022 high) to 0.8332 from 0.9200 at 0.7382. In any case, outlook will stay bearish as long as 0.8475 resistance holds.
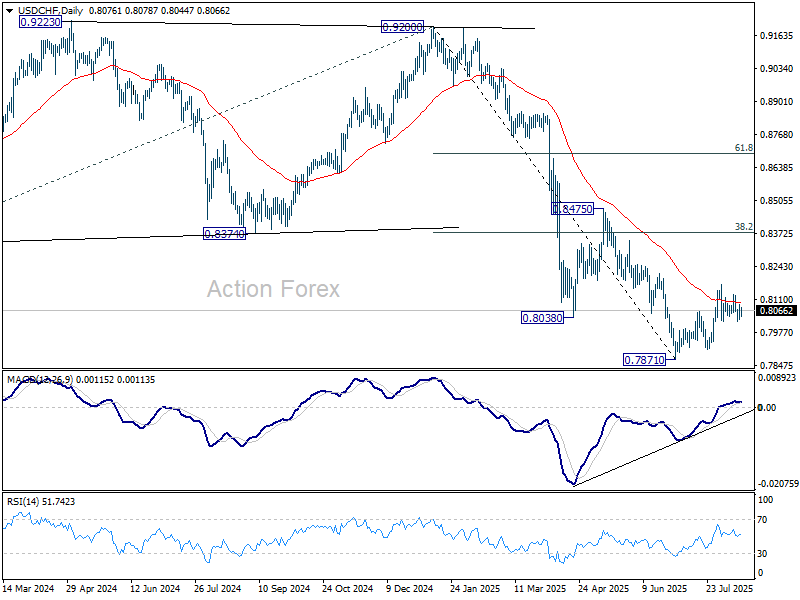
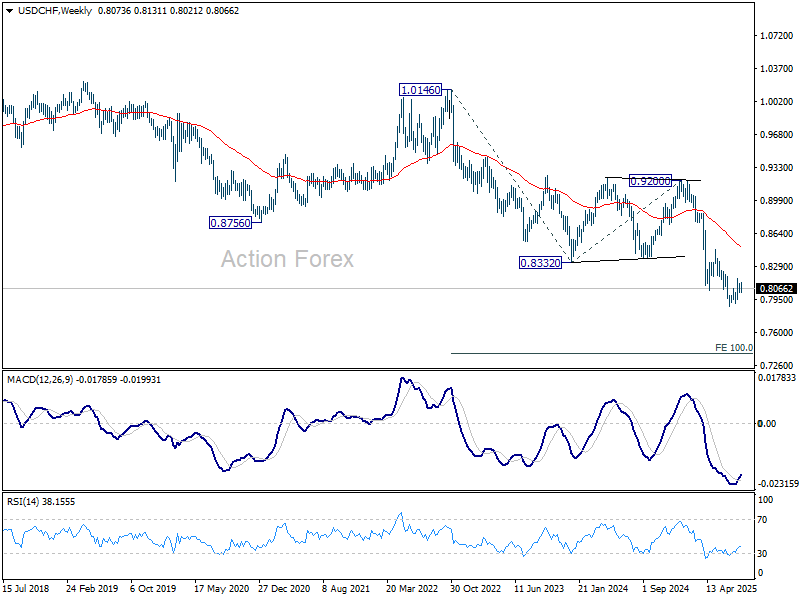
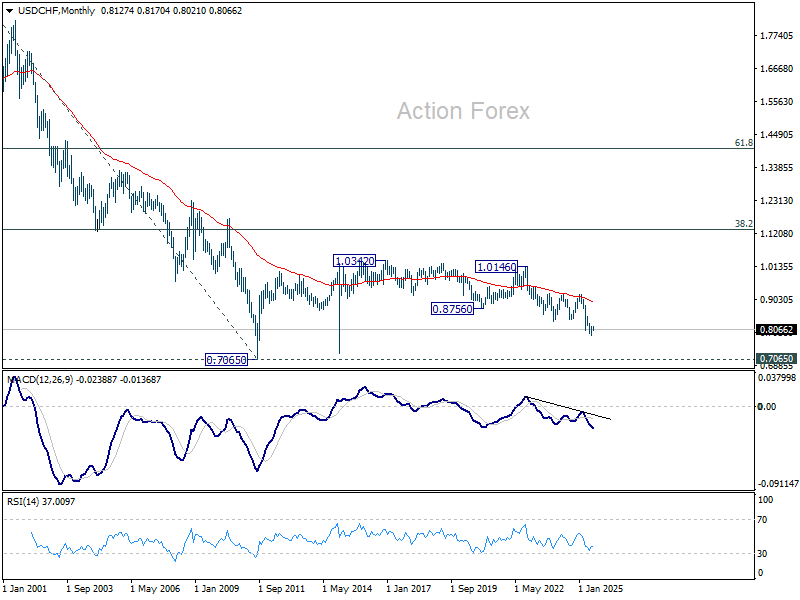
In the long term picture, price action from 0.7065 (2011 low) are seen as a corrective pattern to the multi-decade down trend from 1.8305 (2000 high). It's uncertain if the fall from 1.0342 is the second leg of the pattern, or resumption of the downtrend. But in either case, outlook will stay bearish as long as 0.9200 resistance holds. Retest of 0.7065 should be seen next.
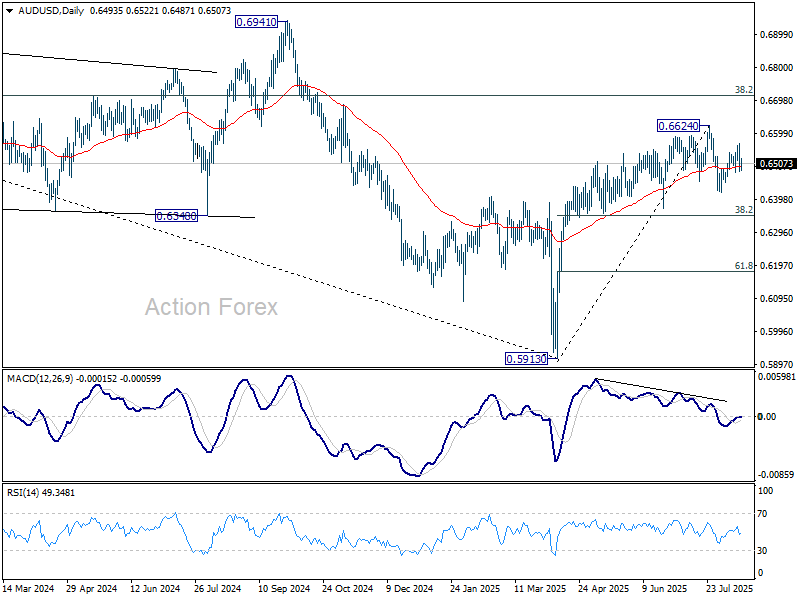
AUD/USD Weekly Report
AUD/USD retreated sharply after edging higher to 0.6567 last week but downside is contained above 0.6481 minor support so far. Initial bias stays neutral this week first. Overall, corrective pattern from 0.6624 should still be extending. Above 0.6567 will target 0.6624. Firm break of 0.6481 will resume the correction through 0.6418 to 38.2% retracement of 0.5913 to 0.6624 at 0.6352.
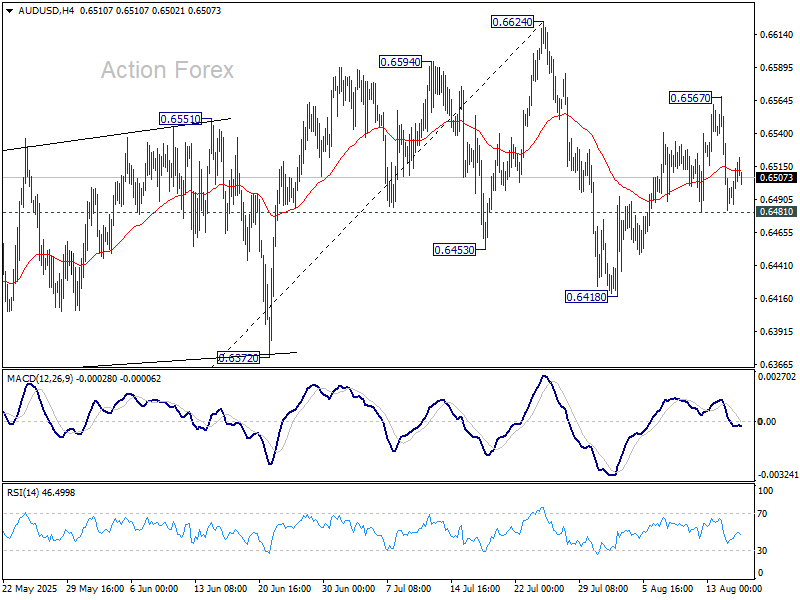
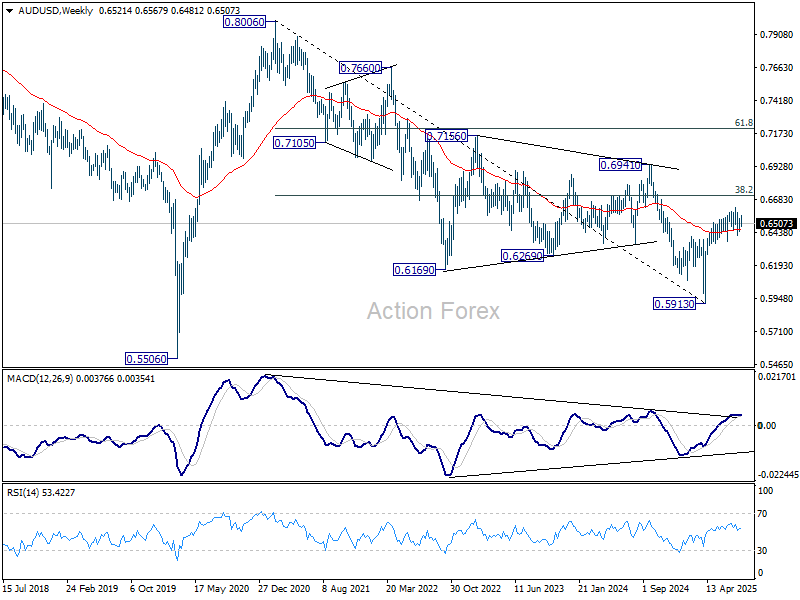
In the bigger picture, there is no clear sign that down trend from 0.8006 (2021 high) has completed. Rebound from 0.5913 is seen as a corrective move. While stronger rally cannot be ruled out, outlook will remain bearish as long as 38.2% retracement of 0.8006 to 0.5913 at 0.6713 holds. Nevertheless, considering bullish convergence condition in W MACD, even in case of another fall through 0.5913, downside should be contained above 0.5506 (2020 low).
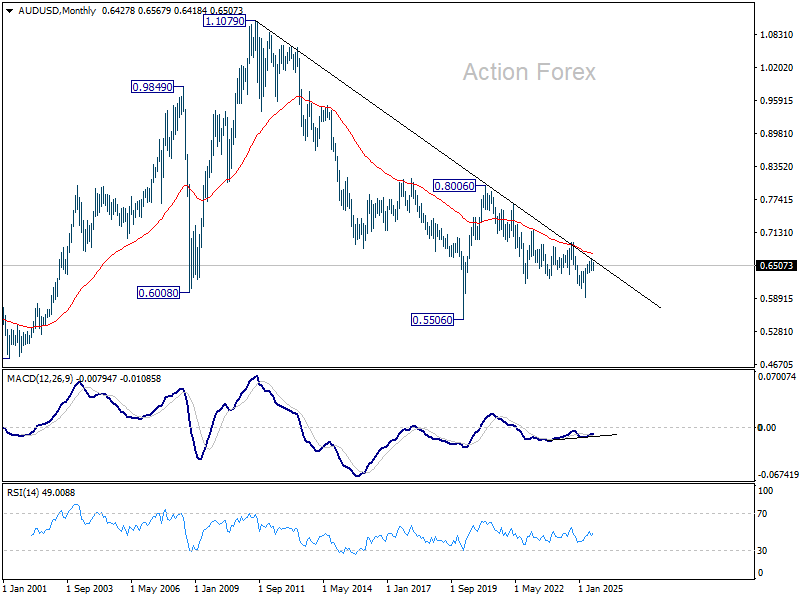
In the long term picture, fall from 0.8006 is seen as the second leg of the corrective pattern from 0.5506 long term bottom (2020 low). Hence, in case of deeper decline, strong support should emerge above 0.5506 to contain downside to bring reversal. On the upside, firm break of 0.6941 will argue that the third leg has already started back to 0.8006.
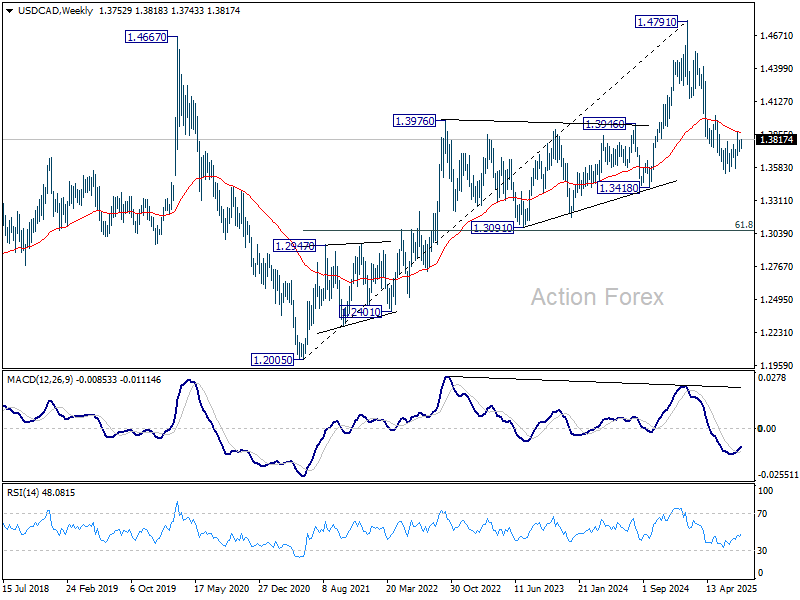
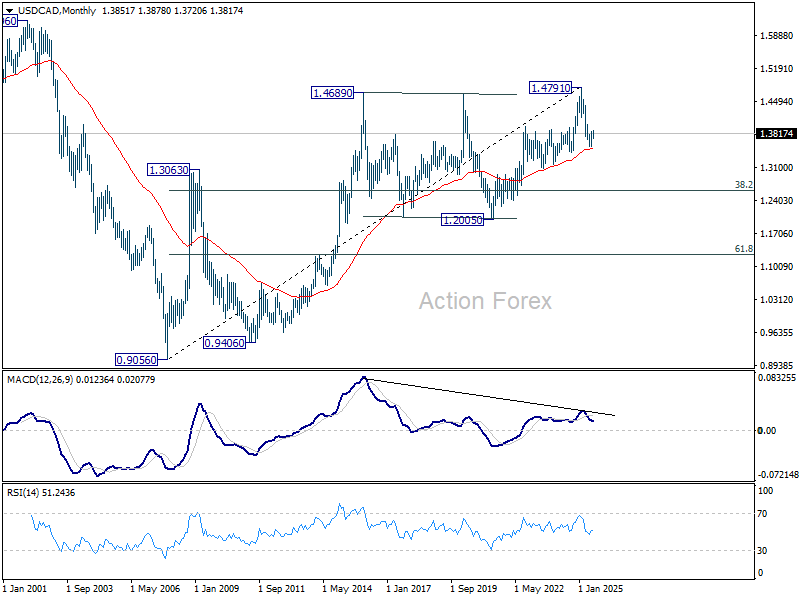
USD/CAD Weekly Outlook
USD/CAD's recovery from 1.3720 extended higher last week and the breach of 1.3809 suggests that pullback from 1.3878 has completed. Initial bias is mildly on the upside this week for 1.3878 first. Firm break there will resume the whole rebound from 1.3538 towards 1.4014 cluster resistance. On the downside, below 1.3720 will resume the fall fro 1.3878 instead.
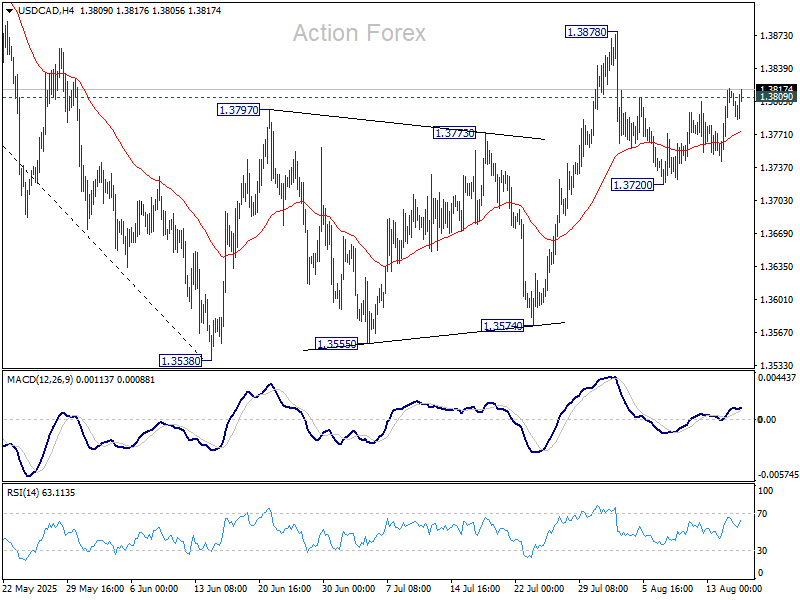
In the bigger picture, price actions from 1.4791 medium term top could either be a correction to rise from 1.2005 (2021 low), or trend reversal. In either case, further decline is expected as long as 1.4014 cluster resistance holds (38.2% retracement of 1.4791 to 1.3538 at 1.4017). Next target is 61.8% retracement of 1.2005 (2021 low) to 1.4791 at 1.3069.
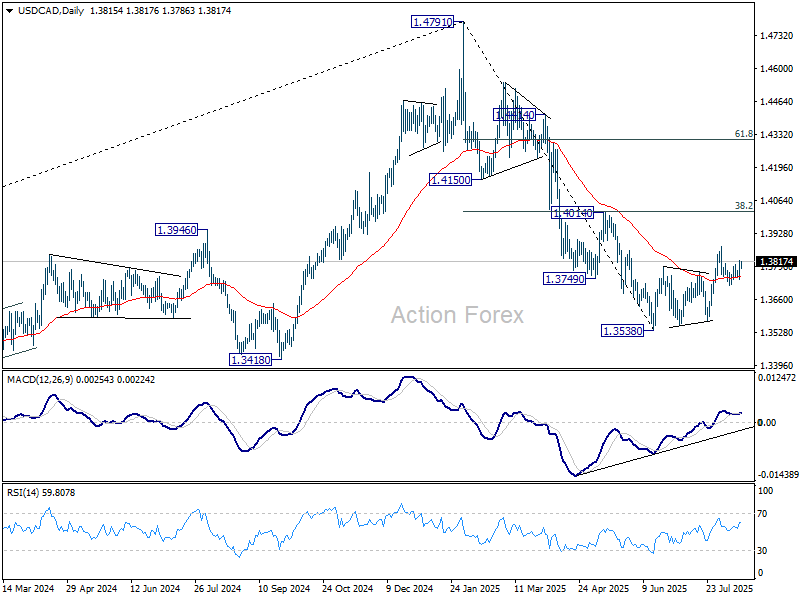
In the long term picture, as long as 55 M EMA (now at 1.3511) holds, up trend from 0.9056 (2007 low) should still resume through 1.4791 at a later stage. However, sustained trading below 55 M EMA will argue that the up trend has already completed, with rise from 1.2005 to 1.4791 as the fifth wave. 1.4791 would then be seen as a long term top and deeper medium term down trend should then follow.