

Sample Category Title
Is Confidence Returning to the Dollar?
- The US launch of Operation ‘Economic Outcast’ against Iran has boosted the dollar.
- Oil prices fell on the back of the news, but the outlook for Brent looks ‘bullish’.
The US dollar staged a three-day rally from its lowest levels since May against the backdrop of escalating trade tensions between the US and Canada, the imposition of sweeping sanctions by Washington against Iran, and the resulting fall in stock indices. Risk appetite fell, and with it, demand for the greenback as a safe-haven asset rose.
Scott Bessent launched Operation ‘Economic Outcast’ against Iran. It includes sanctions against more than 60 organisations, as well as monitoring every hub, intermediary and network that Tehran uses to smuggle oil and circumvent the imposed restrictions.
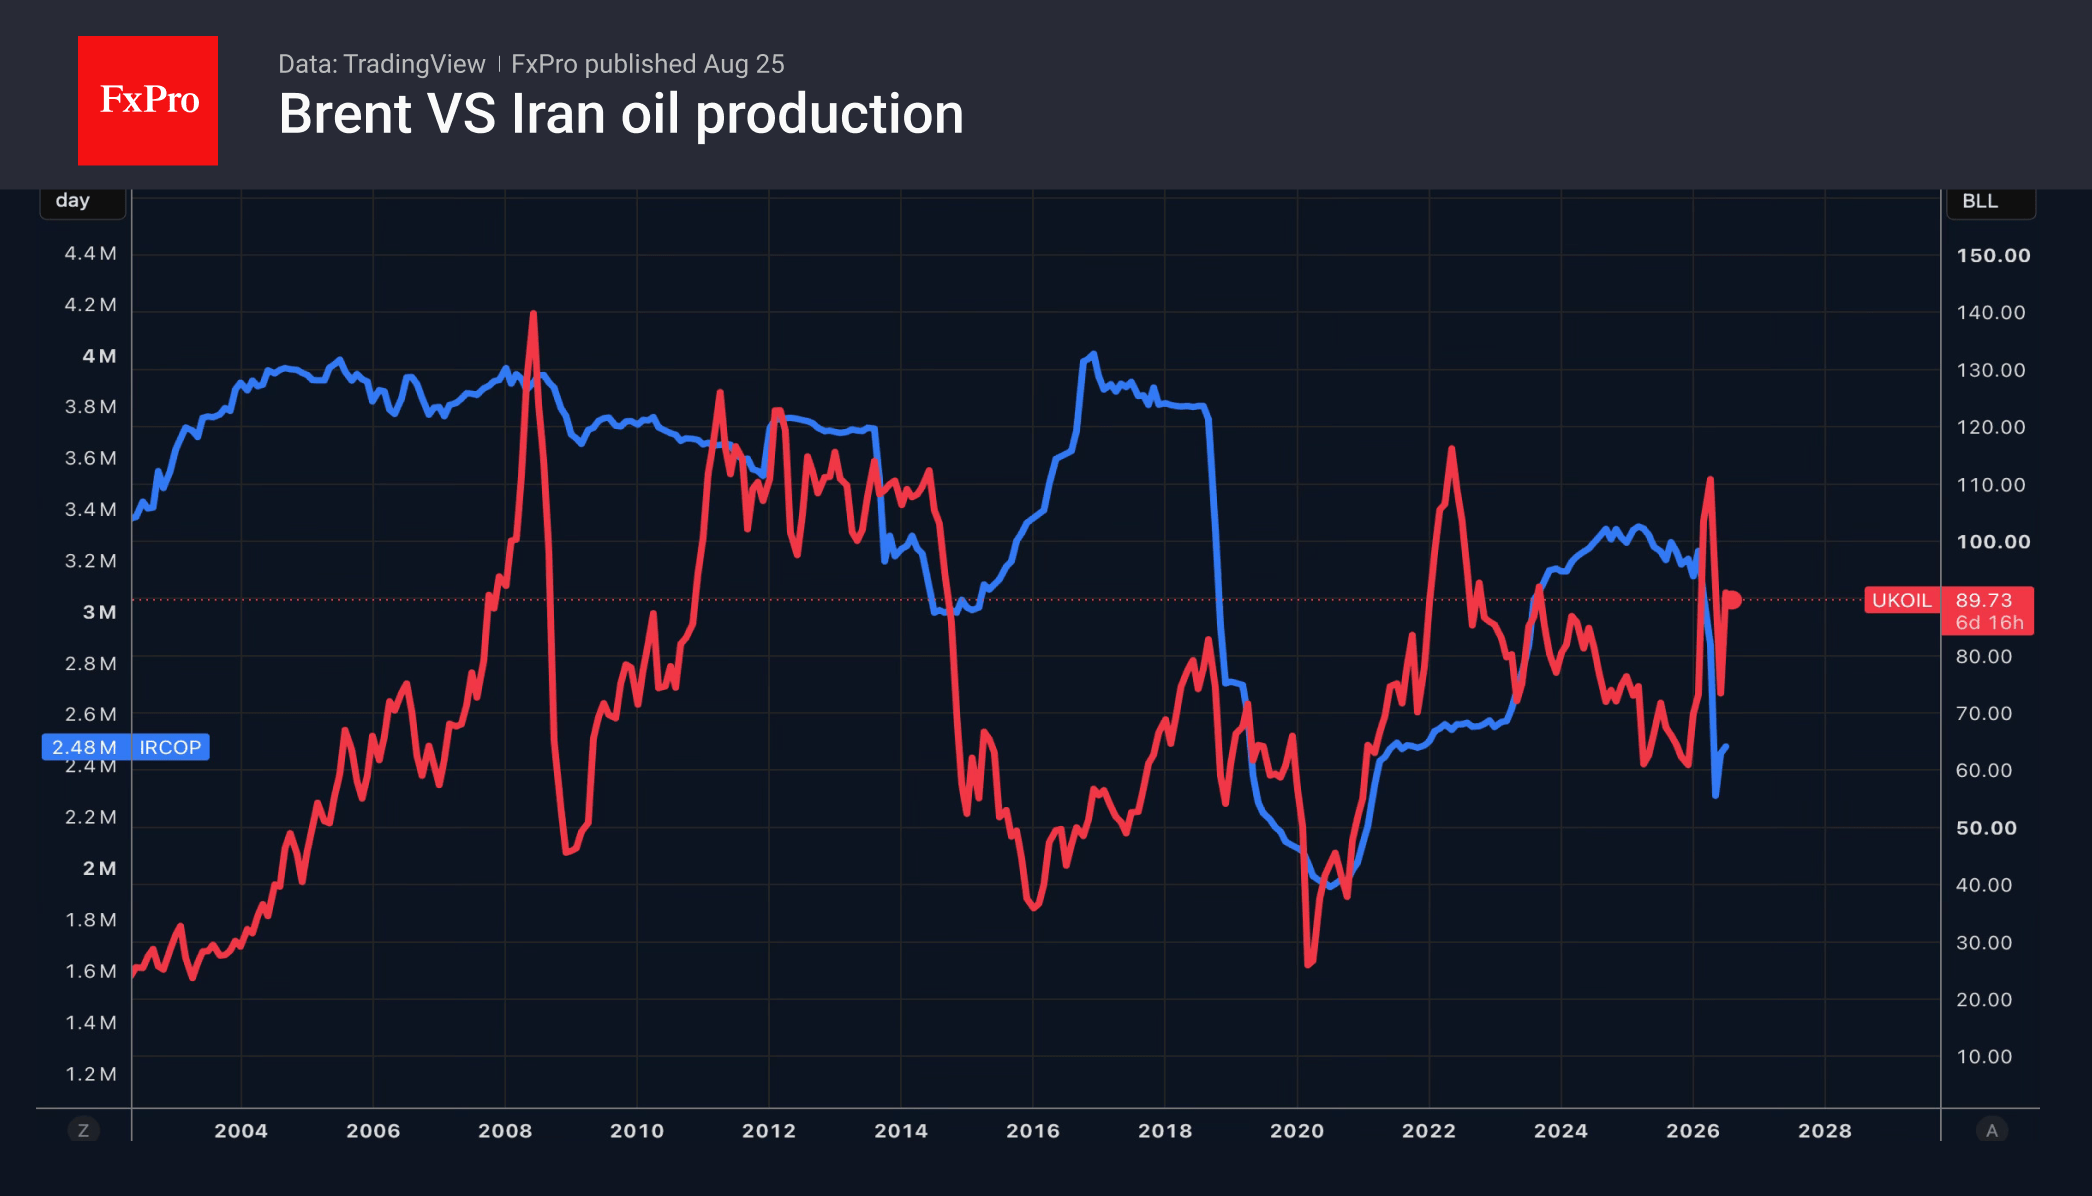
Brent reacted with a fall following a six-day rally, in line with the ‘buy the rumour, sell the fact’ principle. However, the long-term prospects of Iran’s isolation are negative for the oil market. This implies a further reduction in supplies, which will result in rising prices.
The question is: how will China react? China buys around 90% of its oil from Iran. Without China’s cooperation, cutting Iran off from the global oil market would be virtually impossible. At the same time, Beijing’s reluctance to compromise with the US risks triggering a new trade war and a slowdown in the global economy. This pessimistic scenario is driving investors to seek safe havens, and the greenback offers a refuge. At the same time, there is a growing realisation that the sanctions are based on the dollar-centred monetary system, which remains firmly in place.
Another cause for concern is the breakdown in negotiations between the US and Canada, which has led to the imposition of large-scale tariffs on Ottawa. Canada has promised to retaliate dollar for dollar, a move that risks further escalation. As a result, USDCAD recorded its best daily performance in two months.
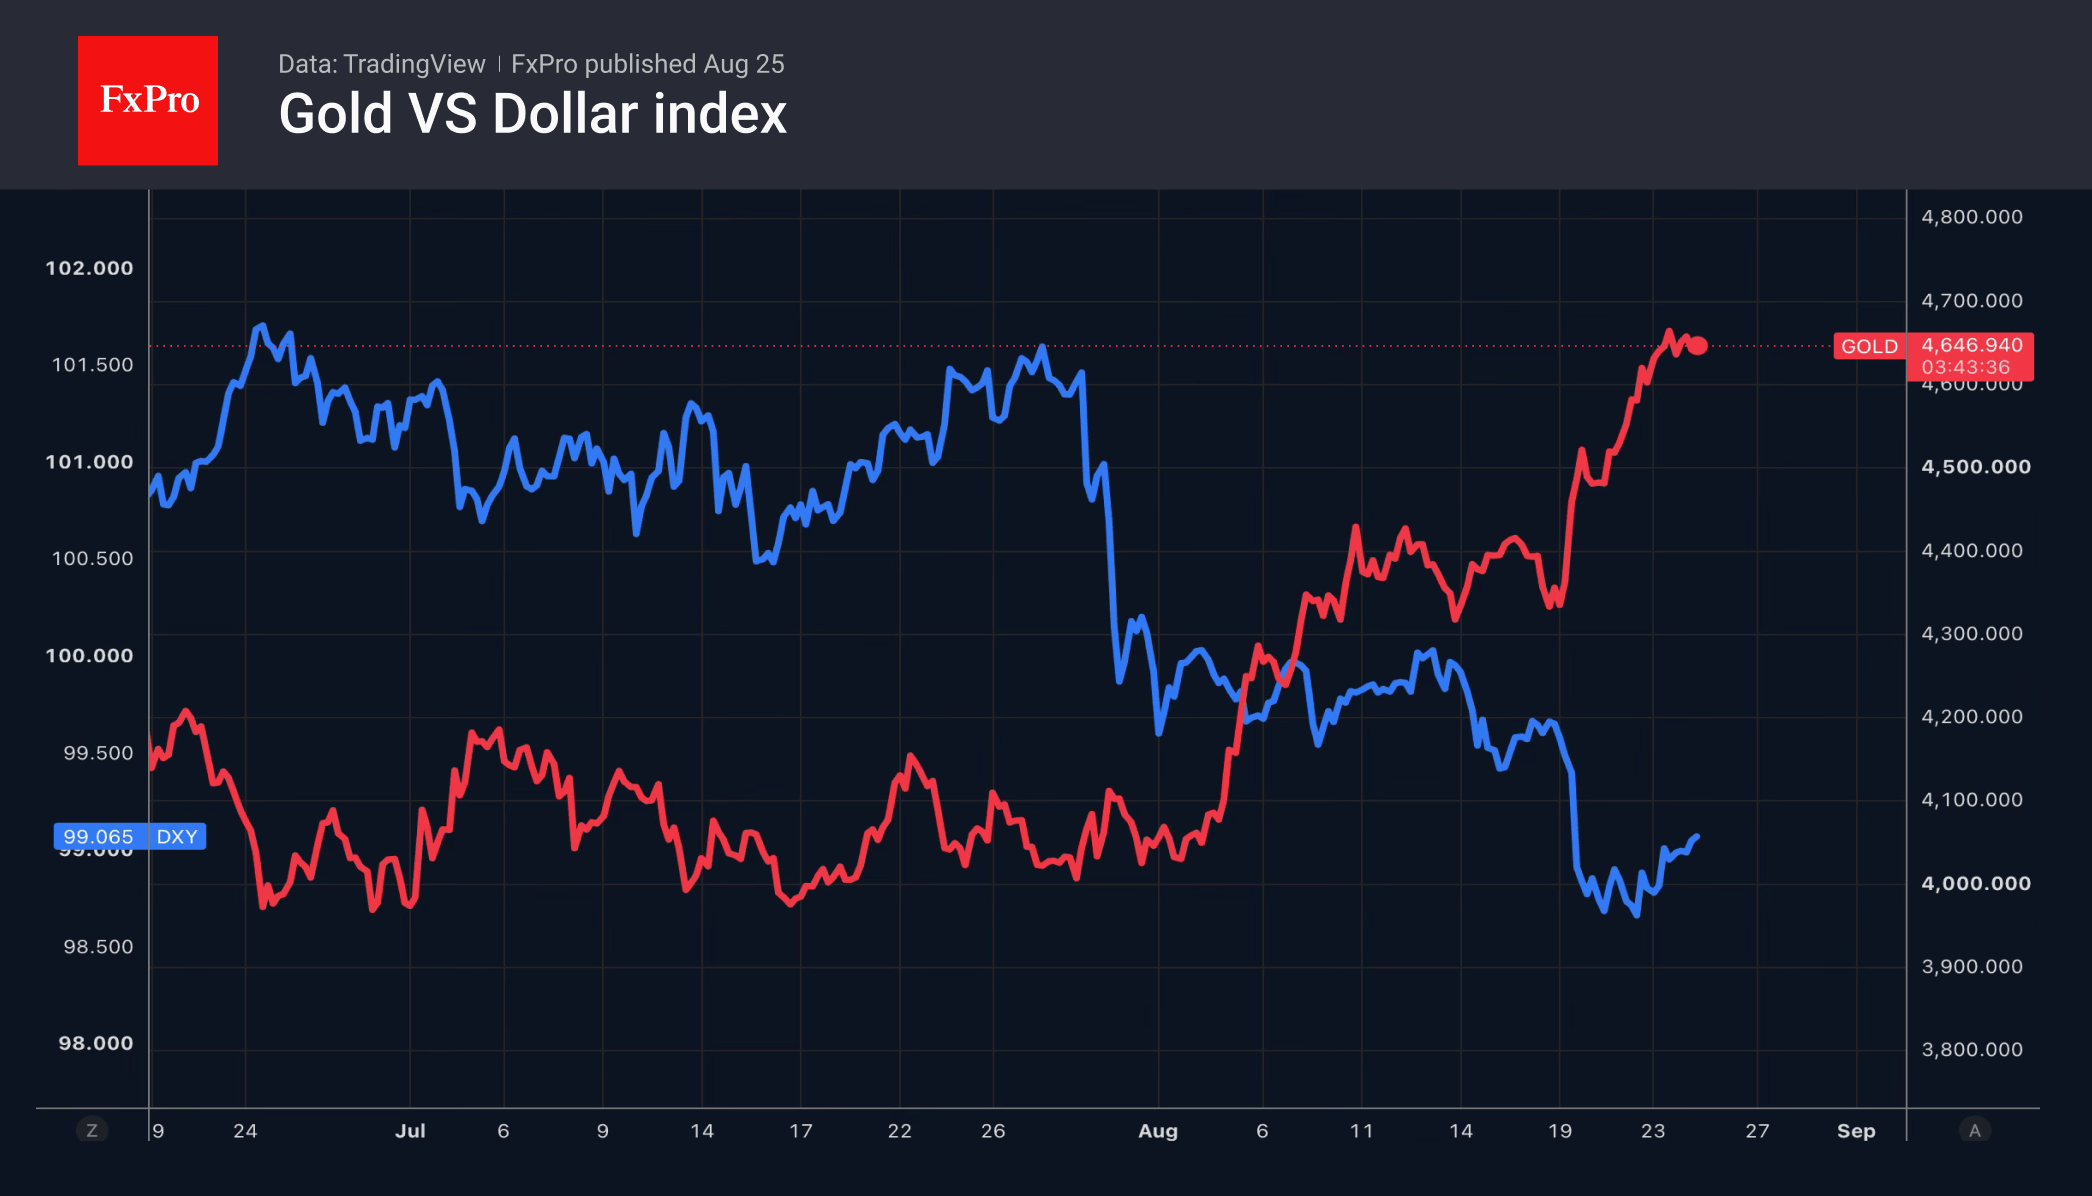
Gold retreated from its recent highs amid profit-taking following a prolonged rally and the strengthening of the US dollar. Nevertheless, XAUUSD’s main trump card – the ‘debasement trade’ – remains in play, allowing the ‘bulls’ to wait for an opportunity to launch a fresh attack.
USDJPY has resumed its upward trend and is approaching the 160 mark, above which the risk of verbal and, subsequently, currency interventions will increase. The futures market is pricing in an 82% probability of a BoJ rate rise in September, and the numerous speeches by officials are unlikely to disappoint it.
The FxPro Analyst Team
GBP/USD Holds Near Highs: Focus Turns to Key Events Later This Week
GBP/USD is holding at 1.3627 on Tuesday. In the final full week of August, the pair remains near its highest level since mid-February. Sterling is being supported by dollar weakness following the US Treasury’s unexpected decision to at least double its purchases of long-term government bonds.
Investors are also awaiting details of new sanctions against Iran. The highlight of the week will be Fed Chair Kevin Warsh’s speech at Jackson Hole on Friday, which could shape expectations for the future trajectory of US interest rates.
In the UK, money markets continue to price in one Bank of England rate hike before year-end and a further 25-basis-point move by early 2027. July inflation accelerated to 2.9% – the highest since March – while core inflation came in above expectations at 2.6%.
Further support for the pound is coming from strong domestic data: PMIs point to a pick-up in business activity, while consumer confidence climbed to a two-year high in August. At the same time, high inflation remains the key risk, potentially fuelled by a protracted conflict with Iran and elevated energy prices.
Technical Analysis
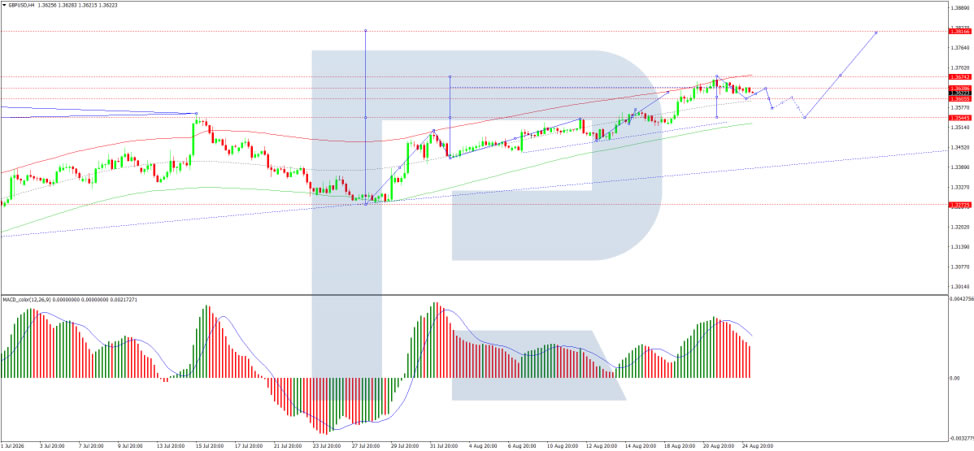
On the H4 GBP/USD chart, the market has nearly reached the local upside target at 1.3672 and is forming a narrow consolidation range below this level, currently extending between 1.3619 and 1.3650. A new compact consolidation range is expected to form below 1.3672. A downside breakout would open the way for a move lower towards 1.3550. The MACD indicator supports this scenario, with its signal line above zero and beginning to turn downwards.
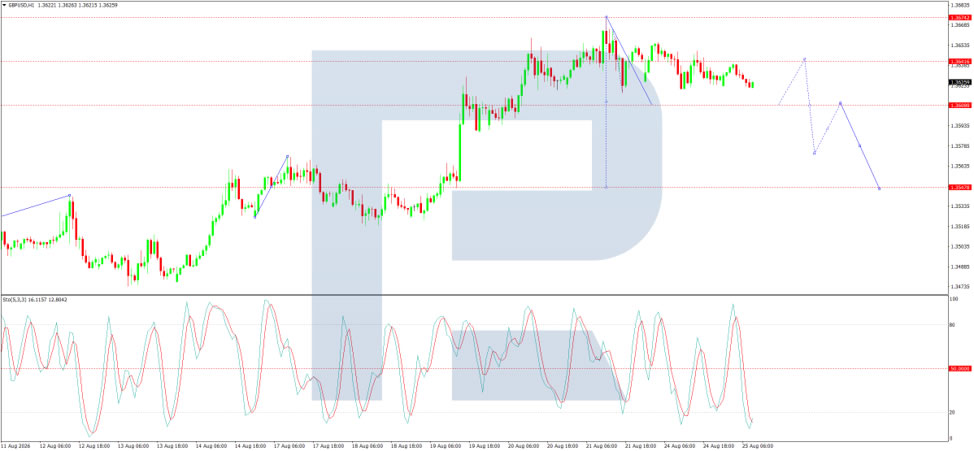
On the H1 chart, the market has formed a compact consolidation range around the 1.3640 level, currently extending between 1.3618 and 1.3650. A move lower towards 1.3600 is expected, and a break below this level would open the way for a further decline to 1.3550. The Stochastic oscillator confirms this scenario, with its signal line below 50 and trending downward towards 20, indicating short-term downside pressure.
Conclusion
GBP/USD remains near multi-month highs, supported by dollar weakness following the US Treasury’s bond buyback announcement and strong UK economic data. Markets are now focused on upcoming catalysts, including details of new sanctions against Iran and Fed Chair Warsh’s Jackson Hole speech on Friday, which could shape expectations for US interest rates. In the UK, money markets continue to price in further BoE tightening, supported by accelerating inflation and improving business activity and consumer confidence data. However, high inflation and geopolitical risks remain key concerns. Technically, the pair may see a short-term pullback towards 1.3600, with a break below this level opening the way towards 1.3550. The near-term direction will depend on central bank signals and geopolitical developments.
Bitcoin Breaks $80K—Can Two Catalysts Carry It Back to $100K?
TL;DR: Bitcoin pushed above $80,000 on the same fiscal-credibility trade lifting Gold, plus renewed optimism over US crypto regulation ahead of the September 15 CLARITY Act vote — with 83,901 resistance now the first proof point on the path back to $100K.
Bitcoin’s Rally Has Two Engines
Bitcoin pushed above $80,000 for first time since May, extending a surge that began below $65,000 only days earlier. Two distinct themes have powered move. First is same fiscal-credibility, or “debasement,” trade already visible in Gold after Treasury expanded long-duration buybacks. Second is renewed optimism over US crypto regulation, centered on September 15 CLARITY Act vote and possibility that SEC guidance could open further institutional participation even if legislation stalls.
Those themes have been reinforced by unusually powerful positioning flows. Roughly $4bn of Bitcoin shorts were liquidated over past week, while spot ETF inflows reportedly reached around $1.5–1.9bn depending on cutoff. Those flows help explain speed of move, but underlying case is broader: Bitcoin is benefiting simultaneously from distrust of traditional fiscal architecture and improving prospects for institutional access.
Kendrick Sees Treasury-Fed Concerns as “Turn of the Tide”
Standard Chartered global head of digital assets research Geoff Kendrick put that connection unusually clearly in an Aug. 22 interview with BNN Bloomberg. He identified Treasury’s buyback signal as most important development behind latest move and compared current setup with Bitcoin’s reaction to Silicon Valley Bank collapse in 2023.
Kendrick said that when events such as SVB—or “US Treasury or Fed independence type stories”—emerge, “for me that’s the turn of the tide.” His argument is not simply that lower yields support speculative assets. Rather, episodes that raise questions about banking, fiscal or institutional credibility increase relative appeal of assets outside traditional monetary system. That puts Bitcoin alongside Gold in current fiscal-credibility trade, even if crypto’s higher beta produces much larger price swings.
His very short-term call has already aged well. Speaking on Aug. 22, Kendrick said Bitcoin could trade in the “80s something” within days. Bitcoin subsequently moved above $80,000 inside that window.
CLARITY Is Important, but Not All-or-Nothing
Kendrick also tied rally to improving US regulatory outlook. He highlighted September 15 CLARITY Act vote and noted prediction-market odds of passage this year had recovered from around 10% to close to 30%.
But his institutional-flow argument does not depend entirely on Congress. Kendrick said either passage of CLARITY or sufficiently clear SEC guidelines could allow banks and other traditional institutions to increase crypto exposure before year-end. His shorthand for potential scale was simple: “all of crypto remains smaller than Nvidia.”
That is important because it makes regulatory catalyst less binary than one congressional vote. Sept. 15 can accelerate or disappoint market expectations, but broader institutional-opening story could survive even if legislation is delayed.
Why Kendrick Still Sees $500,000
Kendrick’s longer-term target remains far more ambitious. Standard Chartered continues to see Bitcoin reaching $500,000 by end-2030, a timetable previously pushed back from 2028.
His framework is essentially a Bitcoin-versus-Gold allocation argument. Gold’s strength has left Bitcoin structurally underrepresented in a two-asset portfolio, in his view. If Bitcoin volatility continues to decline while regulation makes institutional ownership easier, increasing allocations from traditional investors could narrow that gap over time.
Kendrick also sees current recovery through Bitcoin’s familiar four-year-cycle lens. After October’s $126,230 record high and subsequent fall to $57,737, he argues downturn has been shorter than usual and recovery is arriving somewhat earlier. That does not establish $500,000 as inevitable, but it explains why he sees latest breakout as potentially more than a short squeeze.
ActionForex's Technical View: First, Bitcoin Has to Clear 84K
On the technicals, Bitcoin's upward acceleration and strong break of 161.8% projection of 57,736 to 66,890 from 62,488 makes the rally from 5,736 low impulsive. This is building up the bullish case for reversal of the whole down trend from 126,230.
Still, for the near term, Bitcoin is facing an important resistance zone between 82,822 and 83,901 (38.2% retracement of 126,230 to 57,746. With RSI clearly overbought, the current rally could stall in the zone for consolidations, as near term traders take profit.
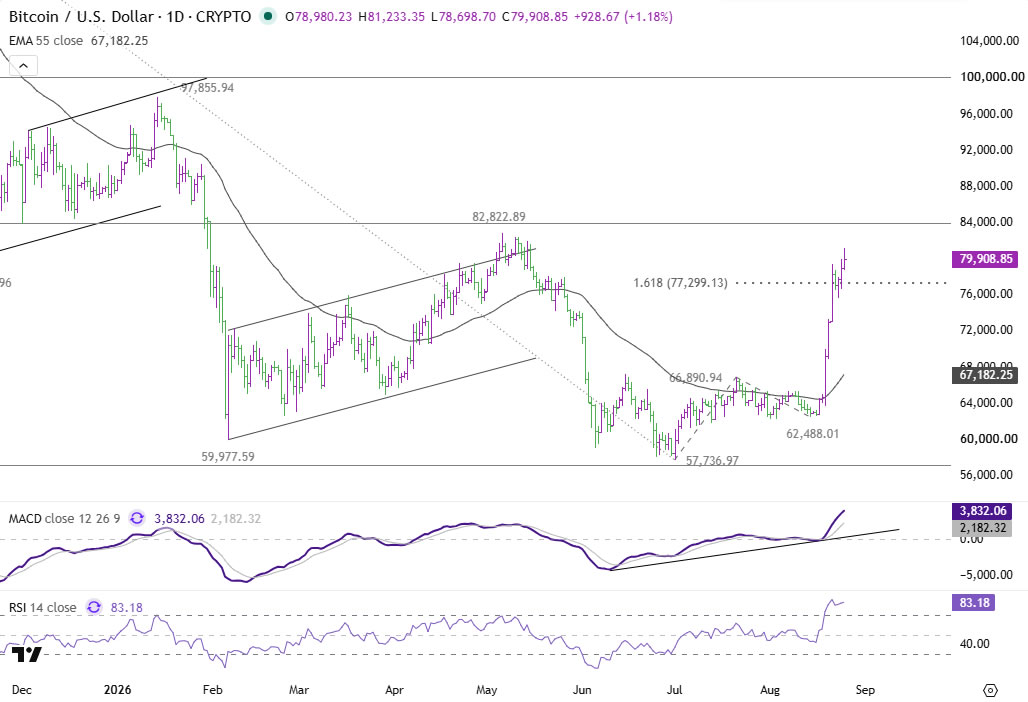
However, any pullbacks are likely to be contained by 55 D EMA (now at around 67,180). Firm break of 83,901 could set up another strong run towards 61.8% retracement which is close to key 100k psychological level.
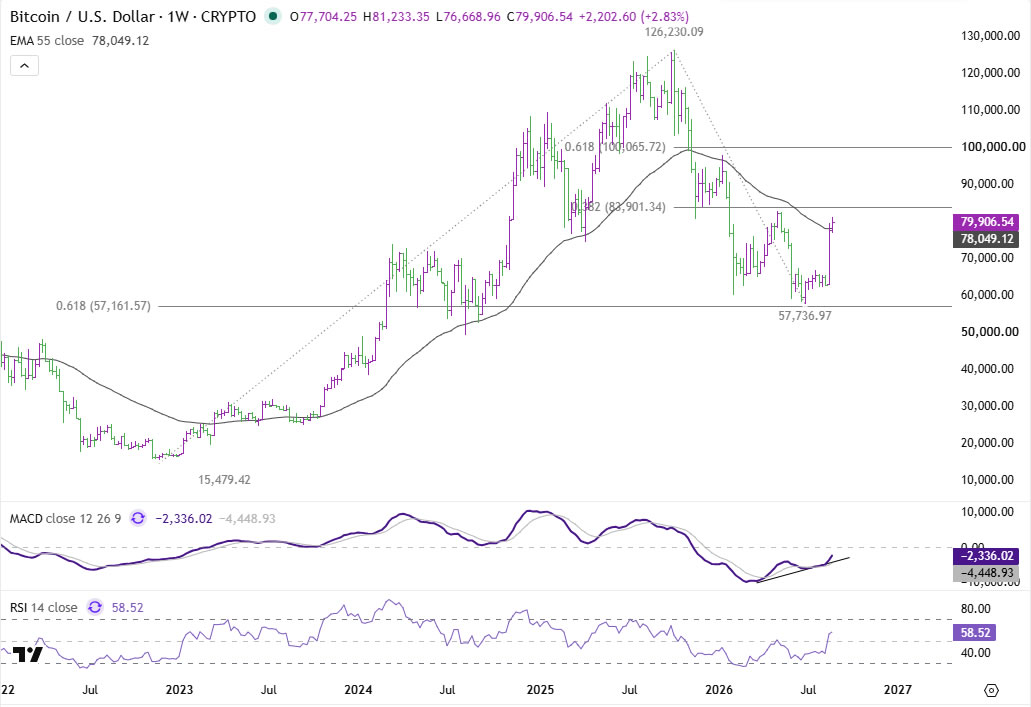
So two catalysts can plausibly keep Bitcoin moving, and Kendrick’s long-term case stretches far beyond 100,000. But with daily momentum already deeply overbought, market now has to show that this is more than a short squeeze. 83,901 is first proof point; 100,000 comes only after that.
Key Takeaways
- Bitcoin's rally above $80,000 is powered by two engines: the same fiscal-credibility trade lifting Gold, plus renewed optimism over the September 15 CLARITY Act vote.
- Roughly $4bn in short liquidations and $1.5-1.9bn in spot ETF inflows over the past week have amplified the speed of the move.
- Kendrick compares the current setup to Bitcoin's reaction to the 2023 SVB collapse, arguing institutional-credibility concerns are a "turn of the tide" regardless of the CLARITY vote's outcome.
- Standard Chartered's $500,000 by end-2030 target rests on a Bitcoin-versus-Gold allocation argument, not solely on regulatory catalysts.
- 82,822-83,901 is the key near-term resistance zone; clearing it opens a run toward the psychologically important 100,000 level, with 67,180 as support on pullbacks.
Germany Ifo Business Climate Jumps as Recovery Broadens Across Sectors
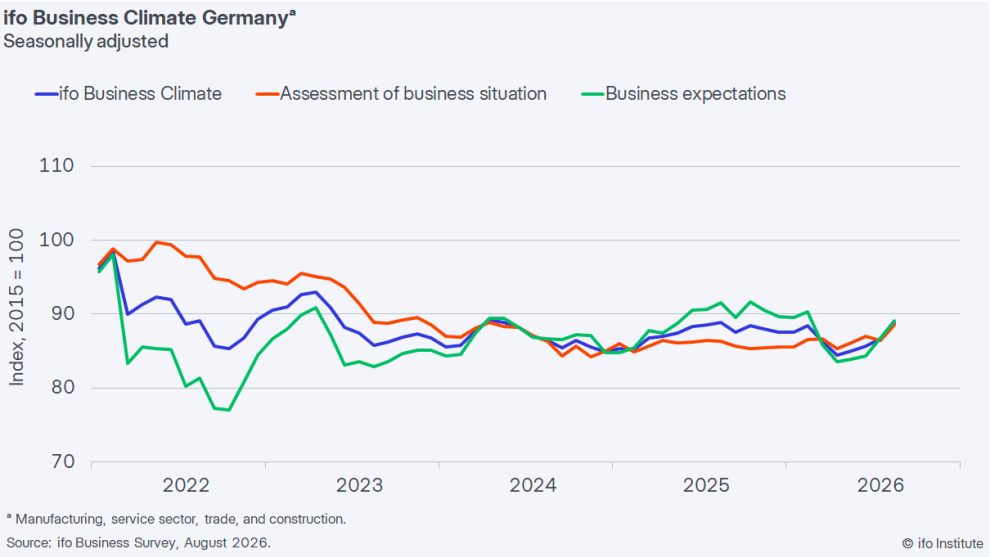
Germany’s Ifo Business Climate Index rose from 86.7 to 88.8 in August, extending a sharp recovery in corporate sentiment. Current Situation improved from 86.5 to 88.5, while Expectations climbed from 86.8 to 89.1. Ifo said companies were more satisfied with current conditions, significantly upgraded their outlook and reported declining uncertainty despite another increase in energy prices.
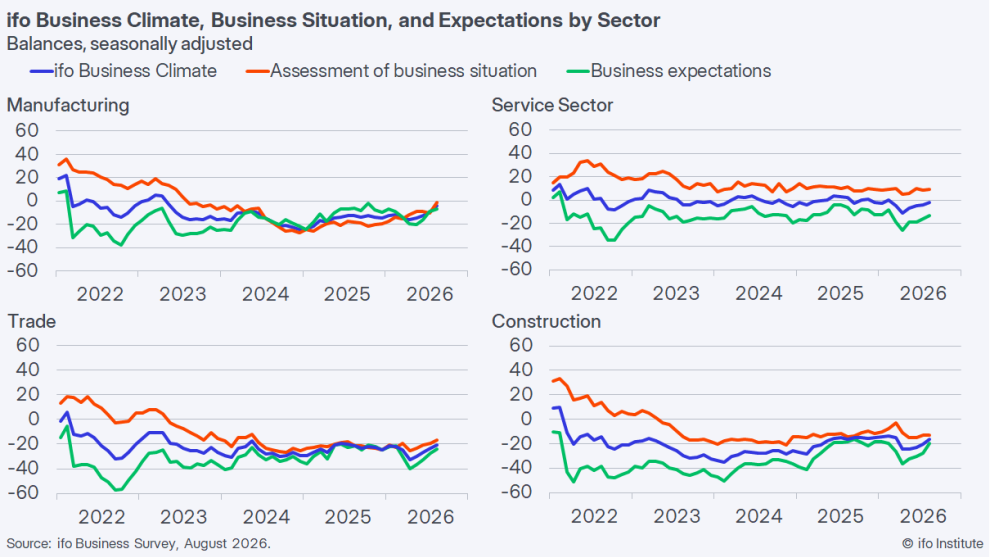
Sector data showed improvement was broad-based. Manufacturing recorded the strongest rebound, with its balance rising from -9.6 to -4.2, as firms reported better current conditions and expected production to increase over next three months, although order books remained weak. Services improved from -4.4 to -2.1, trade from -23.4 to -20.5, and construction from -20.5 to -16.5. In construction, improvement came from less pessimistic expectations even as current conditions softened slightly.
August survey therefore points to a more convincing broadening of Germany’s recovery in business confidence. Manufacturing is providing strongest momentum, while services, trade and construction are all moving in same direction. Weak orders and persistent pressure in areas such as transport and logistics still argue against calling recovery complete, but combination of stronger current assessments, improving expectations and falling uncertainty supports Ifo’s conclusion that German economy is recovering.
Data Summary
| Metric | Aug 2026 | Jul 2026 | Change |
|---|---|---|---|
| Ifo Business Climate | 88.8 | 86.7 | +2.1 |
| Ifo Current Situation | 88.5 | 86.5 | +2.0 |
| Ifo Expectations | 89.1 | 86.8 | +2.3 |
| Germany sector balance | -5.9 | -10.5 | +4.6 |
| Manufacturing | -4.2 | -9.6 | +5.4 |
| Services | -2.1 | -4.4 | +2.3 |
| Trade | -20.5 | -23.4 | +2.9 |
| Construction | -16.5 | -20.5 | +4.0 |
Headline indicators are index readings; sector figures are seasonally adjusted balances.
Key Takeaways
- Germany’s Ifo Business Climate rose from 86.7 to 88.8 in August, with improvement in both current conditions and expectations.
- Current Situation increased from 86.5 to 88.5, while Expectations rose from 86.8 to 89.1, showing recovery was not driven solely by optimism about future.
- Improvement was broad across all major sectors, with manufacturing leading as its balance jumped from -9.6 to -4.2.
- Services improved from -4.4 to -2.1, trade from -23.4 to -20.5, and construction from -20.5 to -16.5.
- Ifo said uncertainty continued to decline and German economy was recovering despite another rise in energy prices.
- Weak manufacturing orders, difficult conditions in transportation and logistics, and softer current conditions in construction still temper recovery signal.
Jackson Hole Symposium 2026: What Traders Need to Know
What Is the Jackson Hole Symposium?
Every August, some of the world’s most important central bankers, economists and policymakers meet in Jackson Hole, Wyoming, for the Jackson Hole Economic Policy Symposium. Organized by the Federal Reserve Bank of Kansas City, it has become one of the most closely watched events on the financial calendar.
This year’s symposium will take place from August 27–29, 2026, with the theme “Financial Innovation: Implications for Payments and Policy.” No interest rate decisions are made at Jackson Hole, but speeches from Federal Reserve officials can give traders important clues about future policy. As a result, the event can create large moves in the U.S. dollar, stock markets, bond yields and gold.
Why Is Jackson Hole Different in 2026?
The biggest change this year is Kevin Warsh, who replaced Jerome Powell as Federal Reserve Chair earlier in 2026. This will be his first Jackson Hole meeting as Fed Chair, so traders will be watching closely to learn more about his approach to monetary policy.
So far, Warsh has given fewer clear signals about future interest rate decisions than Powell did. This makes his speech more difficult to predict and potentially more important for markets. Traders will be looking for clues about whether he is still concerned about inflation or thinks interest rates are already high enough to bring inflation back toward the Fed’s 2% target.
Inflation Is Back in Focus
Inflation remains one of the Fed’s biggest concerns. Higher energy prices and other price pressures have made the return to the 2% inflation target more difficult, while long-term U.S. government bond yields have also risen.
Warsh has made clear that the 2% target remains important, so traders will want to know how the Fed could respond if inflation stays high. Any suggestion that interest rates need to remain high for longer, or could rise again, could have a major impact on markets.
Will Warsh Give Traders Clear Guidance?
One of the main questions for traders is how much guidance Warsh will give in his first Jackson Hole speech as Fed Chair on Friday, August 28 at 10:00 a.m. New York time (11:00 p.m. Japan time). He may focus more on longer-term issues such as productivity, demographics and an aging population, rather than talking only about the next interest rate decision. This would also fit with this year’s theme of financial innovation and its impact on payments and policy.
Previous Fed Chairs often used major speeches to give markets clues about future policy. Warsh appears less willing to do this and prefers to let economic data guide expectations. Traders will still watch closely for any comments about inflation and interest rates. If he gives few clear signals, markets could become more volatile as traders try to predict what the Fed will do next.
What Should Traders Listen For?
There are three main areas to watch during Warsh’s speech:
- Inflation: Is he still worried about high inflation, or does he think it is moving back toward 2%?
- Interest rates: Does he think rates need to stay high or rise further?
- Fed communication: Will he give clear clues about what the Fed may do next?
Markets currently expect the Fed to remain careful about changing interest rates. Inflation is still a concern, so traders will be watching closely for any change in Warsh’s view. The biggest market moves could come if Warsh says something unexpected. A stronger focus on inflation could support the U.S. dollar, while more concern about economic growth could weaken it.
Potential Impact on USD/JPY
USD/JPY could be one of the most sensitive markets to Warsh’s speech because the pair reacts strongly to changes in U.S. interest rate expectations. If Warsh focuses on inflation and suggests rates may need to stay high or rise, U.S. bond yields could increase and support the dollar, pushing USD/JPY higher. If he sounds more comfortable with the inflation outlook, U.S. yields could fall and the dollar could weaken, pushing USD/JPY lower.
Potential Impact on the Dow Jones
The Dow Jones is likely to react to any changes in interest rate expectations. If Warsh says interest rates need to stay high or rise further, U.S. stocks could fall because higher rates can slow the economy and make borrowing more expensive. However, if Warsh suggests that the Fed does not need to raise rates further, bond yields could fall and the Dow Jones could move higher.
Potential Impact on Gold
Gold could also see large moves around Jackson Hole because it is sensitive to both the U.S. dollar and bond yields. A hawkish Warsh could push yields and the dollar higher, which would normally be negative for gold. A more dovish message could have the opposite effect, with lower yields and a weaker dollar supporting higher gold prices.
Trading Jackson Hole 2026
Jackson Hole can create large market moves, but there is no pressure to trade immediately after Warsh’s speech. The first move can sometimes be an overreaction and quickly reverse as traders take more time to understand his comments. Traders can look for opportunities from the volatility around the speech, especially if prices move too far too quickly. Another option is to wait longer and see if a new trend develops, particularly if Warsh says something that surprises the market.
The most important thing is to be prepared. Know when the speech is taking place, keep risk under control and have a plan for different market reactions. You do not need to predict exactly what Warsh will say to find good trading opportunities.
Make Every Summer Trade Count
Titan FX’s Summer Giveaway 2026 gives traders the chance to win over $60,000 in Titan Points through weekly prize draws and a Grand Prize Draw.
To earn the first ticket, clients simply need to register, make a net deposit of at least 100 USD and trade 100,000 USD in value. Additional deposits and trading can earn more tickets, while active clients may also qualify for the Perfect Attendance Reward.
The campaign runs from 20 July to 30 August 2026. A total of 301 winners will be selected, including weekly prizes of up to 200,000 Titan Points and a Grand Prize of 5,000,000 Titan Points.
WTI Analysis: Attempted Uptrend Breakout Without Momentum Confirmation
WTI crude fell more than 2% on Monday, 24 August, as market participants took profits amid expectations that the US could announce a new round of sanctions against Iran. Additional pressure came from a warning by the Iranian authority responsible for the Persian Gulf and Strait of Hormuz, which said vessels violating transit rules could face fines or detention.
At the same time, the US Energy Information Administration (EIA), in its 11 August forecast, expects the average Brent price to remain around $85 per barrel in the third quarter. Persistently low commercial crude inventories in the US could also help limit the downside and prevent a deeper decline.
Technical Analysis of WTI
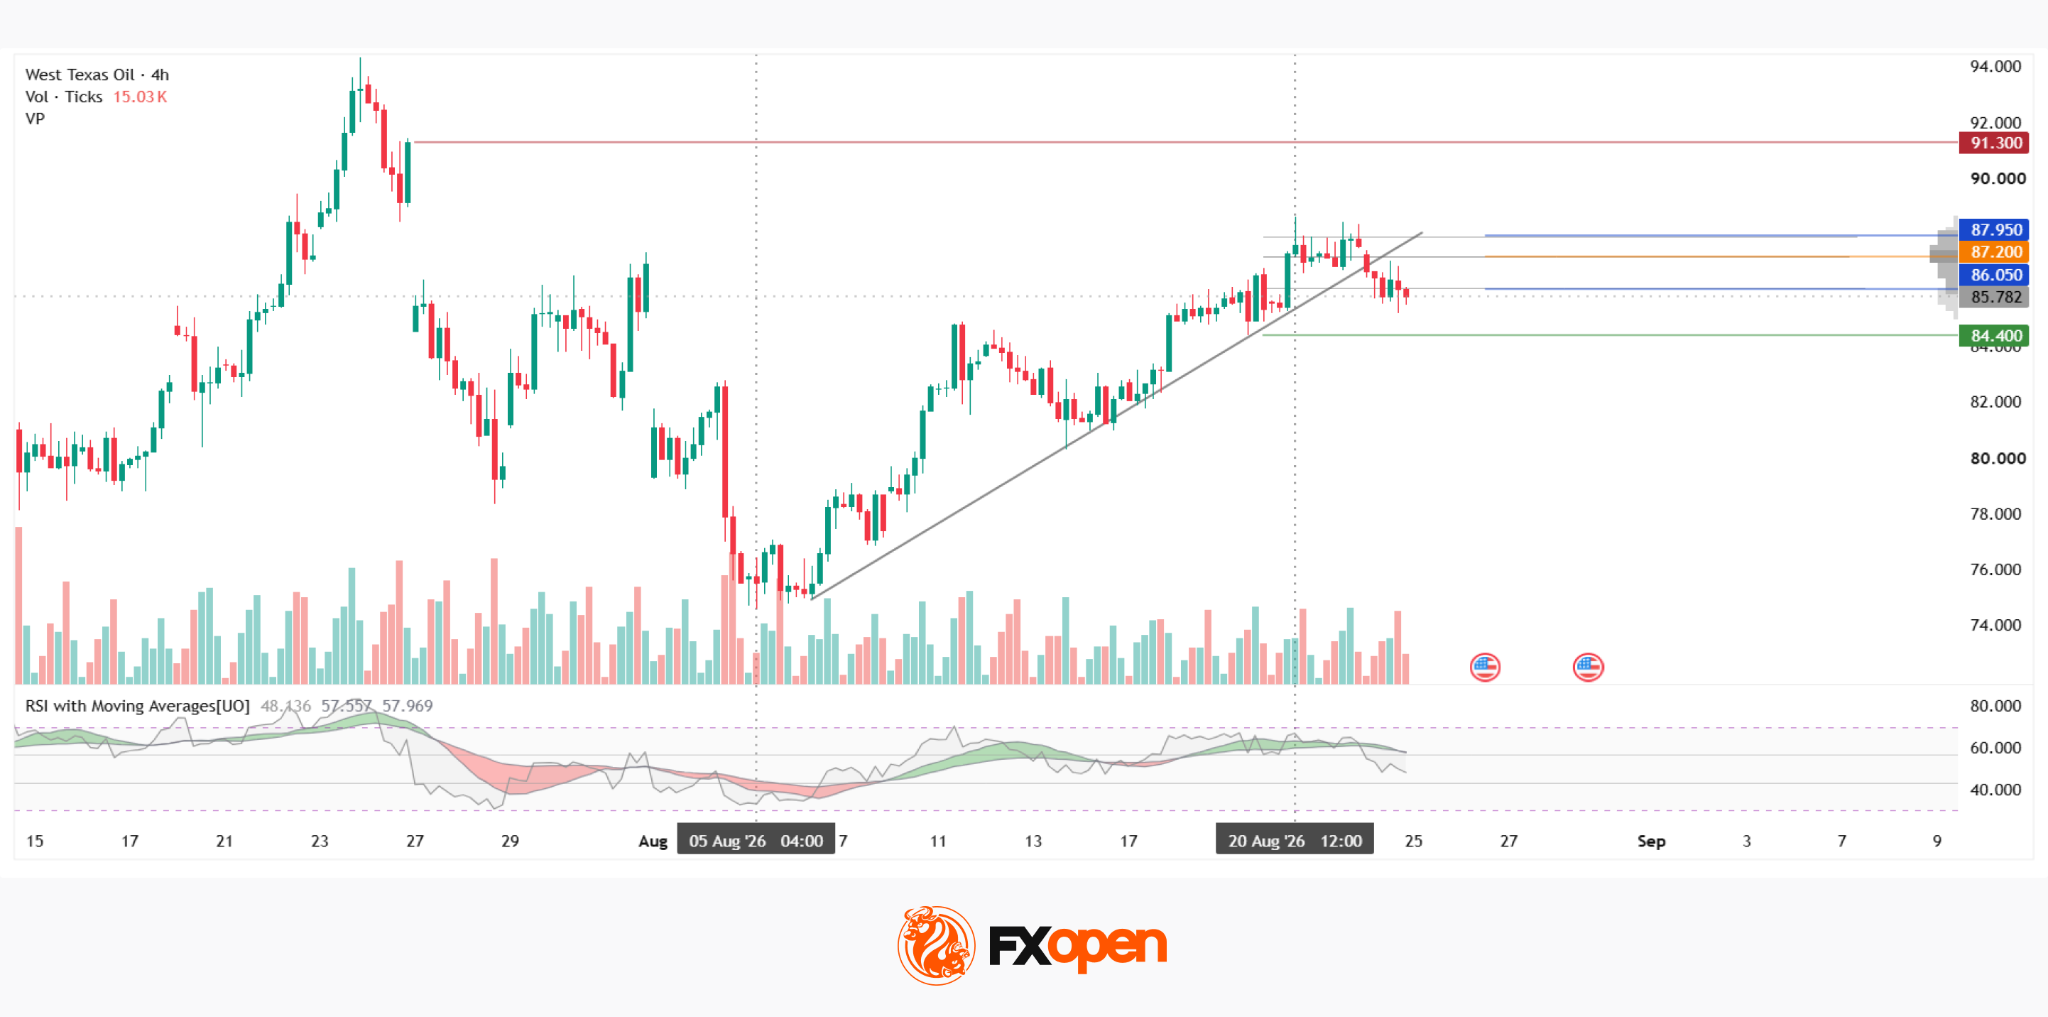
On the four-hour XTI/USD chart, prices had been moving within a short-term uptrend since the beginning of August. The trendline repeatedly acted as support during previous pullbacks, but the price is now attempting to break below it while also moving beneath the lower boundary of the current market profile at $86.05.
If the downside move gains traction, the next potential support area is around $84.40.
A false breakout followed by a renewed advance would bring several technical levels into focus. The first is the Point of Control (POC) at $87.20, followed by the upper profile boundary at $87.95. The overall depth of the market profile is also worth monitoring: the narrower the profile, the less buying pressure may be required to overcome it.
Above the main concentration of trading activity lies the red resistance zone at $91.30.
The RSI + MAs indicator currently shows readings of 48, 57 and 57. RSI has returned to the neutral area following the pullback, but notably remained below the overbought zone throughout virtually the entire uptrend. At the same time, both moving averages remain positive and are holding above the neutral threshold.
Key Takeaways
The break below the ascending trendline has yet to receive confirmation from the momentum indicators. The moving averages remaining above the neutral zone cast some doubt on the sustainability of the current decline.
The next move could depend heavily on the scale and severity of any new US sanctions against Iran. A stronger-than-expected sanctions package could increase pressure on oil prices, while more limited measures may allow the market to refocus on tight US inventories and provide support for WTI.
Start trading commodity CFDs with tight spreads (additional fees may apply). Open your trading account now or learn more about trading commodity CFDs with FXOpen.
This article represents the opinion of the Companies operating under the FXOpen brand only. It is not to be construed as an offer, solicitation, or recommendation with respect to products and services provided by the Companies operating under the FXOpen brand, nor is it to be considered financial advice.
Sunrise Market Commentary
Markets
- US Treasury Secretary Bessent stopped short of announcing so-called secondary sanctions against Iran's trading partners and its financial institutions in particular in yesterday's closely watched presser. He issued a final warning instead. He did unveil more sanctions on other entities, individuals and vessels but falls way short of what was dubbed "economic D-Day" beforehand. It shows the tightrope the US administration is walking since cutting of Iran's remaining financial lifelines once and for all would mean going after Chinese companies. That would risk retaliation and more global economic upheaval. It's also tricky from a diplomatic point of view with next month's summit (September 24) in mind that, amongst others, aims to suspend a trade pact that's set to expire November 10. Meanwhile, people familiar said the US is exploring a 7.5% tariff on Chinese goods over allegations of excess industrial capacity. That would restore total levies to around 20%, a level China said is consistent with the truce.
- Staying with the US Treasury, officials as quoted by CNBC yesterday floated the idea to fund the increased-in-size bond buybacks by tapping the General Account. That's a nearly $t10 war chest that usually serves as a financial buffer (e.g. when tax revenues unexpectedly drop). That offered the long end of the curve some small relief with net daily changes up to -4.8 bps. We doubt there's much more to come other than this kneejerk move but for now it may have removed the sting out of the long end going into this week's key event(s), including tomorrow's PCE deflators and Friday's Fed Warsh appearance. The (US) economic calendar is a moderately interesting one but neither the weekly ADP job gains nor the August Conference Board consumer confidence indicator is likely to move a needle. The US does tap the bond market with a $69bln 2-yr auction. German yields varied between +2.3 bps (2-yr) to -1.2 bps (30-yr). Bear flattening came on the heels of gas prices shooting ever higher, nearing €70/MWh. Euro area money markets keep betting on at least two more hikes (to 2.75%), currently by February next year. Oil prices eased a tad to $92+ levels. A fragile risk sentiment favoured the US dollar slightly over G10 peers. EUR/USD grinded lower towards 1.1660. DXY was able to secure 99 again and trades with a slight edge this morning too. Crypto meanwhile continues its recent ascent. Bitcoin closes in on the May 2026 correction high.
News & Views
- Minutes of the previous Reserve Bank of Australia policy meeting point out that policy is already restrictive and helping to slow the economy. Inflation has eased somewhat, but underlying inflation remains too high at 3.6% and is expected to return to target only by late 2027. Economic growth is slowing, housing activity is weakening, and the labour market is gradually cooling. However, demand remains strong enough that inflation risks have not disappeared. The RBA sees more upside than downside risks to inflation, mainly from higher energy prices linked to the Middle East conflict, strong AI and data-centre investment boosting demand and continued weak productivity growth. Although the RBA decided not to raise rates in August (option was considered), it made clear that further rate hikes remain possible if inflation proves more persistent than expected. Australian money markets currently attach a 70% probability to a final rate hike in Q1 2027.
- Czech parliament will today start debating a broader amendment to the country's budgetary framework. Overall, it would make fiscal policy more flexible and allow for a bigger deficit. Czech president Pavel earlier vetoed the bill, but PM Babis has the numbers in parliament to overrule it. The bill would amongst others exclude certain defense expenditures above 2% of GDP from spending limits, allow the government to exceed approved expenditure ceilings for defense spending through 2036, allow for additional spending on strategic infrastructure projects outside the normal expenditure framework, permit the government to increase spending by up to 10% in certain security-related situations and expand to government's ability to make certain budget reallocations without prior approval from the budget committee.
Riksbank Minutes to Shed Light on Board Divisions
In focus today
In Sweden, the focus is on the Riksbank minutes from last week's meeting, released at 9.30 CET today. As this was a smaller meeting with no new projections and only a brief monetary policy update, the minutes will be important for understanding whether the relatively dovish communication was unanimously supported. The key questions as we see them are: 1) How close to a rate hike are Governor Thedéen and Seim, who have been the more hawkish members lately? 2) For the remaining three members, who form a majority (Jansson, Bunge and Hjelm), the question is whether any of them have moved any closer to Thedéen and Seim's camp.
In the US, the Conference Board will release consumer confidence for August. The index showed 90.8 in July and has gradually trended down over the last years. Fed's Barkin (non-voting member) will speak in the afternoon.
In the euro area, focus turns to the German Ifo indicator for August. The assessment of the current situation remains low, but expectations have risen lately and we expect a rebound in both components following the solid PMI report we received last week.
In Denmark, retail sales will be released for July. Our Spending Monitor showed a 0.3% m/m increase in real retail spending in July marking the third consecutive month with real increase in the retail spending. Over the past year the real retail spending has risen by 3.2%. We expect the figures from Statistics Denmark to reflect the same trend, with a modest increase in July.
Central Bank of Hungary will release its rate decision. We expect the central bank to cut rates by 25 bps to 5.50%.
Economic and market news
What happened overnight
In geopolitics, the US "economic D-Day" against Iran proved to be a limited market mover, as Treasury Secretary Scott Bessent mainly issued a broad warning of secondary sanctions against entities still doing business with Iran, without providing concrete details on timing, monitoring or the scope of enforcement. While the US aim is to further isolate Iran and "sever every economic lifeline", the lack of specifics made the announcement feel more like a warning shot than a decisive escalation, leaving the immediate macro and market impact muted. Iran promised to retaliate against expanded US economic sanctions that the Americans said would cut off Iran's economic lifeline, with Tehran expressing confidence that major trading partners like China would resist Washington's pressure campaign.
What happened yesterday
In US-Canada relations, US-Canada trade tensions have re-escalated after Trump announced plans to raise tariffs on Canadian cars and automotive parts to 50% from 1 January, following the collapse of negotiations. The dispute raises risks for the highly integrated North American auto supply chain and could weigh on investment. Trump wrote on his social media platform, that Canada no longer will be treated as a State.
Equities: Equities traded back and forth in a relatively quiet session, while implied volatility edged marginally higher. With little macro data to provide direction, the market remains caught between three dominant themes: oil and Iran, AI anxiety and the dollar debasement trade.
Yesterday, AI jitters were allowed to set the tone. Even with limited movement at the index level, Consumer Staples outperformed Technology by roughly 3 percentage points. This was not driven by positive consumer news. Instead, it tells us something important about the current stage of both the economic and investment cycles. Growth remains strong, but positioning is correspondingly opportunistic, with investors deeply underweight Staples. In the absence of competing macro catalysts, relatively little is therefore required to trigger substantial sector rotations. We are not necessarily arguing that yesterday's move will persist, but the underlying market dynamics deserve attention.
We have recently seen an unusually high number of sessions in which cyclicals and defensives move in opposite absolute directions. On weaker equity days, defensives can rise even as the broader market falls, while on stronger days cyclicals lead and defensives frequently decline outright. This is not a conventional full risk-on or risk-off market. Investors are primarily rotating risk within equities rather than removing it altogether.
Asian equities are marginally lower this morning, which makes sense given the region's exposure to yesterday's Economic D Day announcements.
US and European futures are mixed, although the more tech heavy parts of the market are showing a modest positive bias.
FI and FX: US Treasuries bull-flattened yesterday, with the long end leading gains. The new sanctions campaign against Iran, announced yesterday, adds a new layer of geopolitical complexity to markets. Spot gas prices have now risen above the ECB's adverse scenario, adding to the monetary policy uncertainty. EUR/USD has started the week edging marginally lower, now at 1.1650, whereas in Scandies we saw NOK/SEK break above 1.02 for the first time in almost three years.
Elliott Wave Forecast: Crude Oil (CL) AIms Higher, $100.6 in Sight
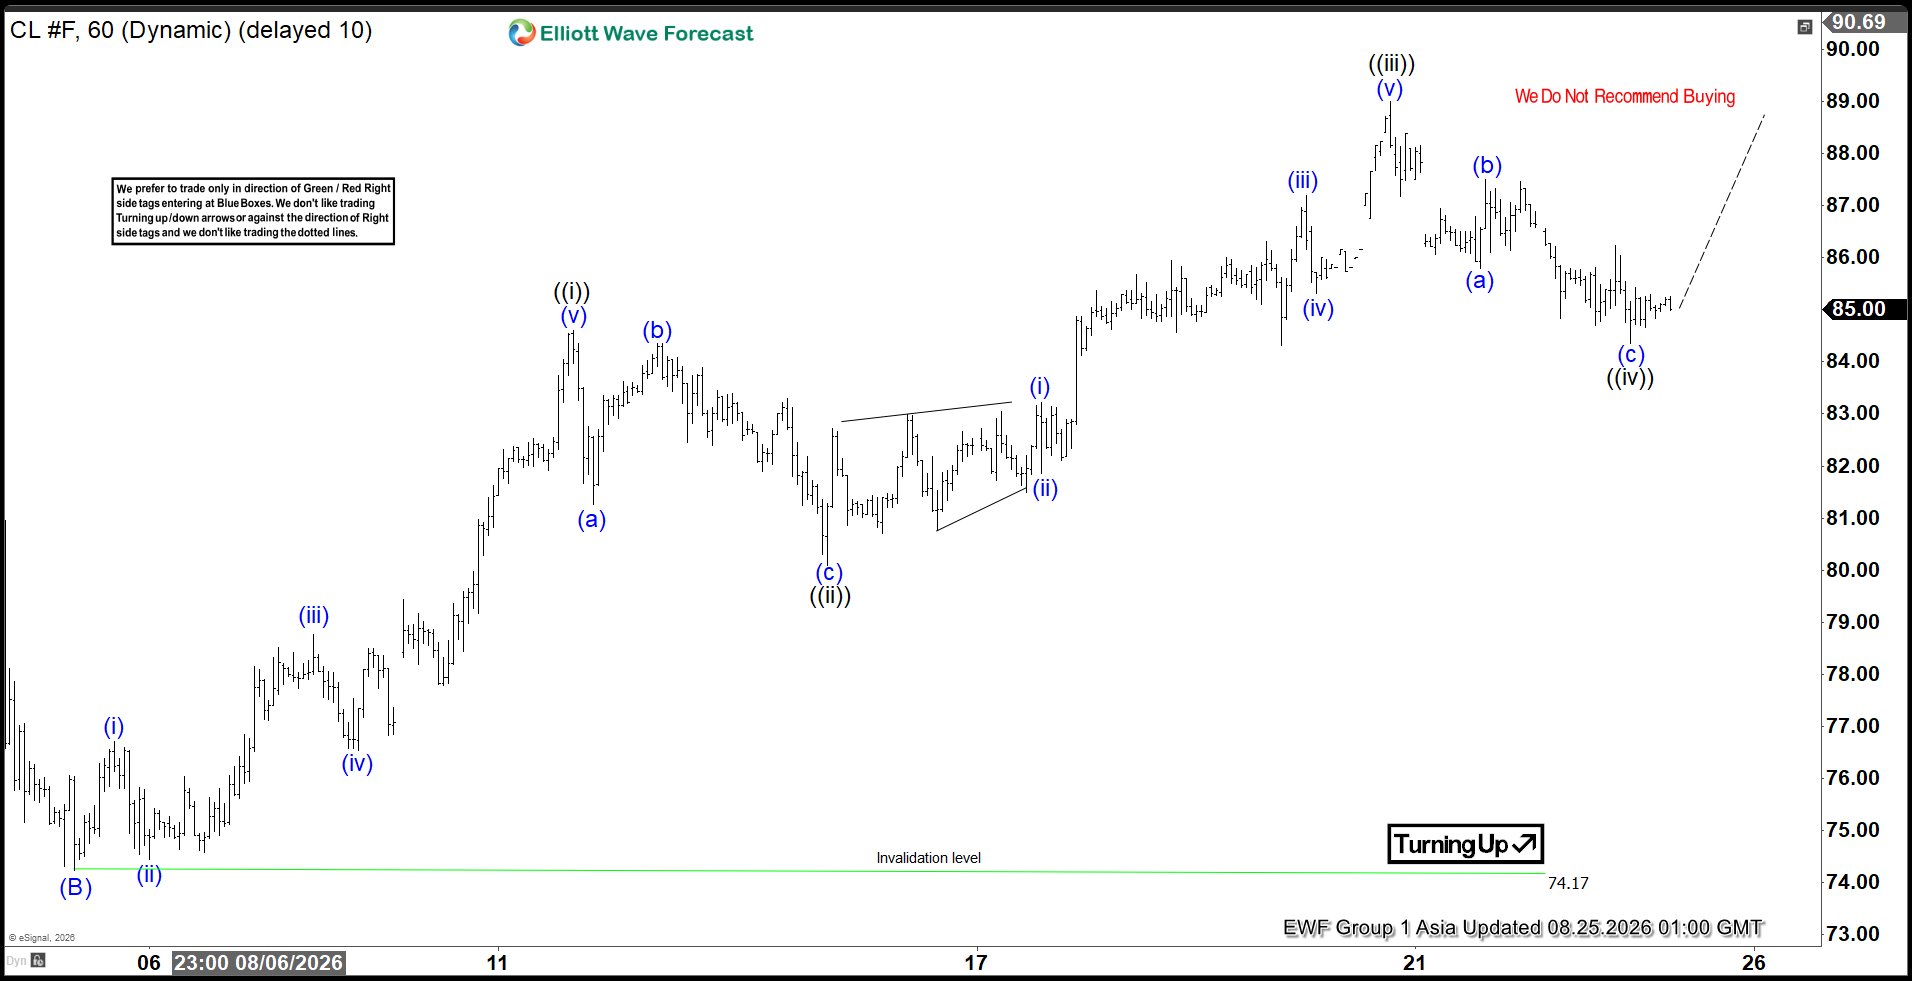
The short‑term Elliott Wave view in Oil (CL) continues to suggest a constructive bias, supported by the impulsive rally from the July 2, 2026 low. That advance unfolded in five waves and concluded wave (A) at $93.50. Following this peak, the market experienced a three‑wave corrective decline, which terminated at $74.17 as reflected in the one‑hour chart. The sequence of a five‑wave rally followed by a three‑wave pullback establishes a bullish structure against the July 2 pivot, reinforcing the expectation of further upside potential.
From the completion of wave (B), Oil has resumed higher in wave (C), which is unfolding with impulsive characteristics. Within this progression, wave ((i)) ended at $84.61, while the subsequent pullback in wave ((ii)) found support at $80.09. The instrument then advanced in wave ((iii)), reaching $89, before a corrective dip in wave ((iv)) concluded at $84.36. This internal subdivision highlights the orderly nature of the advance, consistent with Elliott Wave principles. The market remains positioned for continuation, provided that the key pivot at $74.17 holds firm.
Near term, the structure favors additional strength. As long as the July 2 low remains intact, pullbacks are expected to find support in either three or seven swings, offering opportunities for buyers to re‑engage. This technical framework underscores the bullish potential, with Oil poised for further extension once corrective phases are absorbed.
Oil (CL) 60 Minute Elliott Wave Chart
CL Elliott Wave Video
https://www.youtube.com/watch?v=ZgVq1ZumX2k
AUD/USD Stalls at Resistance as RBA Minutes Leave Real Test to Tomorrow’s CPI
TL;DR: AUD/USD barely moved on RBA minutes that confirmed, but didn't change, the existing hawkish-hold debate — the real signal was the Board's openness to pre-emptive tightening based on monthly data alone, which keeps a September hike live even without the Q3 quarterly CPI, making Wednesday's July print the more consequential test.
Minutes Confirm Debate, but Give Aussie Little New to Trade
AUD/USD barely moved after minutes of RBA’s Aug. 10–11 meeting, slipping only modestly from recent 0.71790 high. Muted reaction made sense. Minutes confirmed what markets already understood from August’s hawkish hold: Board genuinely considered a 25bp hike, but ultimately judged policy at 4.35% “appeared sufficiently restrictive” and that there was still time to gather more evidence. Governor Michele Bullock has already said further tightening is “quite possible,” while Deputy Governor Andrew Hauser struck a somewhat more assertive tone last week. Minutes added detail to that debate without materially changing it.
More important was language around acting before inflation risks are fully confirmed. Members explicitly discussed whether it “may be appropriate to mitigate those risks somewhat by tightening monetary policy pre-emptively,” while several judged it “quite possible” that upside risks would crystallise and require further tightening. That leaves RBA with two live arguments: current policy may already be restrictive enough, but waiting becomes harder to justify if incoming inflation data suggest upside risks are beginning to materialise.
Wednesday’s CPI Is Where Repricing Risk Begins
That makes Wednesday’s July CPI much more consequential than Tuesday’s minutes. It is the only monthly inflation report RBA will receive before Sept. 28–29 meeting, with August CPI not due until Sept. 30. Board itself specifically highlighted incoming monthly inflation and labour-market reports as important inputs before its next decision. There will therefore be no second inflation print available to confirm—or offset—whatever signal July data deliver.
That reference to monthly inflation data is important in its own right. Combined with Board’s willingness to consider pre-emptive tightening, it implicitly suggests policymakers do not necessarily need to wait for full Q3 quarterly CPI before acting. If monthly data show inflation risks strengthening, September meeting can remain live even though complete quarterly inflation picture will not yet be available. In other words, RBA has left itself room to respond to emerging evidence rather than requiring confirmation from traditional quarterly CPI cycle.
Labor side already points in a softer direction. July employment fell 15.8K, while unemployment rose from 4.4% to 4.5%. Another labour report is due only days before September meeting, giving Board a fresh employment read. Inflation calendar is less forgiving. A hot CPI would not guarantee a September hike, but it would raise cost of waiting and strengthen case for acting before Q3 CPI is available. A softer reading would reinforce argument that 4.35% is already doing enough and give policymakers more reason to use time rather than another rate increase.
ActionForex's Technical View on AUD/USD: Hot CPI Could Put 0.72770 Back in Sight
AUD/USD technical setup reflects that policy tension. Recovery from 0.68640 remains constructive, with a higher low at 0.69210 followed by a break above 0.70260 and an advance to 0.71790. Pair is now consolidating just below nearby 161.8% projection of 0.6864 to 0.7026 from 0.6921 at 0.7183, while daily momentum remains positive.
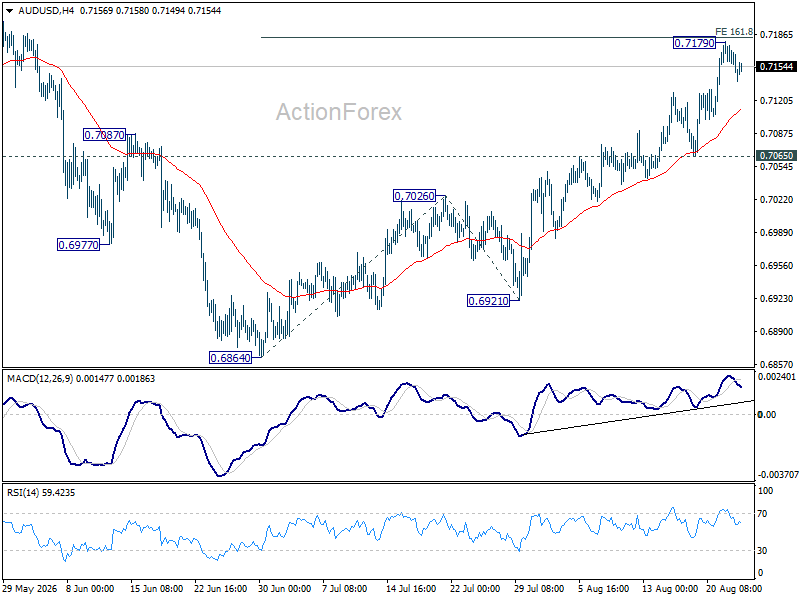
A hotter-than-expected CPI would strengthen case for another RBA hike and, crucially, keep September tightening firmly in play without waiting for Q3 CPI. That could drive AUD/USD through 0.71790 toward 0.72770 cycle high. But a sustained break of 0.72770 would probably require cooperation from Dollar side as well. DXY has spent the past two sessions consolidating rather than extending its broader decline, so cleanest bullish combination would be sticky Australian inflation alongside renewed USD weakness.
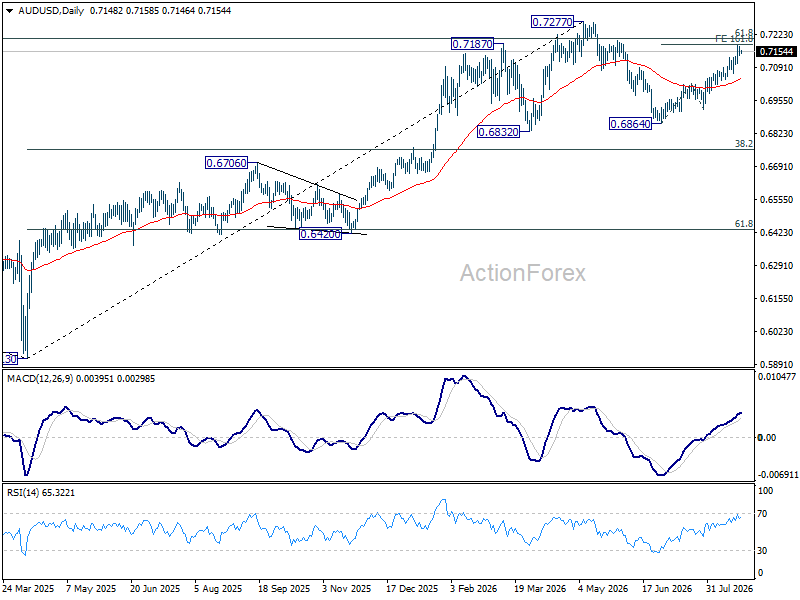
By contrast, an in-line or softer CPI could trigger a deeper pullback toward 0.70650. As long as that support holds, broader recovery from 0.68640 would remain intact and weakness would look more like consolidation than trend reversal. Minutes told markets RBA can afford to wait, but they also suggested it does not have to wait for quarterly CPI if monthly evidence becomes convincing. Wednesday’s CPI will show whether September stays merely possible—or becomes a much more immediate policy risk.
Key Takeaways
- RBA minutes confirmed the Board seriously considered a hike but judged 4.35% sufficiently restrictive for now, adding detail to the existing debate without shifting it.
- The Board explicitly discussed pre-emptive tightening, meaning it may act on monthly CPI data alone without waiting for the full Q3 quarterly print.
- Wednesday's July CPI is the only monthly inflation read before the September 28-29 meeting, making it more consequential for policy than the minutes themselves.
- Weaker labor data (July employment -15.8K, unemployment up to 4.5%) already points dovish, leaving the inflation print as the clearer swing factor for September.
- AUD/USD holds a positive bias above 0.7183 resistance toward 0.7277, but a sustained break likely needs both a hot CPI and renewed Dollar weakness; a soft print risks a pullback toward 0.7065.