Sample Category Title
Crude Oil: Oil Reverses Its Gains In The Asian Session
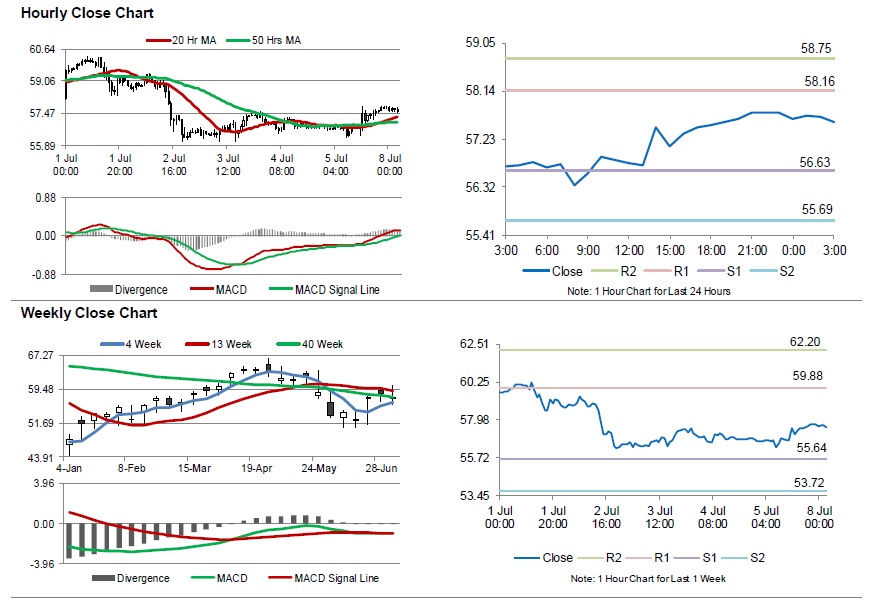
For the 24 hours to 23:00 GMT, Crude Oil rose 1.27% against the USD and closed at USD57.61 per barrel on Friday, amid escalating tensions in the Middle East.
In the Asian session, at GMT0300, the pair is trading at 57.56, with oil trading 0.09% lower against the USD from Friday’s close.
The pair is expected to find support at 56.63, and a fall through could take it to the next support level of 55.69. The pair is expected to find its first resistance at 58.16, and a rise through could take it to the next resistance level of 58.75.
Crude oil is trading above its 20 Hr and 50 Hr moving averages.
BOC Preview – Not Following Fed’s Footstep
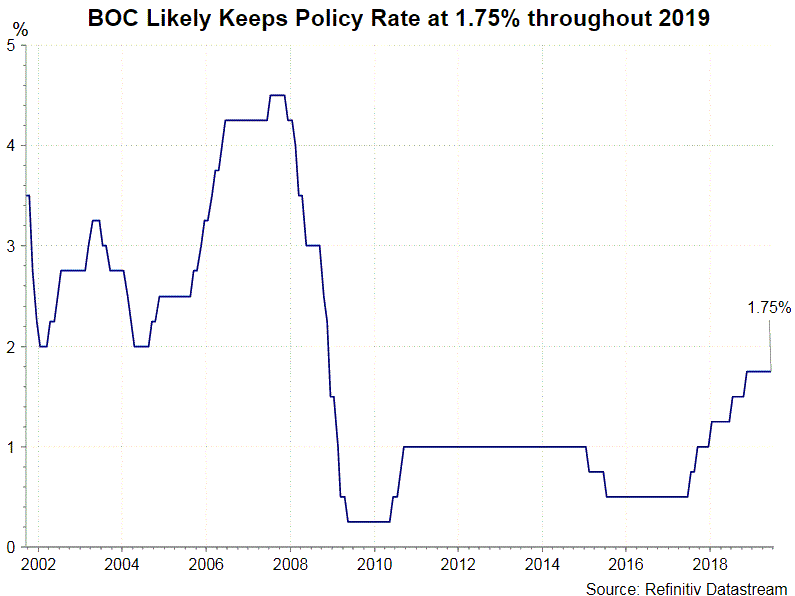
BOC is expected to leave the policy rate unchanged at 1.75% this week, and for the rest of the year. Data flow since the last meeting has remained resilient, offering the central bank more room to take a wait and see mode and assess the economic developments. We believe the policy statement would be largely similar to the previous meeting, with policymakers reiterating that the "degree of accommodation being provided by the current policy interest rate remains appropriate”, while pledging to monitor incoming data on future adjustment of the monetary policy.
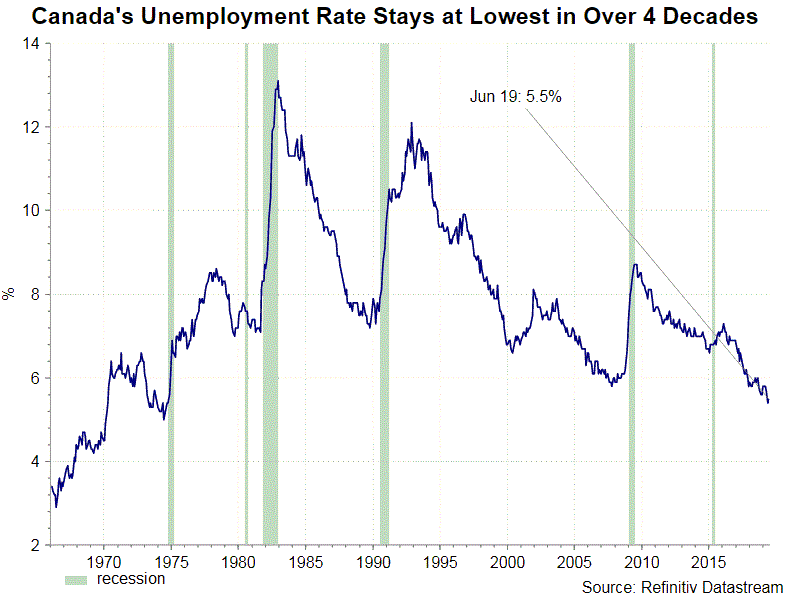
 Employment situation remained firm in June. The unemployment climbed +0.1 percentage point to 5.5%, with participation rate unchanged at 65.7%. The bigger pleasant surprise came from wage growth with the average hourly wage expanded+3.6% y/y, accelerating from +2.55% in the prior month. Over the past six months, wages are up an annualized rate of +6.5%, the fastest since 2007. The disappointment came from the number of payrolls, which dropped -2.2K, missing consensus of a +10K increase and May’s +27.7K addition. Yet, the reduction was due to part-time jobs, while full time jobs actually rose +24.1K.
Inflation has risen above BOC’s target. Headline CPI accelerated to +2.4% y/y in May from +2% in the prior month, beating consensus of +2.1%. Core CPI improved significantly to +2.1%, from April’s +1.5%. Moreover, the average for BOC’s three preferred inflation gauges came in at +2.07%, up from +1.9% in April.
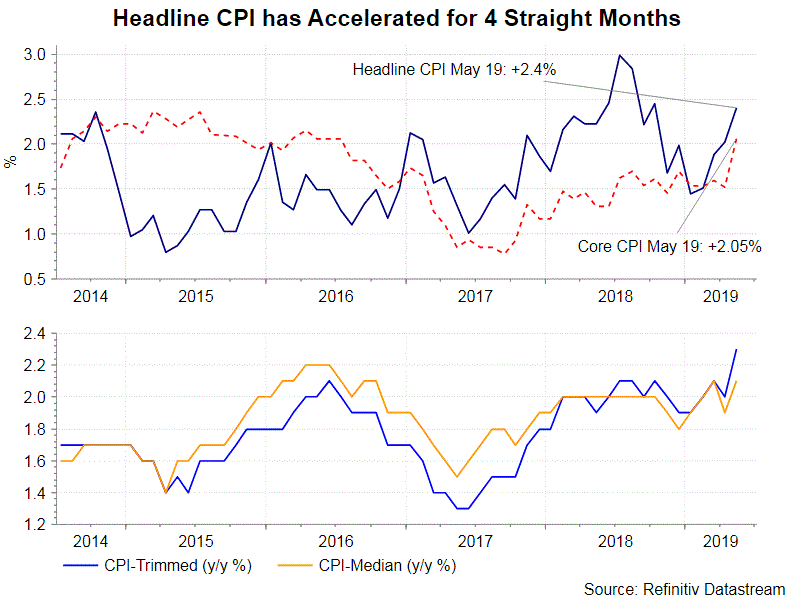 Being the major destination of Canada’s exports, the US monetary policy should have direct impact on that of Canada. Expectations that the Fed would lower interest rate later this year might lead BOC to follow suit. Yet, things could be different this time. While the spillover of the US-China trade war could still affect Canada’s economic development, the impact would be less significant, in particular the USMCA, a trilateral trade agreement among Canada, Mexico and US in replacement of NAFTA, was settled. Recent economic developments suggest that BOC would keep its powder dry throughout the year.
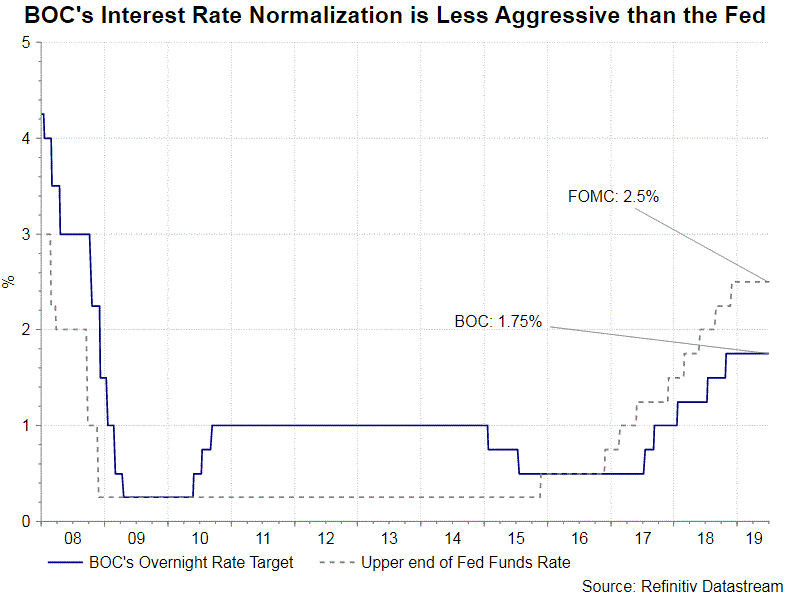
As we look back in interest rate normalization cycle after the 2007/08 global financial crisis, BOC has raised its policy rate less aggressively that the Fed. That is, more stimulus measures are in place in Canada, when compared with the US, to support economic growth. This has offered BOC more flexibility to wait and see before taking further action to adjust its policy.
Dollar Marks Time After Friday’s Surge
Dollar eases off slightly
The stronger-than-expected increase in US nonfarm payrolls for June reported last Friday saw US yields tick higher and the US dollar following suit on Friday. The greenback saw mild consolidation in Asia this morning, with the Dollar Index, the measure of the US dollar's value against six major currencies, easing off to 97.235 from Friday's 97.286 close, the highest in almost three weeks.
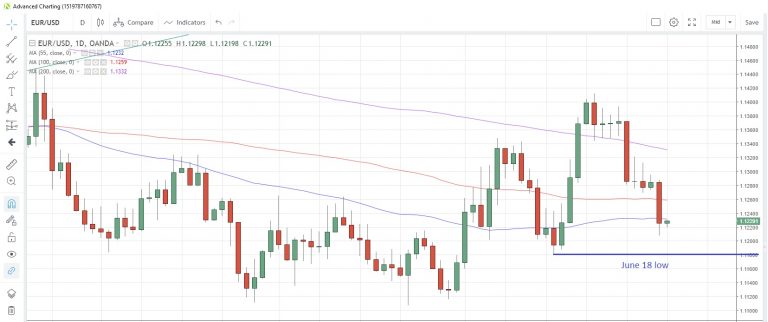
The slight dollar retracement allowed most major currencies to eke out small gains, with AUD/USD climbing 0.06% to 0.6985 while the EUR/USD was at 1.1228, unmoved by the Greek election results which saw an opposition win, which was generally viewed as market friendly. EUR/USD traded below the 55-day moving average at 1.1233 on Friday for the first time since June 19 and the next possible support level could be the June 18 low of 1.1181.
EUR/USD Daily Chart
The Turkish lira fell aggressively after it was announced that the Central Bank governor Cetinkaya had been removed from office at the weekend. No official reason was given for the dismissal and Deputy Governor Murat Uysal will take his place.
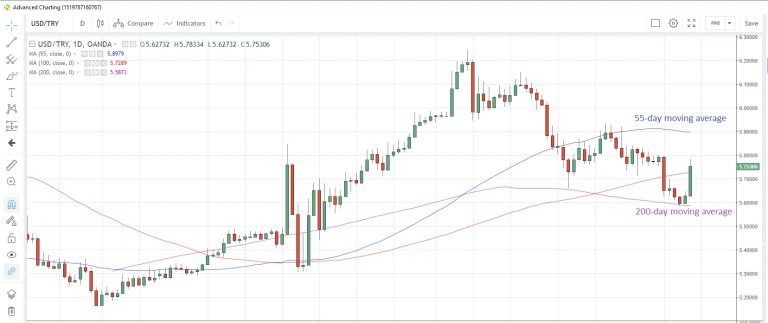
USD/TRY jumped the most since March 28 to hit 5.7835, the highest in a week, amid restrictive liquidity in the early hours at the start of the week. The 100-day moving average at 5.7289 has been breached and the 55-day moving average is at 5.8979. The 200-day moving average looks to be providing strong support at 5.5873 as it has remained intact on a closing basis since March 27.
USD/TRY Daily Chart
Equities extend slide
Equity indices continued the downward path seen on Wall Street last Friday, with US indices sliding between 0.2% and 0.29%. China shares under-performed, notching up at 1.56% decline, which extended the current bear run to a fifth day as the index touched the lowest in eight days.
A more cautious approach to sentiment may have been adopted after Iran announced that it was scaling back its commitment to the 2015 nuclear deal with world powers, and will continue to do so every 60 days, unless signatories to the pact worked to remove it from the US sanctions.
Is a July Fed cut still on?
Despite the strong US jobs data and the uptick in US yields, with the 10-year US Treasury yield back above 2%, market pricing for the July Fed meeting still suggest a 96.5% probability of a 25bps rate cut. Before the meeting on the 31st, we may get more clues and insight on current Fed thinking when Chairman Powell delivers his semi-annual testimony on Wednesday and Thursday.
Following his Thursday testimony, Fedspeakers will be out in force, with speeches scheduled from Bostic (dove, non-voter), Barkin (hawk, non-voter) and Kashkari (dove, non-voter), so we could get some interesting perspectives.
GBP/USD And USD/CAD Showing Signs Of Weakness
GBP/USD started a major decline after it failed to surpass the 1.2750 resistance area. USD/CAD is also trading in a bearish zone and it could struggled to climb above 1.3120.
Important Takeaways for GBP/USD and USD/CAD
- The British Pound remained in a bearish zone after it settled below the 1.2640 support.
- There is a major bearish trend line forming with resistance near 1.2560 on the hourly chart of GBP/USD.
- USD/CAD struggled to continue higher and recently declined below the 1.3120 support.
- The pair recently surpassed a connecting bearish trend line with resistance near 1.3065 on the hourly chart.
GBP/USD Technical Analysis
The British Pound failed to extend gains above 1.2740 this past week against the US Dollar. As a result, the GBP/USD pair started a major decline and broke the 1.2680 and 1.2640 support levels to move into a bearish zone.
The recent decline gained pace below the 1.2600 level and the 50 hourly simple moving average. The pair even broke the 1.2500 level and recently traded close to the 1.2480 level on FXOpen.
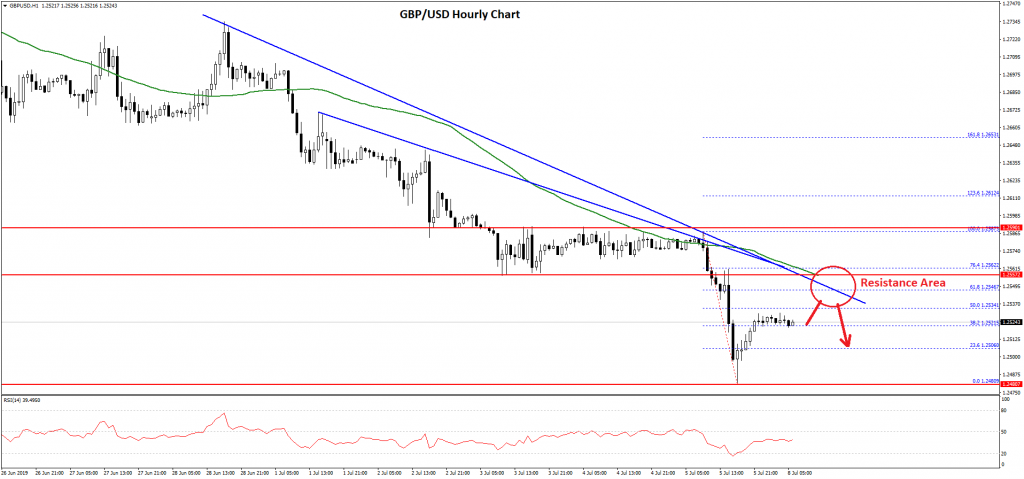
A swing low was formed near 1.2480 and the pair is currently correcting higher. It traded above the 1.2500 level and the 23.6% Fib retracement level of the last decline from the 1.2587 high to 1.2480 low.
However, there are many resistances on the upside near 1.2540 and 1.2550 levels. Moreover, there is a major bearish trend line forming with resistance near 1.2560 on the hourly chart of GBP/USD.
The 50% Fib retracement level of the last decline from the 1.2587 high to 1.2480 low is also near 1.2534 to act as a resistance. However, the main resistance is near the 1.2580 level and the 50 hourly simple moving average.
To start a fresh increase, the pair must settle above the 1.2580 resistance and the 50 hourly simple moving average. On the downside, an initial support is near the 1.2500 level, below which the pair could once again test the 1.2480 level.
USD/CAD Technical Analysis
The US Dollar made another attempt to climb above the 1.3140 and 1.3150 resistance levels against the Canadian Dollar. The USD/CAD pair topped near the 1.3136 level and recently started a major decline.
During the last rise, the pair surpassed a connecting bearish trend line with resistance near 1.3065 on the hourly chart. However, it failed to hold gains and recently declined from the 1.3136 high.
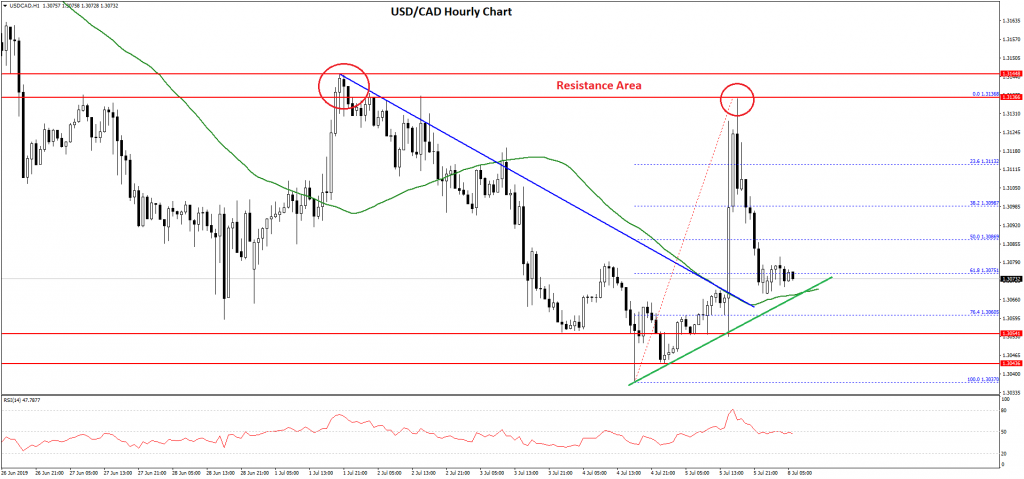
There was a break below the 1.3100 support level and the 50% Fib retracement level of the last wave from the 1.3037 low to 1.3136 high. The recent decline was such that the pair even broke the 1.3080 support area.
At the moment, the pair is consolidating above the 50 hourly simple moving average and just below the 61.8% Fib retracement level of the last wave from the 1.3037 low to 1.3136 high.
If there is a downside break below the 1.3060 support plus the 50 hourly simple moving average, there could be a sharp decline in the near term. The next key support is near the 1.3040 and 1.3020 levels.
On the upside, the main resistances for USD/CAD are near 1.3100 and 1.3120. Should there be a break above the 1.3120 level, the pair could continue to rise in the coming sessions.
Market Morning Briefing: Aussie Has Tumbled Below 0.70
STOCKS
The strong jobs data from the US on Friday has dashed the hopes of an immediate rate cut from the Fed. As such the equities have seen some profits being taken-off from the table. However, the bigger picture continue to be in favor of the equities. Significant support in the indices like the Dow, DAX and Shanghai can limit the down and trigger a fresh leg of rally in the coming days.
Though the Dow (26922.12, -43.88, -0.16%) has closed in red on Friday, the bounce from its intra-day low of 26733 indicates lack of strong sellers to drag it lower. This keeps the broader bullish view intact. Dow may consolidate between 26500 and 27000 for some time before a fresh rally to 27200-27500 is seen.
DAX (12568.53, -61.37, -0.49%) has support at 12450. While above this support the broader bullish view is intact to see a rise to 12800 and 13000 in the coming weeks. A near-term consolidation between 12450 and 12650 is possible before we see a fresh rally targeting the above mentioned levels.
Nikkei (21554.38, -192, -0.88%) looks mixed and can consolidate between 21500 and 21750 for some time. A breakout on either side of 21500 or 21750 will decide the next direction of move.
Shanghai (2958.47, -52.59, -1.75%) has declined sharply breaking below 2970. It is now hovering above the crucial support level of 2950 which we expect to hold and trigger a rise to 2970 and 3000 again.
Sensex (39513.39, -394.67, -0.99%) and Nifty (11811.15, -135.60, -1.14%) have declined sharply on Friday. They have crucial supports near current levels at 39500 (Sensex) and 11800 (Nifty) which needs to hold to avoid further fall. A break below these supports can drag them to 39000 (Sensex) and 11650 (Nifty) in the coming days.
COMMODITIES
Gold and Silver have come-off sharply on profit-booking after the US jobs data on Friday. Both, gold and silver have room on the downside but crucial supports are coming up which will need a close watch to see if they manage to bounce-back from there or not. Copper can dip in the near-term while oil remains mixed and can trade in a broad sideways range.
Gold (1399) has key resistances at 1403 and 1410 which can cap the upside in the near term. While these resistances hold a fall to 1380 can be seen this week. The level of 1380 is a crucial support, a break below which will confirm a double top reversal pattern on the daily chart.
Silver (15.02) has resistance at 15.10 and can fall to 14.80-14.75 in the coming days. The level of 14.75 is a crucial support which has to hold to avoid further fall towards 14.50.
Copper (2.66) can dip to 2.62-2.60 while it remains below the 2.68-2.70 resistance zone.
Brent (64.35) can rise to 65.50 and 66 in the near term while it remains above 64. A break below 64 will negate this rise and drag it to 66.
Nymex WTI (57.61) looks mixed in the near term and can remains sideways between 56 and 58. The broader bias is bearish and we expect it to break 56 eventually and fall to 54 and even lower levels in the coming days.
FOREX
Dollar has got a boost from the strong nonfarm payroll numbers on Friday. The outlook is bullish and the greenback can strengthen further in the coming days which in turn can drag the major lower in the coming days.
Dollar Index (97.25) has risen above 97 and remains bullish. A rise to 97.80-98 is possible in the coming days while it remains above the 97.00-96.90 support zone.
Contrary to our expectation, Euro (1.1225) has declined below the support at 1.1250 and is under pressure. The next support at 1.12 can be tested now and a break below it can drag the Euro lower to 1.1150. Resistance is at 1.1250.
Dollar-Yen (108.50) has bounced sharply above 108 again and looks bullish in the near term. A test of 108.75 and 109 is possible while it remains above 108.35
Euro-Yen (121.80) is range bound between 121 and 123.5 and can move higher to 123-123.5 within this range in the coming days. A break above 122 will trigger this rise.
Aussie (0.6981) has tumbled below 0.70 and is hovering above a key support level of 0.6950. The bias is negative for it to break 0.6950 and fall to 0.6900 or even lower in the coming days. Resistance is in the 0.6990-0.7000 region.
Pound (1.2525) is managing hold above the key support level of 1.25. Though an intermediate bounce to 1.26 cannot be ruled out in the near-term, the broader view remains bearish for it to break 1.25 and fall to 1.2350 in the coming days.
USDCNY (6.8925) has surged in early trades today and can test the resistance at 6.90. A break above 6.90 will take it to 6.92-6.93. But a pull-back from 6.90 can keep the pair in the 6.83-6.90 range for some more time.
USDINR (68.4250) has support in the 68.40-68.35 region which can hold for a while and trigger a bounce to 68.80 or even higher levels in the near term. But the broader view remains bearish for the USDINR to break 68.35 eventually and fall to 68 in the coming days.
INTEREST RATES
The strong US nonfarm payroll numbers have given a breather to the yields as it has reduced the chances of an immediate rate cut from the Fed. The yields have bounced on Friday and can either consolidate or see an intermediate bounce within their overall downtrend.
The US Treasury yields are up sharply across tenors. The 2Yr (1.85%), 5Yr (1.82%), 10Yr (2.02%) and 30Yr (2.53%) were up between 6 and 9 bps. The 10Yr (2.02%) has bounced back above the 2% mark. It can move further up to 2.08%-2.10% in the near term while it remains above 2.%. Similarly, the 5Yr (1.82%) can rise to 1.88% and 1.90% while it sustains above 1.80%.
The 5Yr (-0.64%), 10Yr (-0.37%) and 30Yr (0.24%) German yields were up sharply while the 2Yr (-0.76%) was down marginally. The yields can move further higher in the near term .The 5Yr can test -0.60% while the 10Yr can move up to -0.32% and -0.30%.
The 10Yr GOI tumbled to 6.5636% on Friday and has bounced from there. Strong support is in the 6.60%-6.55% which can halt the current downtrend and trigger a reversal to 7.00% and 7.10% in the coming weeks.
EUR/USD Starts Fresh Decrease Towards 1.1150
Key Highlights
- The Euro failed to hold the 1.1280 support and recently declined against the US Dollar.
- EUR/USD traded below a key bullish trend line with support at 1.1280 on the 4-hours chart.
- The US nonfarm payrolls in June 2019 increased 224K, more than the 160K forecast.
- Germany's Industrial Production in May 2019 (MoM) could slide 0.4%, less than the last -1.9%.
EURUSD Technical Analysis
After trading above the 1.1400 level, the Euro struggled to continue higher against the US Dollar. As a result, the EUR/USD pair started a fresh decrease and broke the 1.1350 and 1.1300 support levels.
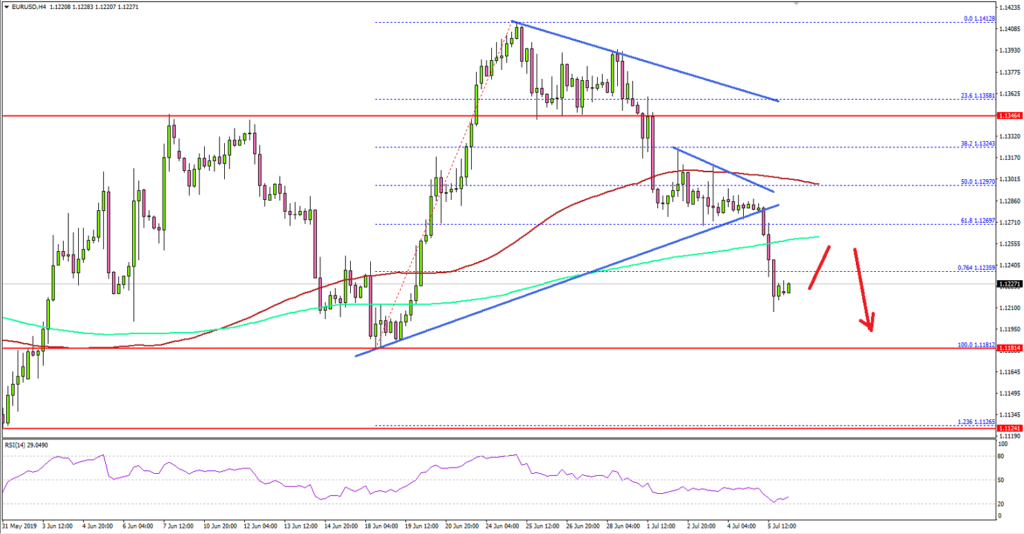
Looking at the 4-hours chart, the pair traded below a couple of important support near the 1.1300 level plus the 100 simple moving average (red, 4-hours). The pair even broke the 50% Fib retracement level of the upward move from the 1.1181 low to 1.1412 high.
Moreover, the pair traded below a key bullish trend line with support at 1.1280 on the same chart. It opened the doors for more losses below the 1.1250 level plus the 200 simple moving average (green, 4-hours).
Finally, the pair traded below the 76.4% Fib retracement level of the upward move from the 1.1181 low to 1.1412 high. Therefore, there are high chances of more losses below the 1.1200 and 1.1180 support levels.
Conversely, if there is an upside correction, the last key support near the 1.1280 level plus the 100 simple moving average (red, 4-hours) are likely to act as a strong barrier. Only a successful close above the 1.1300 level could start a fresh increase.
Fundamentally, the US nonfarm payrolls report for June 2019 was released by the US Department of Labor. The market was looking for an increase of 160K in June 2019, better than the last 75K.
The actual result was well above the market expectation, as the US nonfarm payrolls increased by 224K. However, the last reading was revised down from 75K to 72K. More importantly, the Unemployment rate increased from 3.6% to 3.7%.
The report added:
Among the major worker groups, the unemployment rates for adult men (3.3 percent), adult women (3.3 percent), teenagers (12.7 percent), Whites (3.3 percent), Blacks (6.0 percent), Asians (2.1 percent), and Hispanics (4.3 percent) showed little or no change in June.
Overall, EUR/USD and GBP/USD might continue to face selling interest and a decent recovery might be difficult in the short term.
Economic Releases to Watch Today
- Germany's Industrial Production for May 2019 (MoM) – Forecast -0.4%, versus -1.9% previous.
- Germany's Trade Balance for May 2019 – Forecast €18.6B, versus €17.0B previous.
- Germany's Imports of goods and services May 2019 – Forecast -0.2%, versus -1.3% previous.
- Germany's Exports of goods and services May 2019 – Forecast 0%, versus -3.7% previous.
China foreign exchange reserves rose 0.6% to USD 3.119T
China's foreign exchange reserves rose USD 18.2B, or 0.6%, to USD 3.119T in June. Value of gold reserves rose from USD 79.83B to USD 87.27B. China's State Administration of Foreign Exchange noted that Dollar index dropped while asset prices in international markets rose in June, factored by global trade situation and monetary policy of major central banks. Combined together, exchange rate conversion and asset price changes contributed to the increase in the country's foreign exchange reserves.
SAFE also noted despite increased uncertainties, China's economy has been "generally stable and operating in a reasonable range". Supply and demand in the foreign exchange market has been "basically balance". Looking forward, China will continue to promote high-quality economic development and actively implement all-round opening up measures.
Resilience and sustainability of economic growth will be further enhanced. These will provide strong support for the stability of China's foreign exchange market, thus providing a solid foundation for maintaining the overall stability of foreign exchange reserves.
Daily Markets Broadcast
US indices off highs despite strong payrolls
US nonfarm payrolls rebounded strongly in June, data released Friday showed, but it was not enough to keep powering US indices to new highs in holiday-thinned trading. Greece is to get a new Prime Minister while Turkey has replaced its central bank governor.
US30USD Daily Chart
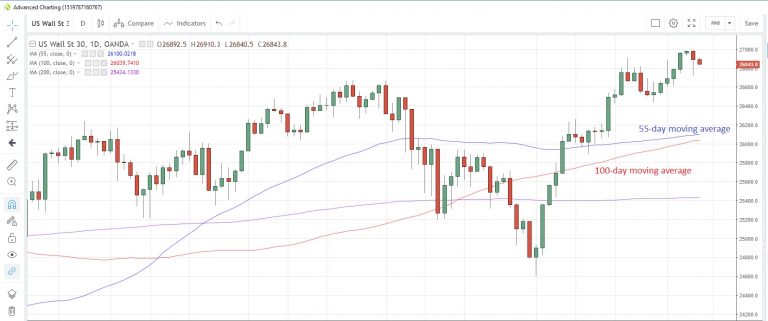
The US30 index snapped a six-day winning streak on Friday, retreating from Thursday's record high
The 100-day moving average at 26,039 is edging closer to the 55-day average at 26,100 and they could possibly cross over later this week
The US economy added 224,000 jobs in June, well above estimates of a 160,000 gain. The unemployment rate ticked higher to 3.7% while average hourly earnings rose 0.2% m/m, less than forecast. The are no major data releases scheduled for today.
DE30EUR Daily Chart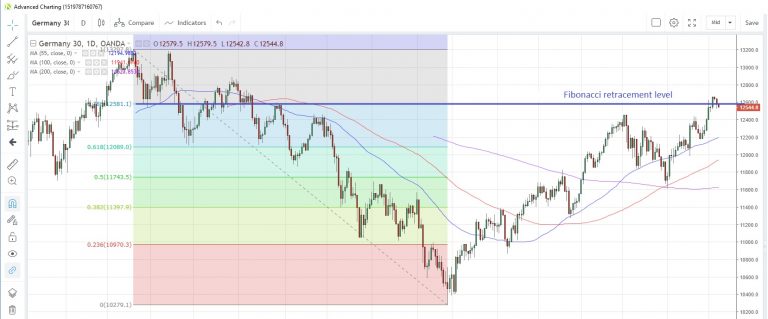
The Germany30 index fell for a second straight day on Friday and looks set to extend those losses today. Deutsche Bank announced an $8.3 billion cost-saving turnaround plan involving the loss of 18,000 jobs
The index fell back below the 78.6% Fibonacci retracement of the May-December drop last year at 12,581. The 55-day moving average is at 12,195
Germany's factory orders disappointed in May and this could filter through into the industrial production numbers for the same month. Surveys suggest IP declined 0.4% m/m, an improvement from April's -1.9%.
CN50USD Daily Chart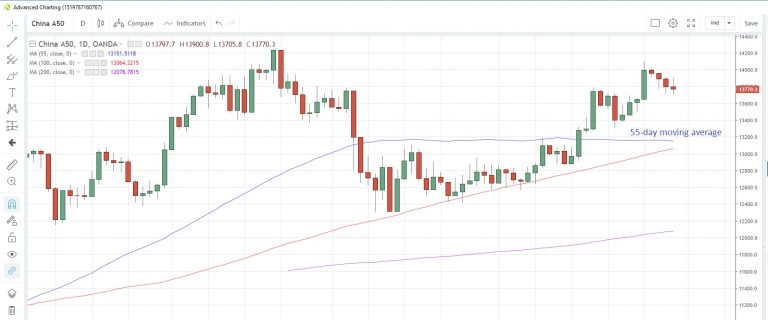
The China50 index fell for a fourth straight day on Friday but still managed to post a sixth weekly gain
The index closed 2.3% off the July 1 high with the nearest support level possibly the 55-day moving average at 13,151
China's new loans data are due tomorrow and are expected to show another solid gain in July. In the first six months of this year, new loans have risen by more than nine trillion yuan ($1.3 trillion), an indication of the type of stimulus flows that are hitting the economy.
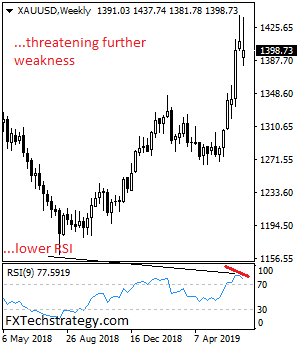
GOLD Nearer Term Price Weakness Remains Valid
GOLD nearer term price weakness remains valid as it looks for more weakness. On the downside, support comes in at the 1,390.00 level where a break will turn attention to the 1,380.00 level. Further down, a cut through here will open the door for a move lower towards the 1,370.00 level. Below here if seen could trigger further downside pressure targeting the 1,360.00 level. Conversely, resistance resides at the 1,400.00 level. Further out, resistance resides at the 1,410.00 level where a break will aim at the 1,420.00 level. A turn above there will expose the 1,430.00 level. Further out, resistance stands at the 1,440.00 level. All in all, GOLD looks to strengthen further in the short term.
EURUSD Weakness Targets 1.1181/15 Zone
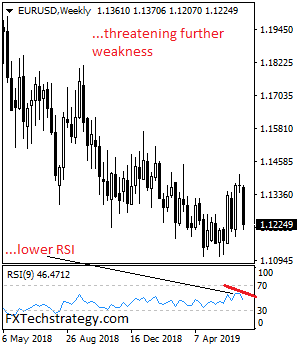
EURUSD weakness targets 1.1181/15 zone as it expects further weakness. Support comes in at the 1.1200 where a violation will turn risk to the 1.1150 level. A break below here will target the 1.1100 level. Further down, support sits at the 1.1050. Its weekly RSI is bearish and pointing lower suggesting further weakness. Conversely, on the upside, resistance resides at 1.1250 level with a break through there opening the door for further upside towards the 1.1.1300 level. Further up, resistance comes in at the 1.1350 level where a violation will expose the 1.1400 level. All in all, EURUSD expects more weakness in the days ahead.