Sample Category Title
USD/CAD Weekly Outlook
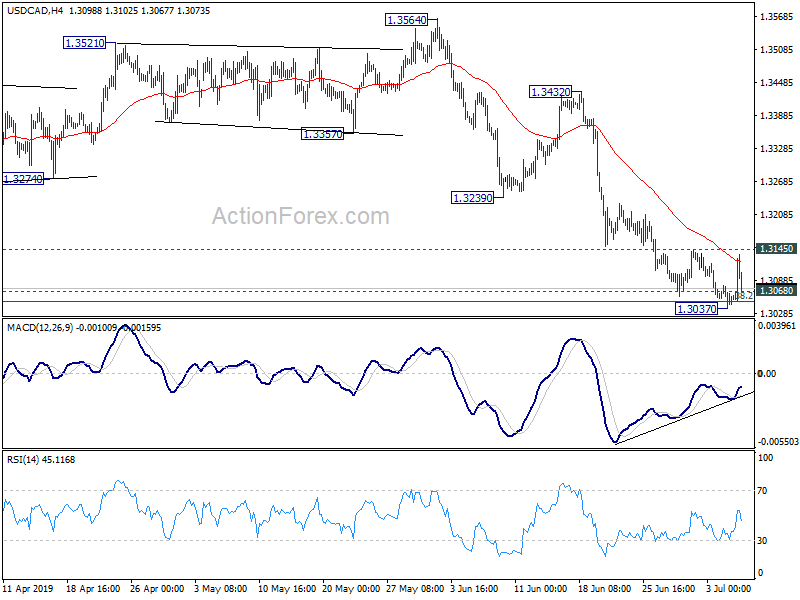
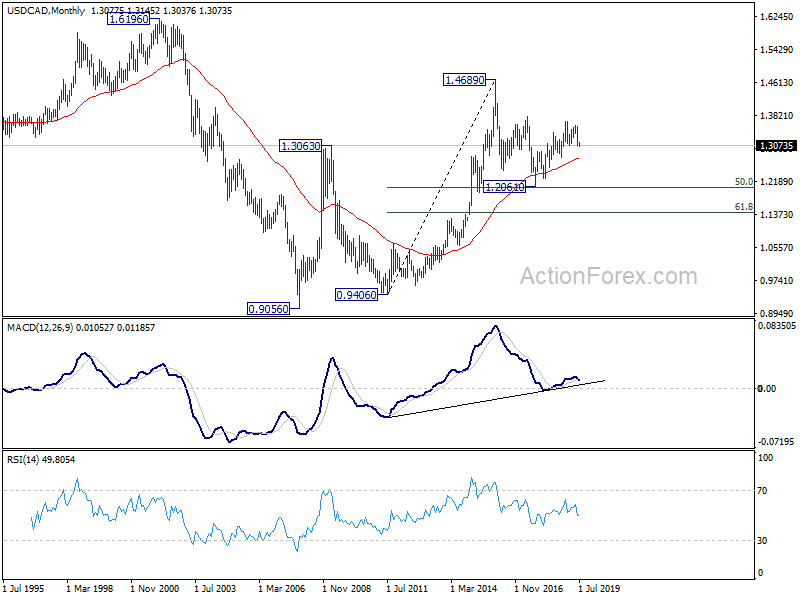
USD/CAD edged lower to 1.3037 last week but failed to sustain below 1.3052/68 cluster support. Initial bias remains neutral this week first. On the upside, break of 1.3145 resistance, will indicate short term bottoming, with bullish convergence condition in 4 hour MACD. Further rise should then be seen to 1.3239 support turned resistance. On the downside, sustained trading below 1.3052/68 will carry larger bearish implication, and bring further fall to 1.2673 fibonacci level next.
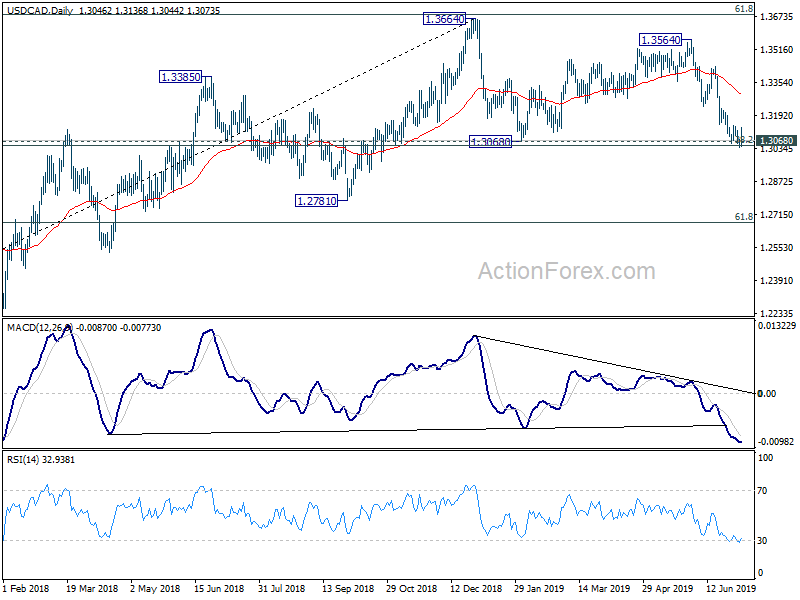
In the bigger picture, medium term outlook stays neutral for now even though the case of bearish reversal is building up. Decisive break of 1.3068 cluster support (38.2% retracement of 1.2061 to 1.3664 at 1.3052) will confirm completion of up trend from 1.2061 (2017 low). Further fall should be seen to 61.8% retracement at 1.2673 next. On the upside, sustained break of 61.8% retracement of 1.4689 (2016 high) to 1.2061 at 1.3685, is needed to confirm resumption of up trend from 1.2061 (2017 low). Otherwise, risk will stay on the downside.
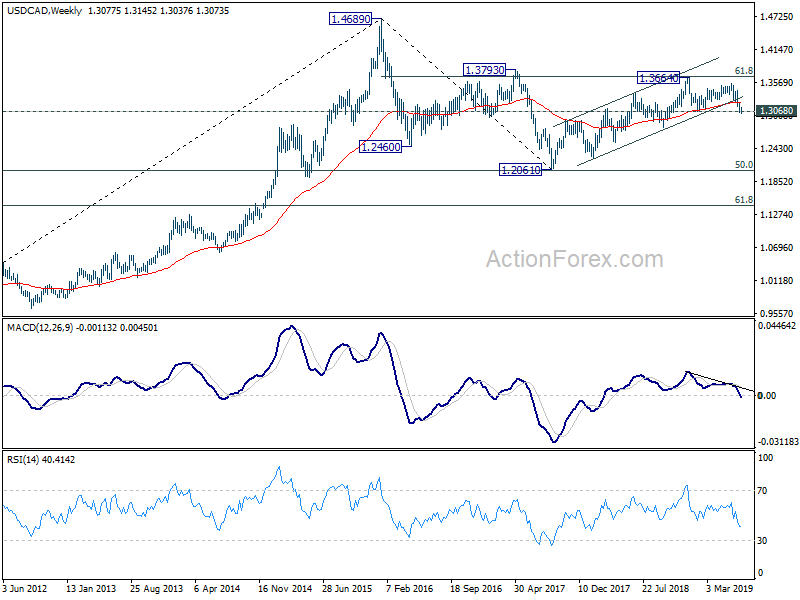
In the longer term picture, outlook remains unchanged that price actions from 1.4689 (2016 high) are forming a corrective pattern. Rejection by 1.3793 resistance would raise the chance of lengthier extension, with risk of dropping through 1.2061 low before completion.
GBP/JPY Weekly Outlook
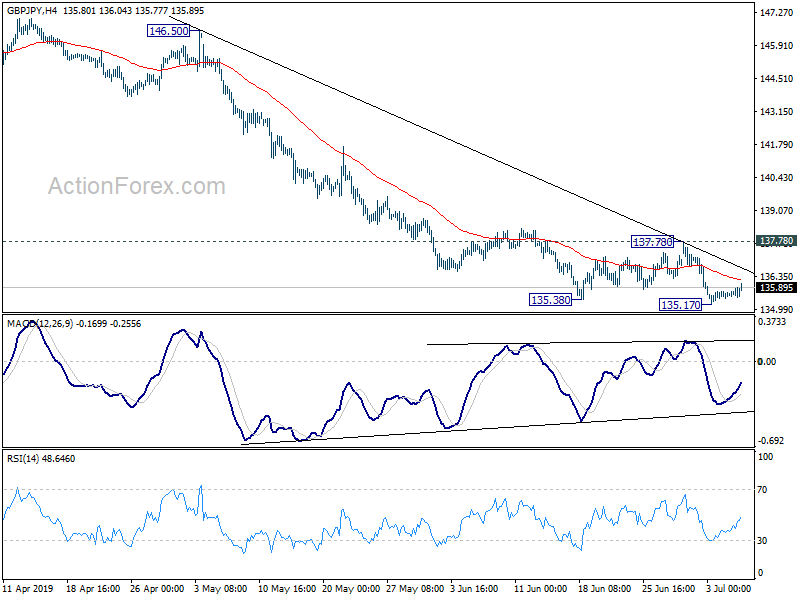
GBP/JPY's decline from 148.87 resumed last week but edging down to 135.17. But as a temporary low is formed, initial bias is neutral this week first. Upside of recovery should be limited by 137.78 resistance to bring fall resumption. Break of 135.17 will target 131.51 low next.
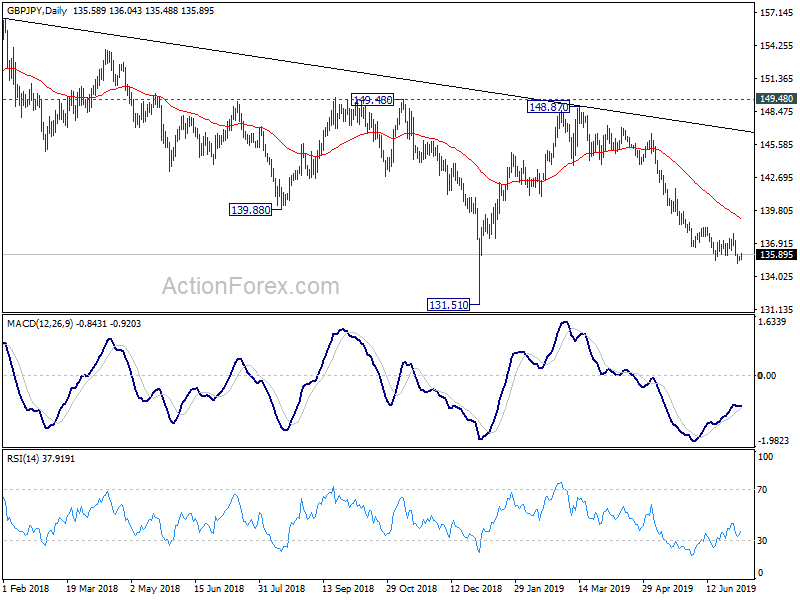
In the bigger picture, current development suggests that GBP/JPY's medium term fall from 156.59 (2018 high) is still in progress. Break of 131.51 will target 122.36 (2016 low). Structure of such decline is corrective looking so far, arguing that it's just the second leg of consolidation from 122.36. Thus, we'd expect strong support from 122.36 to contain downside to bring reversal.
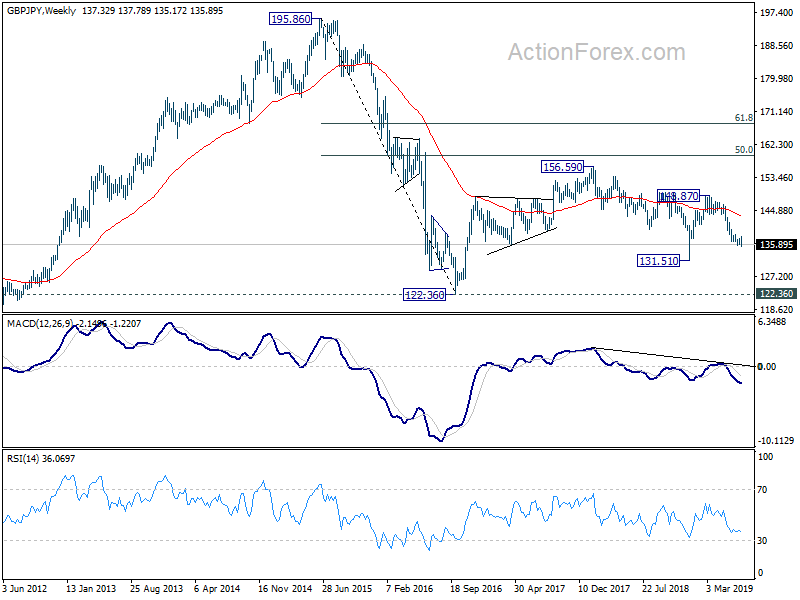
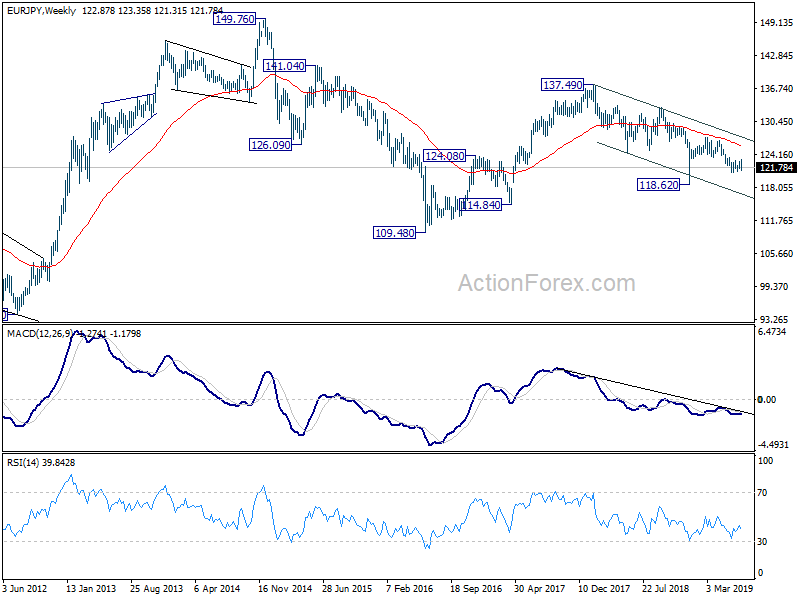
In the longer term picture, firstly, GBP/JPY's is kept well below 55 month EMA, keeping outlook bearish. But we're treating price actions from 122.36 as a corrective pattern. Hence, we'd expect range trading to continue longer. In case of an extension, strong resistance is likely to be seen at 50% retracement of 195.86 (2015 high) to 122.36 at 159.11 to limit upside. However, break of 122.26 will put 116.83 (2011 low) back into focus.
EUR/JPY Weekly Outlook
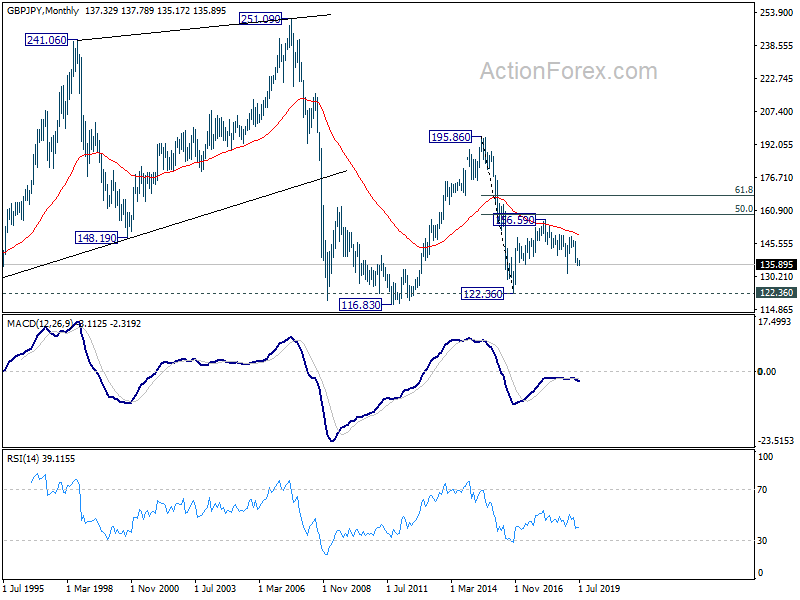
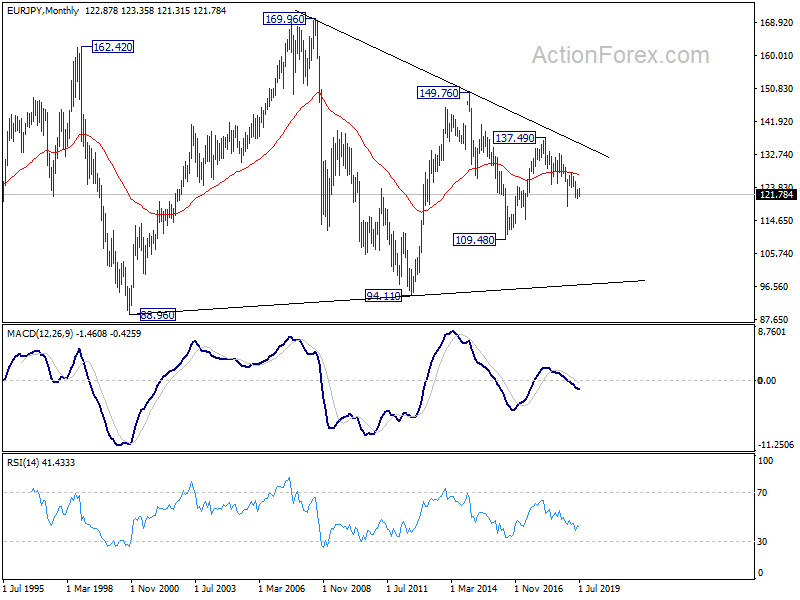
EUR/JPY dropped to 121.31 last week but recovered ahead of 120.78 support. Initial bias is turned neutral this week first. We're still favoring the case that consolidation from 120.78 has completed with three waves to 123.35. Below 121.31 will target retest of 120.78 first. Break will resume fall from 127.50 to 118.62 low. In case of another rise as consolidation from 120.78 extends, upside should be limited by 123.73 resistance to bring fall resumption eventually.
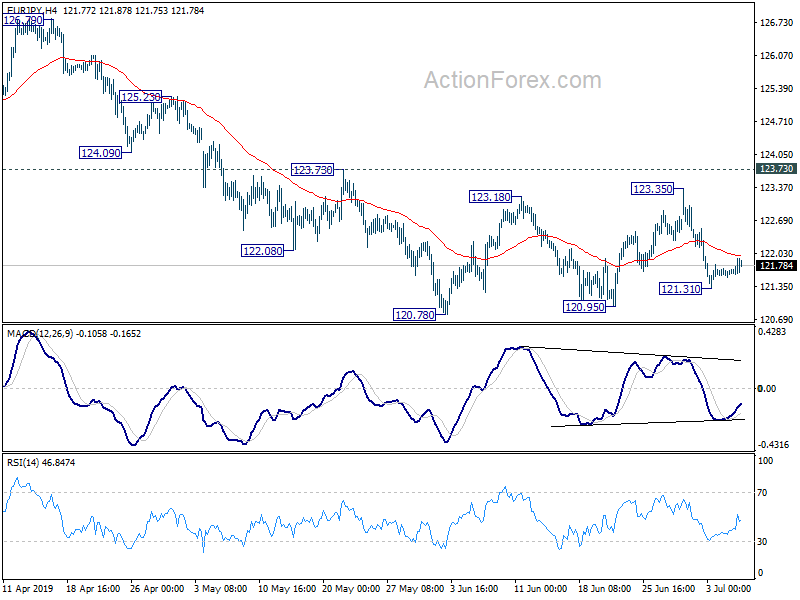
In the bigger picture, down trend from 137.49 is still in progress with the cross staying inside long term falling channel. Break of 118.62 will extend the fall to 109.48 (2016 low). On the upside, break of 127.50 resistance is needed to be the first sign of medium term reversal. Otherwise, outlook will remain bearish in case of strong rebound.
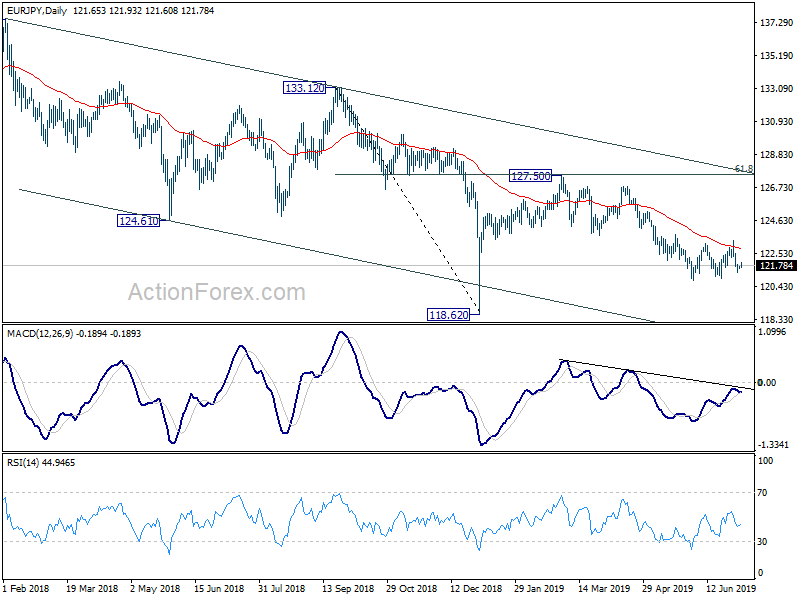
In the long term picture, EUR/JPY is staying in long term sideway pattern, established since 2000. Fall from 137.49 is seen as a falling leg inside the pattern. Break of 118.62 will extend this falling leg through 109.48 (2016 low). With EUR/JPY staying below 55 month EMA, this is now the preferred case.
EUR/GBP Weekly Outlook
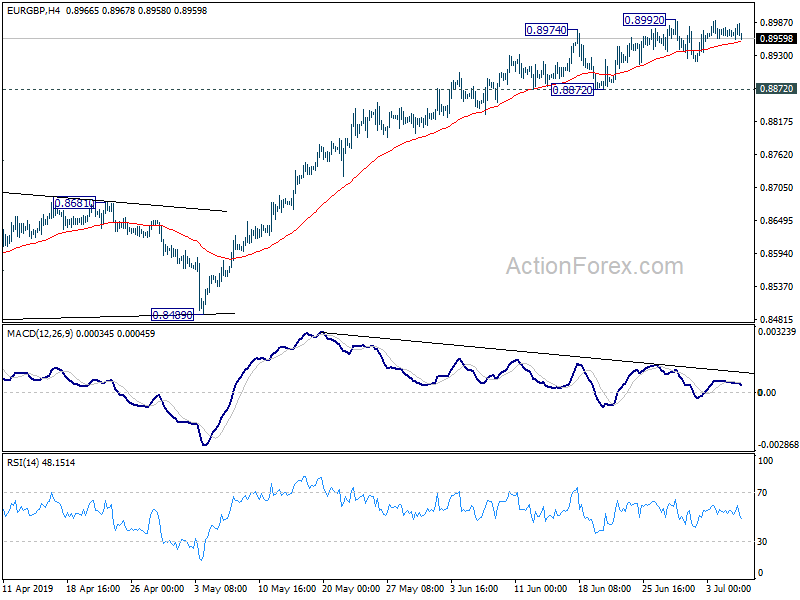
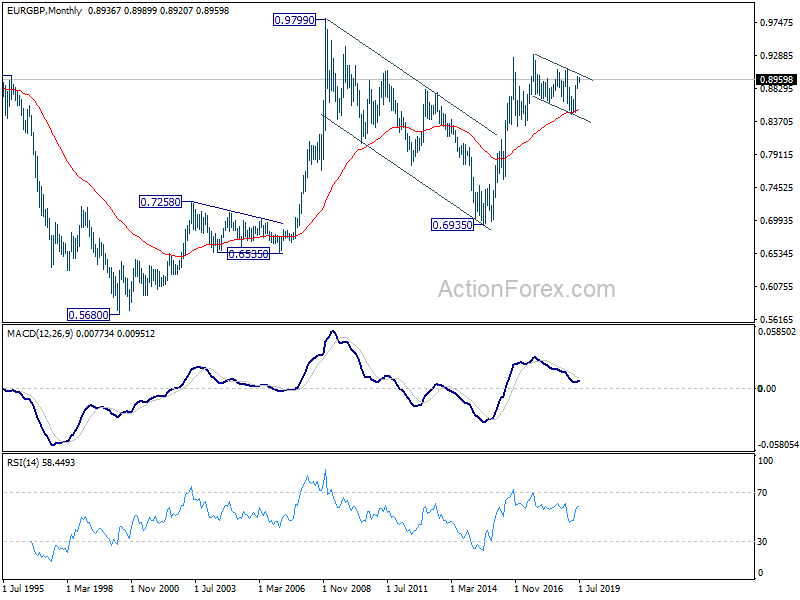
EUR/GBP stayed in consolidation below 0.8992 last week and outlook is unchanged. Further rise is expected as long as 0.8872 support holds and break of 0.8992 is expected. However, considering bearish divergence condition in4 hour MACD, we'd look for topping signal as it approaches 0.9101 key resistance. On the downside, break of 0.8872 will indicate short term topping. In this case, deeper pull back could be seen to 55 day EMA (now at 0.8830) first.
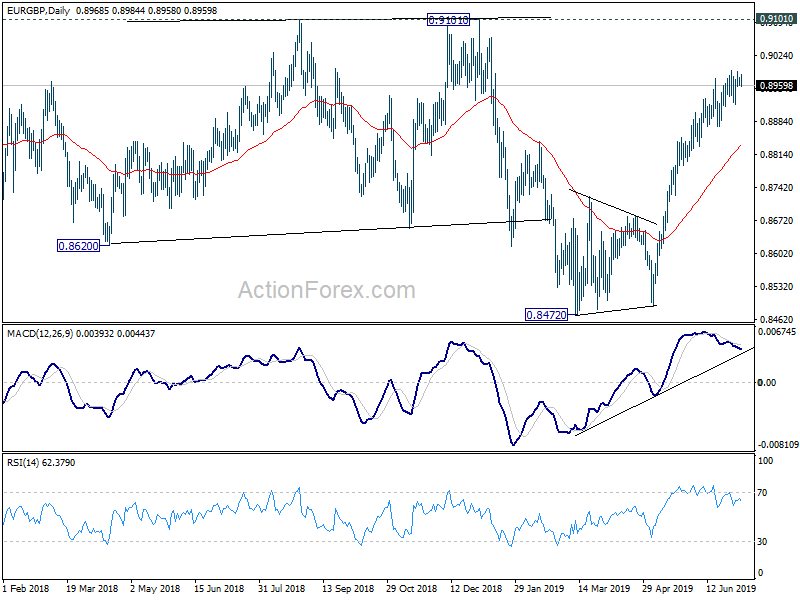
In the bigger picture, medium term decline from 0.9305 (2017 high) is seen as a corrective move. No change in this view. Current development argues that it might have completed with three waves down to 0.8472, just ahead of 38.2% retracement of 0.6935 (2015 low) to 0.9306 at 0.8400, after hitting 55 month EMA (now at 0.8527). Decisive break of 0.9101 resistance will confirm this bullish case. Nevertheless, as EUR/GBP is still staying inside long term falling channel, correction from 0.9305 could still extend to 0.8400 fibonacci level before completion, if upside is rejected by 0.9101.
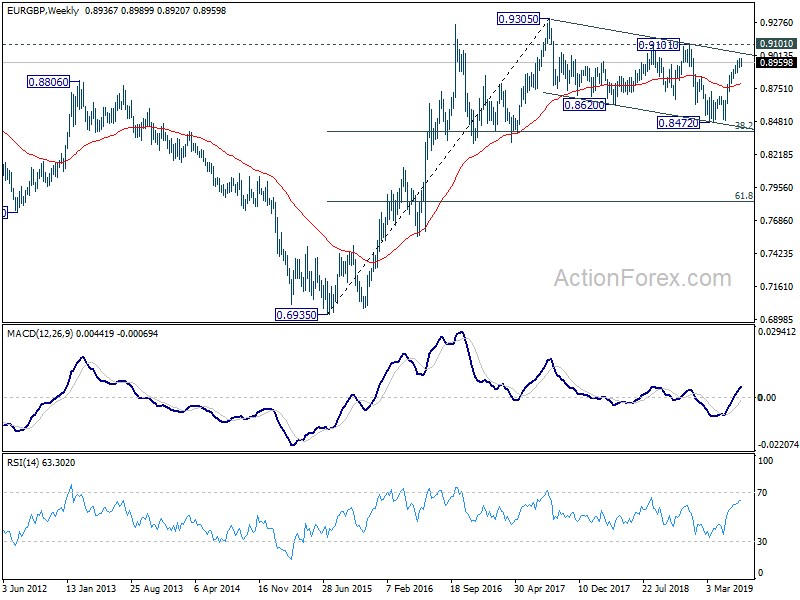
In the long term picture, we're holding on to the view that rise from 0.6935 (2015 low) is resuming the up trend from 0.5680 (2000 low). As long as 38.2% retracement of 0.6935 to 0.9306 at 0.8400 holds, further rise should be seen through 0.9305 to 0.9799 and above down the road.
EUR/AUD Weekly Outlook
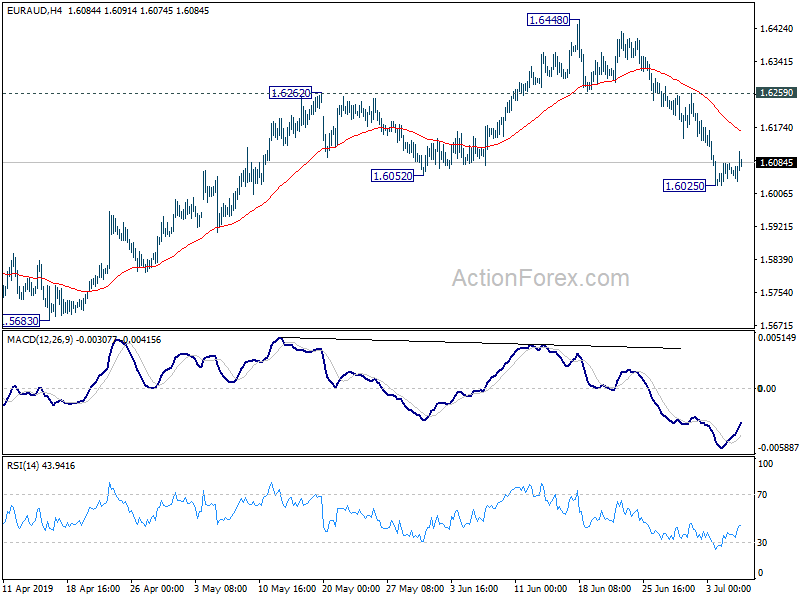
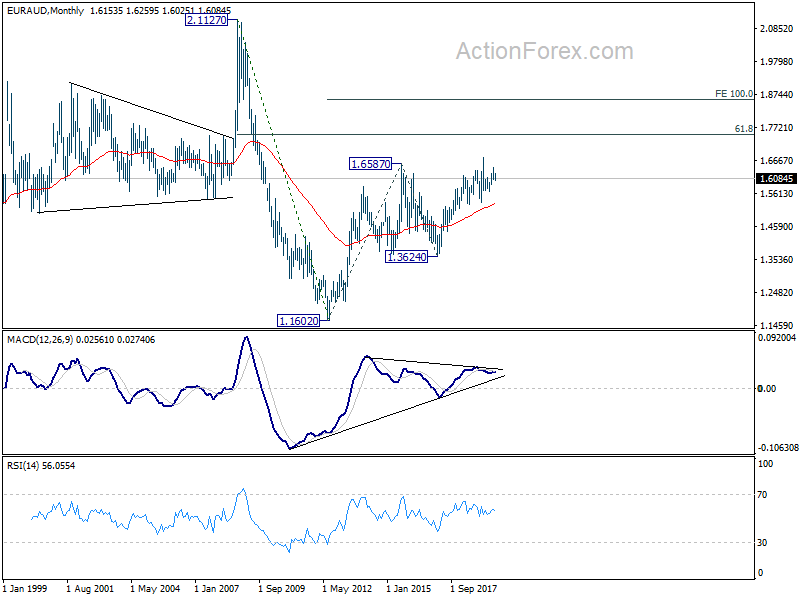
EUR/AUD dropped further to as low as 1.6025 last week and breached 1.6052 support. With a temporary low in place, initial bias is neutral this week first. Upside of consolidation should be limited below 1.6259 resistance to bring fall resumption. Decline from 1.6448 is now seen as the third leg of the consolidation pattern from 1.6765 high. Break of 1.6025 will target 1.5683 support and below.
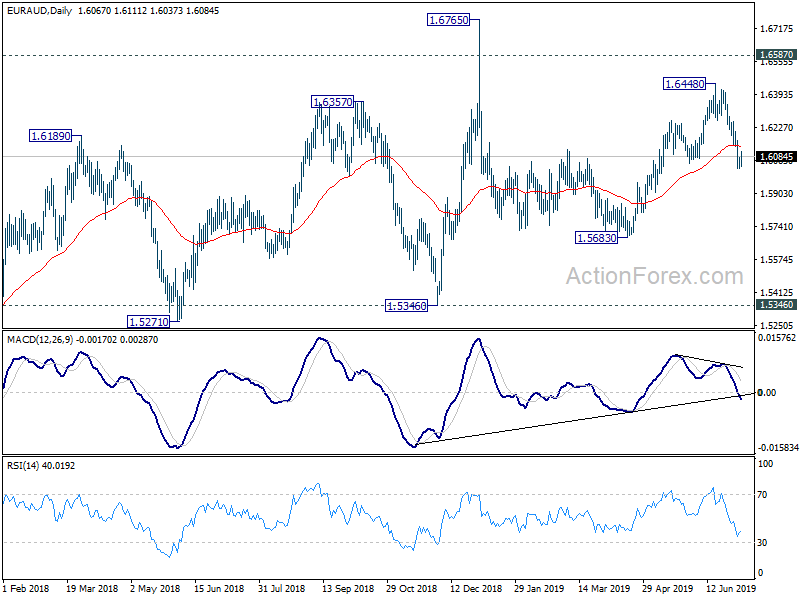
In the bigger picture, as long as 1.5346 support holds, outlook will still remain bullish. Up trend from 1.1602 (2012 low) is expected to resume sooner or later. Break of 1.6765 will target 61.8% retracement of 2.1127 (2008 high) to 1.1602 at 1.7488 next. However, firm break of 1.5346 key support will indicate trend reversal and turn outlook bearish.
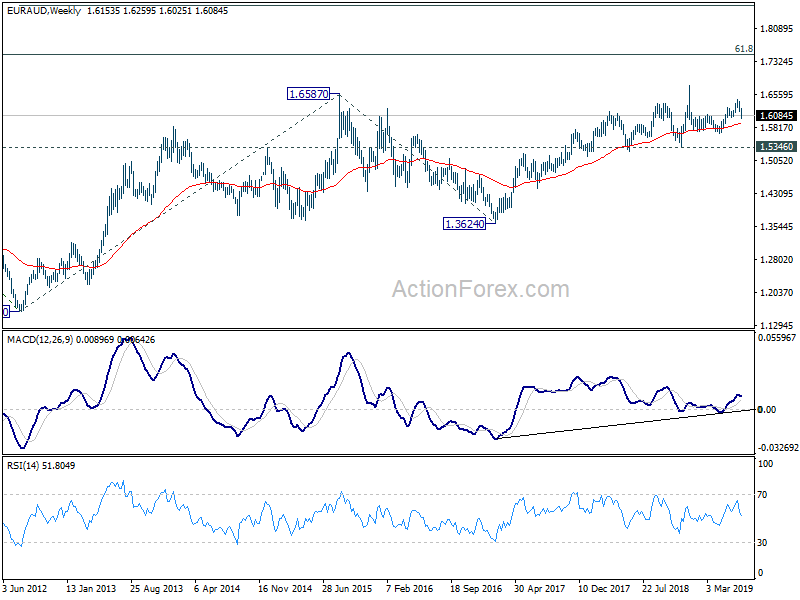
In the longer term picture, the rise from 1.1602 long term bottom (2012 low) is still in progress for 61.8% retracement of 2.1127 to 1.1602 at 1.7488. This will remain the favored case as long as 1.5346 remains intact.
EUR/CHF Weekly Outlook
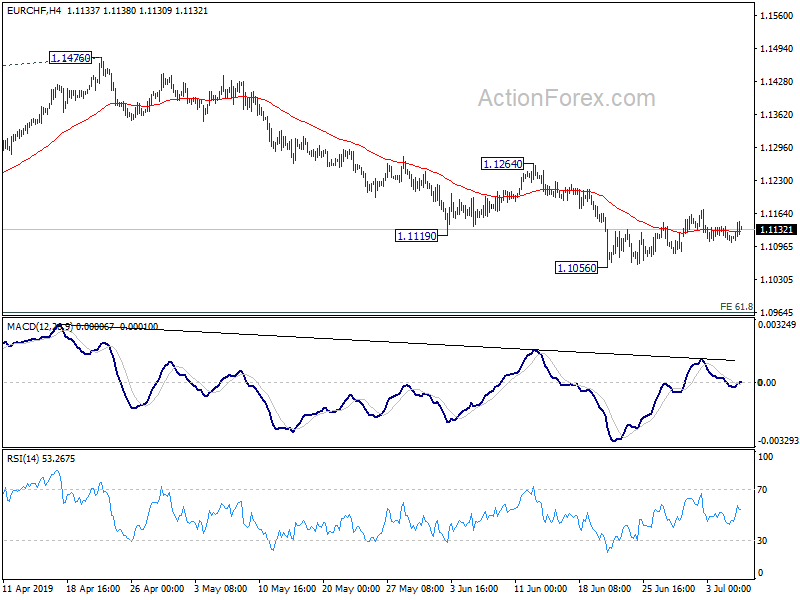
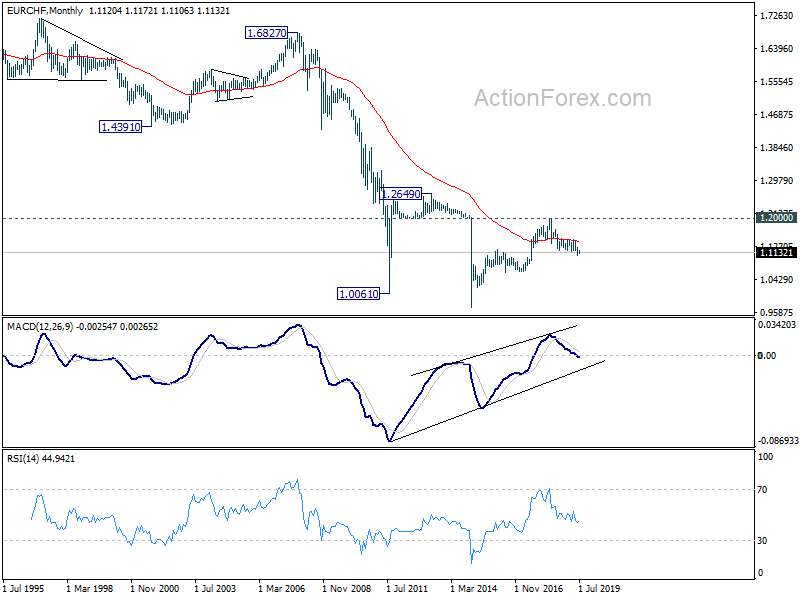
EUR/CHF extended the consolidation from 1.1056 last week. Outlook remains unchanged for now. Initial bias stays neutral this week first. In case of another recovery, upside should be limited below 1.1264 resistance to bring fall resumption. On the downside, break of 1.1056 will extend the larger down trend for 61.8% projection of 1.2004 to 1.1173 from 1.1476 at 1.0962 next.
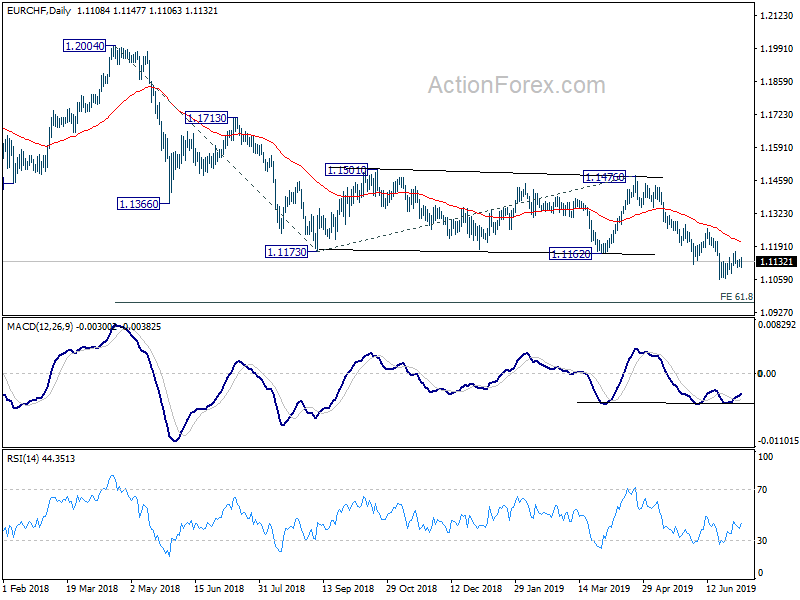
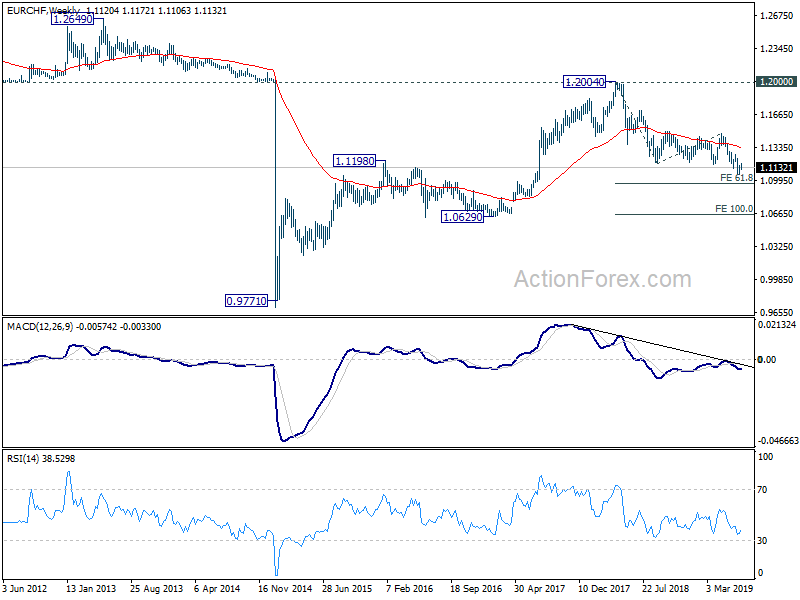
In the bigger picture, current development firstly suggests that down trend from 1.2004 is still in progress. More importantly, it's likely a long term down trend itself, rather than a correction. Outlook will remain bearish as long as 1.1476 resistance holds. EUR/CHF could target 1.0629 support and below.
Markets Still Believe in a July Fed Cut, But Powell Has the Last Chance to Correct It
Major global treasury yield tumbled sharply last week on expectations of policy easing by central banks. In particular, ECB Governing Council member Olli Rehn issued panic call for further monetary stimulus "now". German 10-year bund yield hit as low as -0.407, below ECB's -0.40% deposit rate. UK 10-year gilt yield also dropped to as low as 0.655, before closing at 0.739, below BoE's benchmark rate of 0.75%. US 10-year yield also dropped to as low as 1.943.
However, stronger than expected US job data prompted rethink in, at least, Fed's policy path. Treasury yields also staged strong rebound to close the week. In the currency markets, Canadian Dollar ended as the strongest one, followed by Dollar., and then Yen. Swiss Franc was the weakest one as geopolitical tensions seemed to have eased. New Zealand Dollar was the second weakest, then Sterling.

US data indicated slowdown but no disaster, with solid NFP
To recap some of last week's data from US, non-farm payroll report showed 224k growth in the job market in June, notably above expectation of 164k. Prior month's dismal figure was revised slightly down from 75k to 72k. Unemployment rate rose 0.1% to 3.7%, above expectation of 3.6%. But, participation rate also rose 0.1% to 62.9%. Average hourly earnings rose 0.2% mom, below expectation of 0.3% mom. But prior month's wage growth was revised up from 0.2% mom to 0.3% mom.
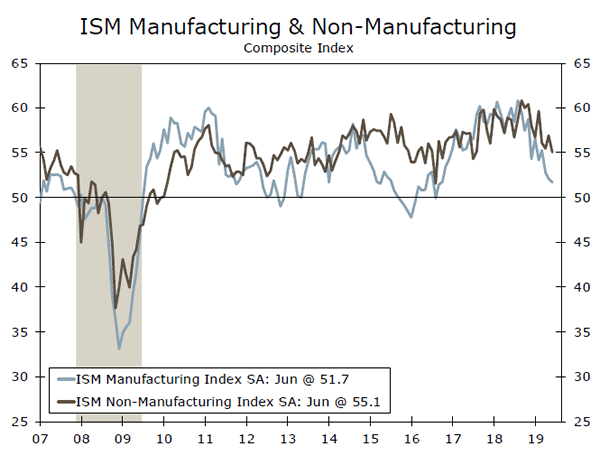
ISM Manufacturing Index dropped to 51.7 in June, down slightly from 52.1 but beat expectation of 51.0. On the negative side, New Orders dropped -2.7 to 50.0. Prices dropped sharply by -5.3 to 47.9. However, Production rose 2.8 to 54.1. Employment also rose 0.8 to 54.7. ISM Non-Manufacturing Composite dropped to 55.1 in June down from 56.9 and missed expectation of 56.0. Looking at some details, Business Activity dropped -3.0 to 58.2. New Orders dropped -2.8 to 55.8. Employment dropped -3.1 to 55.0.
Overall, the set of data suggested that while momentum of the US economy was slowing down, there was no steep deterioration. Indeed, NFP was back above 200k handle, arguing that May's poor number was just a blip. It should also be noted that the "sudden" threat of Mexico is now gone. US and China also agreed to return to negotiation table. Confidence might start to return for US businesses.
Fed Powell has the last chance to correct expectations on July cut
After last week's development, markets finally seem too be convinced that Fed won't adopt a 50bps rate cut on July 31. Still, fed fund futures suggest there is 100% chance of at least 25bps cut to 2.00-2.25%. One argument is that Fed has repeatedly emphasized that the inflation target is "symmetric". That is, most policymakers could allow inflation to overshoot temporarily. And thus, they have the room to opt for an insurance cut to guard against deeper slowdown in economy and job growth.

However, we'd like to emphasize that just back in June, eight FOMC policymakers expected interest rates to be unchanged for the whole of 2019, with one expected a rate hike. It's beyond imagination that those nine members could change their mind within just a matter of weeks, when developments were generally positive. On other hand, a total of eight policy markers expected rate cut this year, with seven expected total of 50bps cut. Yet, it's unsure how many of these eight wanted an imminent cut. Thus, to us, it's still more likely than not that Fed will stand pat this month.
If market pricing of rate cut for July is way off the mark, Fed will have, probably the last, chance to correct the expectations this week. FOMC June meeting minutes will reveal how urgent the members are regarding rate cut. So far, only St. Louis Fed President James Bullard has openly called for immediate action. More importantly, Fed Chair Jerome Powell will have his two-day Congressional Testimony on Wednesday and Thursday. If a July cut is not a done deal, he'd better be clearcut and straightforward.
Dollar index medium term bullishness revived
Dollar index's rebound from 95.83 extended higher last week and took out 55 day EMA decisively. The development affirmed the case that fall from 98.37 is a correction that's completed with three waves down to 95.83. Strong support was also seen from 55 week EMA and 55 month EMA. Thus, the development is reviving medium term bullishness. Focus will be turned back to 97.76 resistance first. Break will likely resume the up trend from 88.25 (2018 low), through 98.37 high.


GBP/USD Weekly Outlook
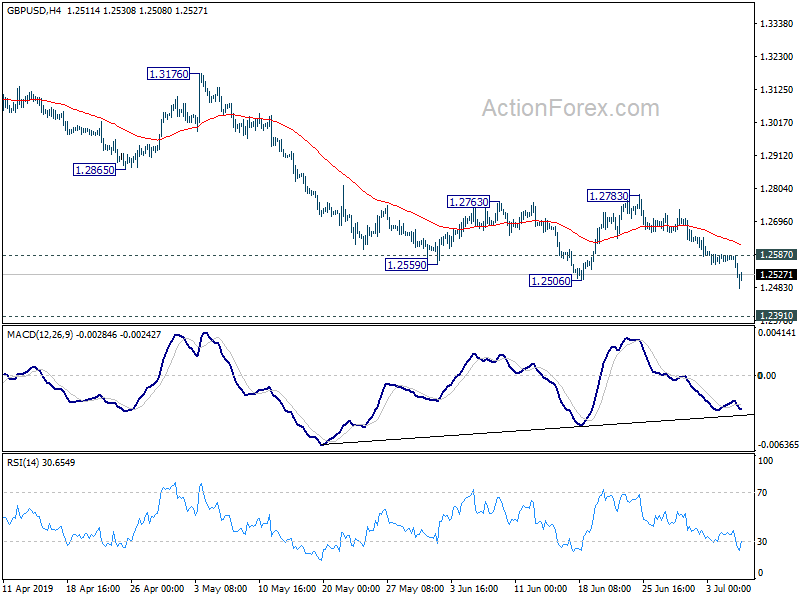
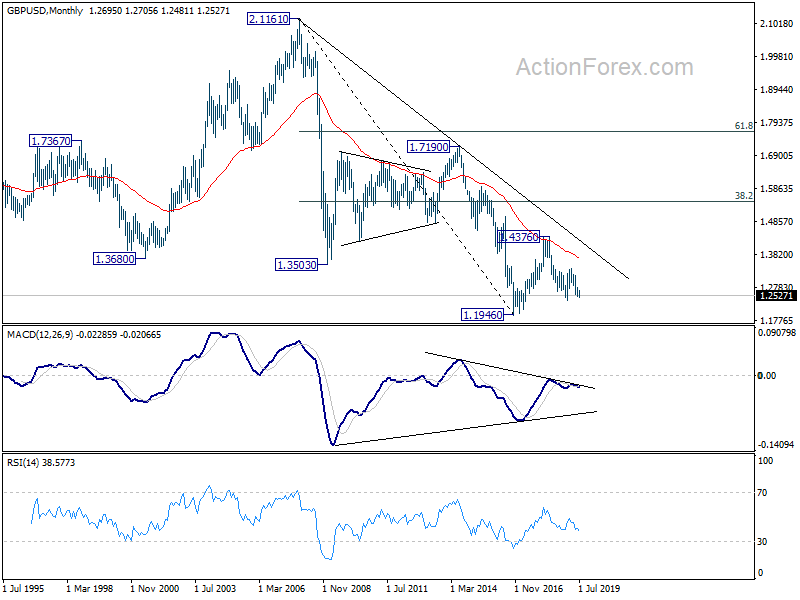
GBP/USD dropped further to as low as 1.2481 last week. Break of 1.2506 support indicate resumption of whole fall from 1.3381. The pair is also kept comfortably below falling 55 day EMA, maintaining near term bearishness. Initial stays on the downside this week for 1.2391 low. Firm break there will resume larger down trend. On the upside, above 1.2587 minor resistance will turn intraday bias neutral first. But near term outlook will stay bearish as long as 1.2783 resistance holds.
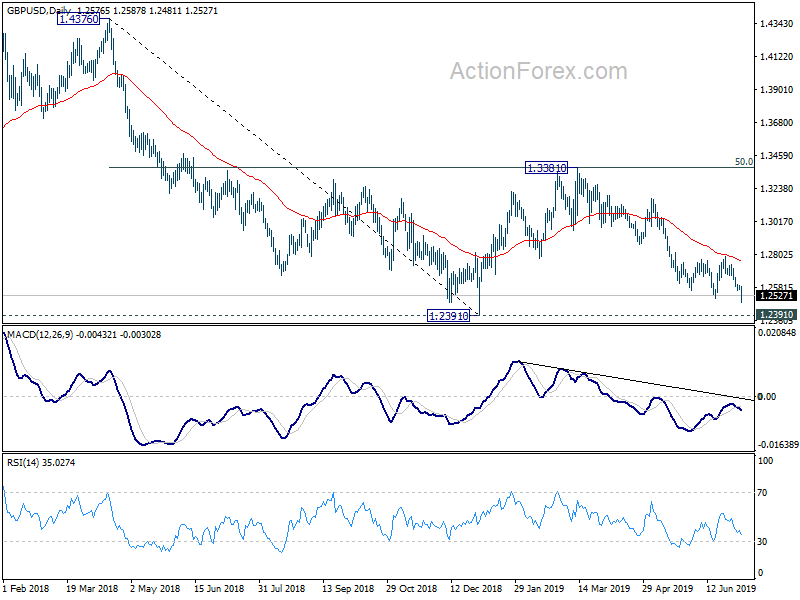
In the bigger picture, down trend from 1.4376 (2018 high) is still in progress. Break of 1.2391 would target a test on 1.1946 long term bottom (2016 low). For now, we don't expect a firm break there yet. Hence, focus will be on bottoming signal as it approaches 1.1946. In any case, medium term outlook will stay bearish as long as 1.3381 resistance holds, in case of strong rebound.
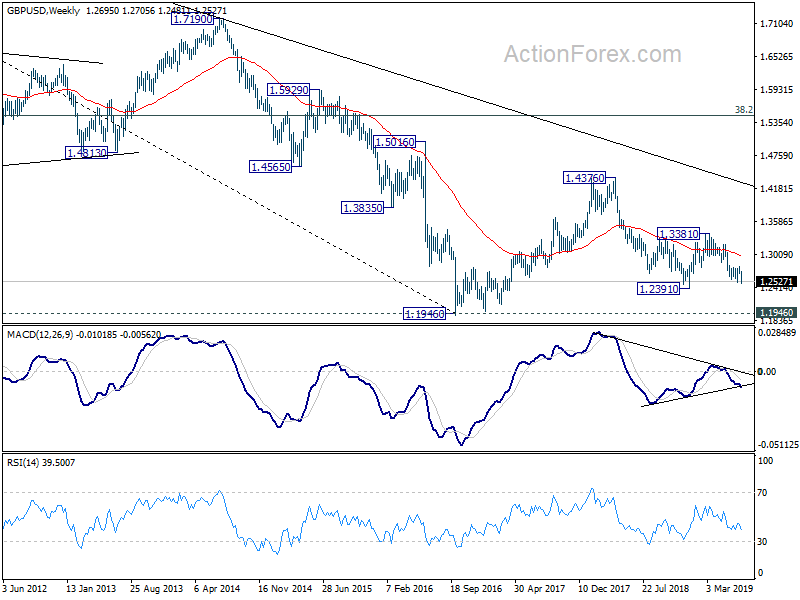
In the longer term picture, consolidative pattern from 1.1946 (2016 low) could still extend with another rising leg. But after all, decisive break of 38.2% retracement of 2.1161 (2007 high) to 1.1946 at 1.5466 is needed to indicate long term reversal. Otherwise, an eventual downside breakout will remain in favor.
Summary 7/8 – 7/12
Monday, Jul 8, 2019
[php_everywhere instance="1"]
Tuesday, Jul 9, 2019
[php_everywhere instance="2"]
Wednesday, Jul 10, 2019
[php_everywhere instance="3"]
Thursday, Jul 11, 2019
[php_everywhere instance="4"]
Friday, Jul 12, 2019
[php_everywhere instance="5"]
Weekly Economic and Financial Commentary: Economic Expansions Don’t Die of Old Age
U.S. Review
Economic Expansions Don't Die of Old Age
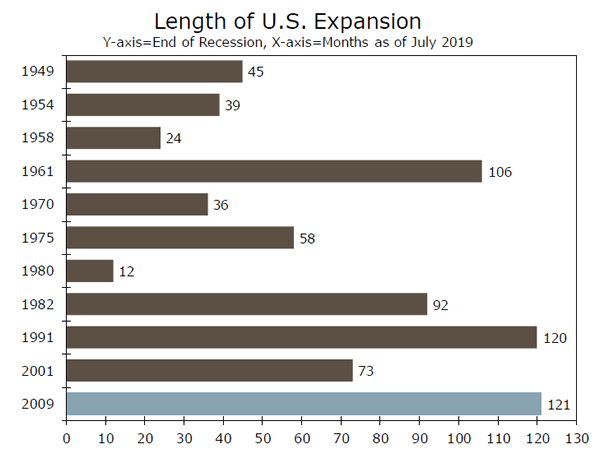
- On Monday, the current economic expansion entered its 121st month, marking the longest expansion in modern American history.
- Despite caution that has accompanied the longevity of this expansion, recent data indicate a moderating rather than a contracting economy.
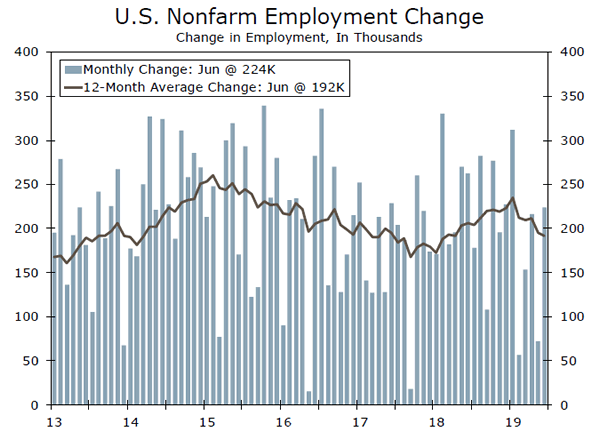
- Employers added 224,000 jobs in June, and the unemployment rate rose to 3.7%. Survey results from the manufacturing and service sector were mixed, but suggest some further slowing this year.
Economic Expansions Don't Die of Old Age
On Monday, the current economic expansion entered its 121st month, marking the longest uninterrupted expansion in modern American history. The sheer age of the expansion has caused heightened speculation in recent months of when the next downturn will transpire. But, economic expansions do not simply 'die of old age'. Expansions expire due to a policy misstep or when a growing imbalance in the economy finally surfaces.
Despite the caution that has accompanied the longevity of the expansion, recent data indicate a moderating rather than a contracting economy. This morning we learned employers added 224K jobs in June. That pushed the three-month average up to 171K, but the 172K average over the first six months of this years is down fairly substantially from the 211K average the prior six months. The unemployment rate edged back up to 3.7%, and wage growth came in a touch weaker than expected at 0.2% (3.1% on a year-ago basis). Factory activity continues to struggle due to tariffs. Although the ISM manufacturing index held up better than expected in June at 51.7, the new orders component of the index barely skirted a contractionary print and, at 50.0, hit a three-anda- half-year low. The services sector, on the other hand, has been more resilient to trade uncertainty. The ISM non-manufacturing index remained firmly in expansionary territory, though concern specifically regarding tariffs was noted by respondents.
Further escalation in the trade war with China looks less likely after the meeting between Presidents Trump and Xi at the G20. But we still suspect a complete resolution with China is likely some ways off. Therefore, while businesses' fears about an imminent all-out trade war have been allayed, uncertainty about the structure of future trading relations continues to linger and will likely weigh on business spending this year.
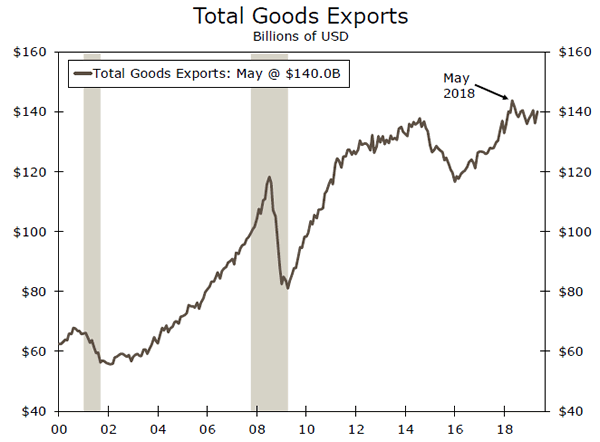
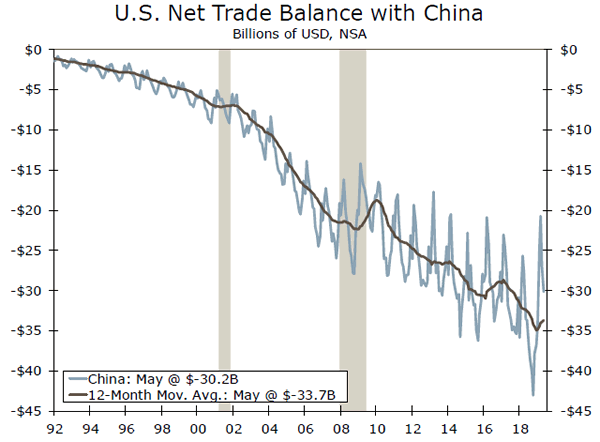
Trade is also taking a hit. Trade data through May show goods exports have yet to return to their peak which occurred in May 2018—the month before the steel and aluminum tariffs went into effect and the trade war began in earnest. Tariffs have not reduced overall imports, nor have they made a dent in the overall trade deficit, which has widened 27.7% since the start of 2017. Instead, domestic importers may be re-routing foreign supply chains. See Topic of The Week on Page 7 for more detail.
Fed Chair Powell will testify before the Senate Banking Committee on Thursday, and FOMC members Williams, Bostic, Barkin and Kashari are also set to speak at other engagements. Market participants are likely to listen for Fed speakers to telegraph how recent data are impacting the policy outlook. Financial markets have already priced in 100% probability that the Fed will cut rates at the end of the month. On this assumption, financial markets have soared with the S&P 500 and Dow Jones Industrial Average both reaching all-time highs this week. While we also look for the Fed to cut rates 25 bps on July 31, rather than viewing this as a turn to easing to stave off an imminent downturn, we view the Fed taking an "insurance" cut to, in part, get ahead of a true deceleration. While economic expansions don't die of old age, they don't last forever. This one still looks to have some room to run.
U.S. Outlook
Consumer Credit • Monday
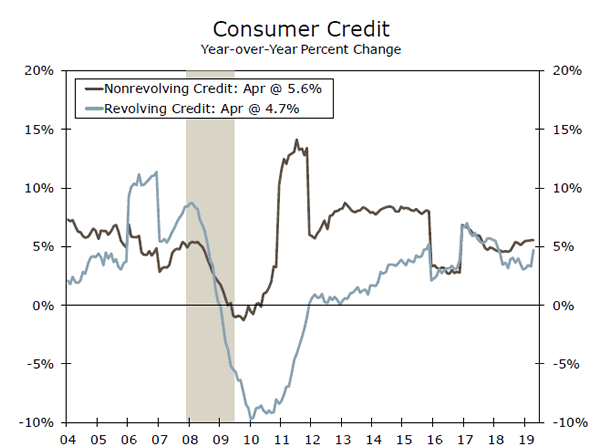
Consumer debt (excluding mortgages) increased by the most in five months in April, suggesting consumers remain upbeat in regards to their spending habits despite elevated uncertainty over the outlook. Total credit expanded $17.5 billion from March, with revolving debt outstanding rising by the most since November 2018 and nonrevolving credit increasing the least since June 2018.
The strength of the labor market has underpinned the economic expansion which, in turn, has given consumers the confidence to tap credit lines. Rising incomes and solid overall economic growth have helped combat higher financing costs, as the debt service ratio remains well below its pre-recession peak. As long as the labor market remains healthy, consumer credit is likely to expand further. For May, the consensus looks for total consumer credit to expand $15.0 billion, slightly lower than its YTD average of $15.3 billion.
Previous: $17.50B Consensus: $15.00B
FOMC Meeting Minutes • Wednesday
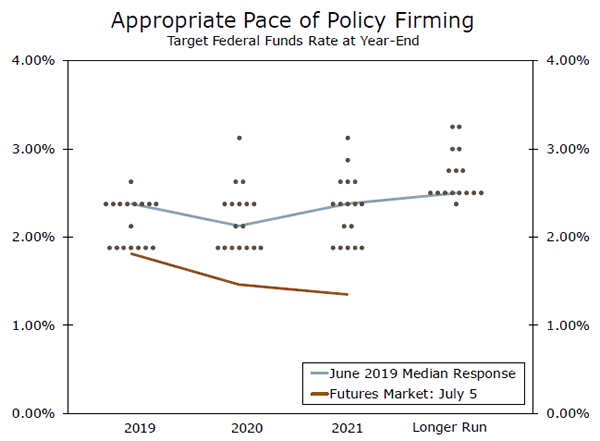
Focus on monetary policy comes front and center next week as Chair Powell delivers his semi-annual testimony before the House Financial Services Committee on Wednesday and the Senate Banking Committee on Thursday. Additionally, the minutes to the June FOMC meeting are published on Wednesday.
Keeping rates unchanged in June, the Fed clearly shifted tact and indicated they are prepared to ease monetary policy at upcoming meetings due to increased uncertainty over the outlook. We suspect Chair Powell will reiterate those same concerns to Congress, thereby keeping the door open to a rate cut at the July FOMC meeting.
In regards to the meeting minutes, interest will be high for any additional details on the balance sheet that could suggest an earlier end to tapering or further discussions on the equilibrium size and composition.
CPI • Thursday
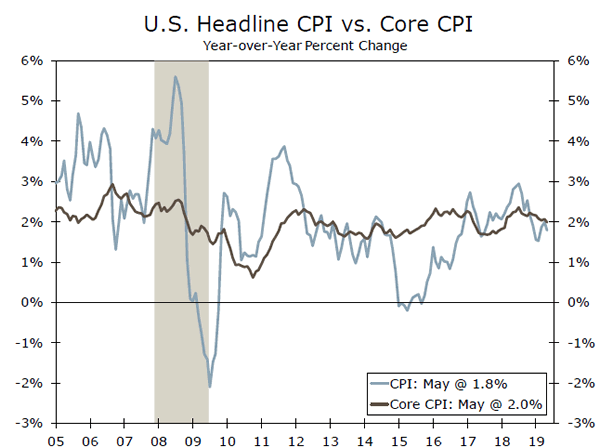
Inflation and inflation pressures remain tame as the calendar rolls into the second half of the year. In May, the headline Consumer Price Index advanced just 0.1%, with the core CPI increasing 0.1% for the fourth consecutive month.
Looking at June, we project the core CPI to rise 0.2% on the month, which, if realized, would keep the annual pace steady at 2.0%. Used motor vehicle prices, which have been a meaningful drag on core goods prices in recent months, are poised to stop deteriorating.
We do not anticipate a meaningful impact of the escalated tariffs in this month's report. Imports from China that entered the U.S. before June 15 were not subject to the additional 15% tariff rate–from 10% to 25%.
Previous: 0.1% Wells Fargo: 0.2% Consensus: 0.2% (Core CPI, Month-over-Month)
Global Review
Global Economy at Least Not Getting Worse
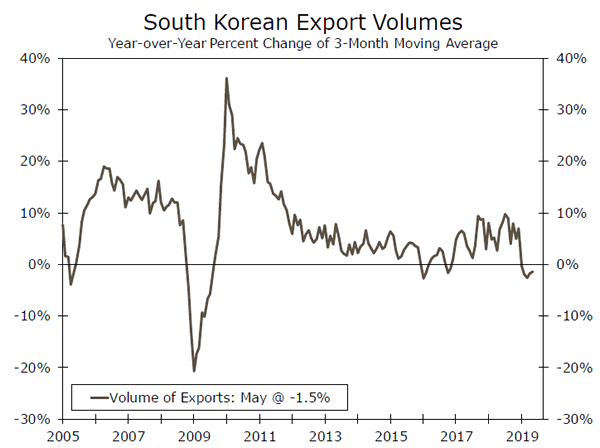
- Data released this week showed South Korean export volumes still contracting on a year-over-year basis through May, though the pace of decline appears to have leveled off.
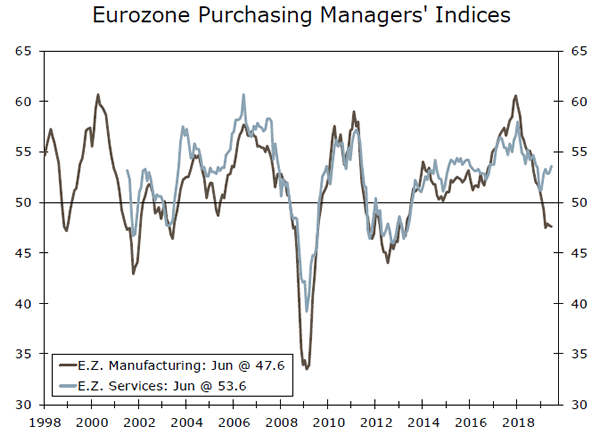
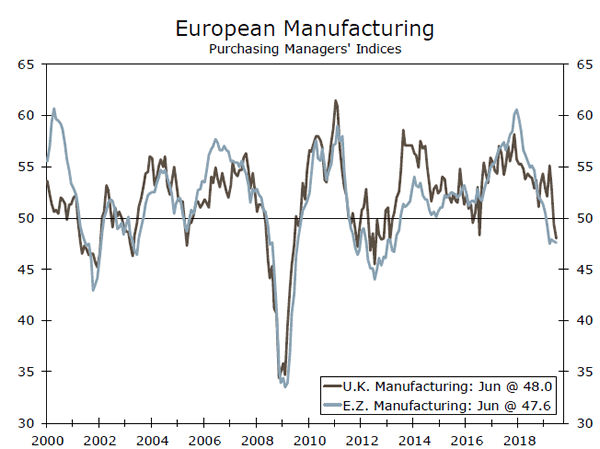
- In the United Kingdom, the manufacturing PMI fell precipitously to 48.0. In the Eurozone, the manufacturing PMI also remains below 50, but the service sector continues to show resiliency, helping to keep economic growth positive.
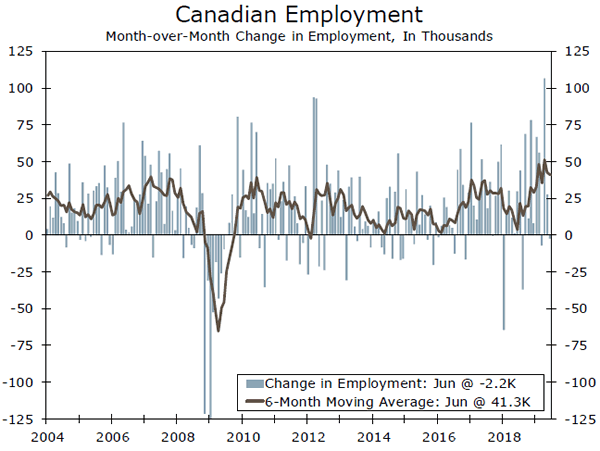
- Canadian employment growth cooled in June, but the decline was entirely concentrated in part-time employment.
Global Economy at Least Not Getting Worse
The South Korean economy is a relatively open, trade-oriented economy with close trade ties to China in particular. South Korea's exports are about 44% of its GDP, and about one quarter to a third of those exports go to China. Thus, when South Korean real export growth turned decisively negative around the turn of the year, the data raised concerns about the global economy generally and China specifically.
Data released this week still showed South Korean export volumes contracting on a year-over-year basis through May, though the pace of decline appears to have leveled off (see chart on front page). The most recent round of tariff escalation between the United States and China did not go into effect until June 1, however, which means another leg down could be in store. To that point, the Caixin China manufacturing PMI slipped back into contractionary territory this week, falling to 49.4 in June from 50.2 in May.
Manufacturing PMIs in Europe released this week were not much better. In the United Kingdom, the manufacturing PMI fell precipitously to 48.0 (more on that in the global outlook section). In the Eurozone, final PMI readings for June showed the Eurozone manufacturing sector still stuck in contractionary territory. Encouragingly, however, the service sector has remained resilient, and the European PMI for services has even risen a couple points from its recent low in December 2018 (top chart).
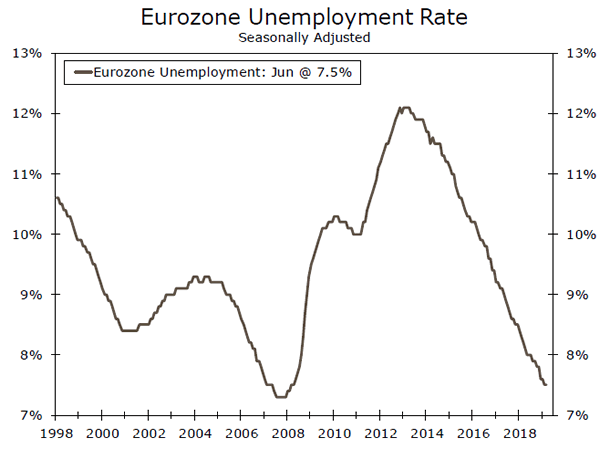
Resiliency in the larger service sector has been key to supporting growth and preventing the Eurozone from slipping into a recession. Despite the slowdown in Eurozone economic growth that has taken place over the past year, the unemployment rate has continued to fall. The Eurozone unemployment rate is down 0.8 percentage points since May 2018 and 0.4 percentage points since the end of last year (middle chart). This is not to say the nonmanufacturing sectors have been unaffected by the slowdown. Inflation-adjusted retail sales data released this week showed month-over-month sales growth contracting for the second consecutive month and decelerating to a 1.3% year-over-year gain.
Canada's labor market started the year on a tear with some of the largest job gains of the expansion (bottom chart). Data released this morning showed Canadian employment growth cooled in June, with total payrolls declining 2,200. The decline was entirely concentrated in part-time employment, however, as full-time employment rose 24,100 jobs in June. Wage growth jumped sharply in June, though some of this may have been due to a minimum wage increase in British Columbia.
Not only has full-time employment been growing at a solid rate, but the private sector has done nearly all of the heavy lifting in this recent run of job gains. On a year-over-year basis, private sector payrolls in Canada are up 354,000, or about 3%, while government employment is little changed over the past 12 months. Even in Canada, however, the global weakness in manufacturing was noticeable in this morning's data. Canadian employment in manufacturing was down 15,000 in June, the first monthly decline in nearly a year.
Global Outlook
U.K. Monthly GDP • Wednesday
Earlier this year, some analysts were surprised by the resiliency of the U.K. economy given the ongoing Brexit struggle and the general slowdown in the global economy. More recently, however, the data have started to show more signs of slowing in the United Kingdom. As mentioned in the global review section, the U.K. manufacturing PMI fell precipitously in June to 48.0, while real retail sales ex-autos and fuel declined for the second consecutive month in May.
Next week's monthly GDP release for May will offer some additional details on this slowdown, including the extent to which it has been concentrated in manufacturing. Monthly GDP declined 0.4% in April, but almost the entire decline was attributable to factory output. We believe this slowdown is, to some extent, driven by an inventory correction. We will be watching next week's data to see if the factory sector slows further and/or if the weakness spreads to the service sector of the U.K. economy.
Previous: -0.4% (Month-over-Month) Consensus: 0.3%
Bank of Canada Meeting • Wednesday
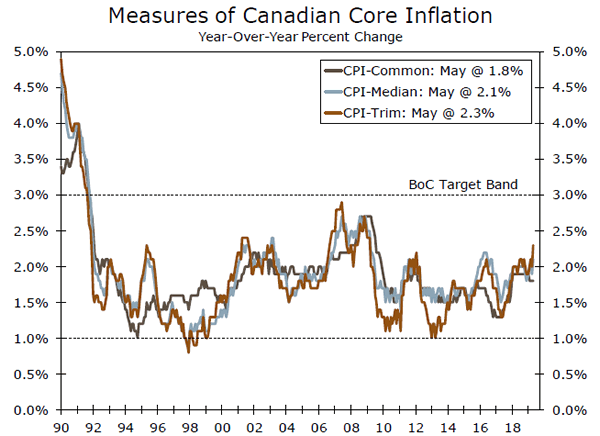
When the Bank of Canada (BoC) last met on May 29, its policy statement adopted a relatively upbeat tone. The BoC noted that "recent data have reinforced Governing Council's view that the slowdown in late 2018 and early 2019 was temporary." Employment growth has been especially strong in Canada over the past several months, both for full- and part-time workers.
In the aforementioned statement, however, the BoC qualified the line from above with "although global trade risks have increased." The day after that BoC meeting, President Trump threatened escalating tariffs on Mexico that sparked a brief but intense round of negotiations. At present, financial markets are only pricing in 22 bps of easing in Canada over the next 12 months, compared to about 90 bps in the U.S. and 120 bps in Mexico. Given the stabilizing economy, inflation near target and housing sector risks, we expect the BoC to keep policy unchanged through the end of 2020.
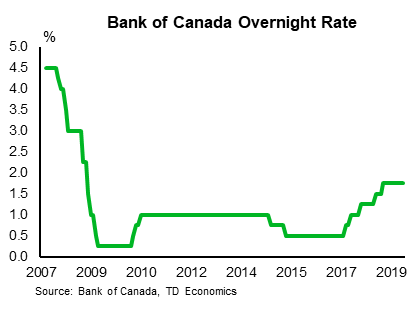
Previous: 1.75% Wells Fargo: 1.75% Consensus: 1.75%
Eurozone Industrial Production • Friday
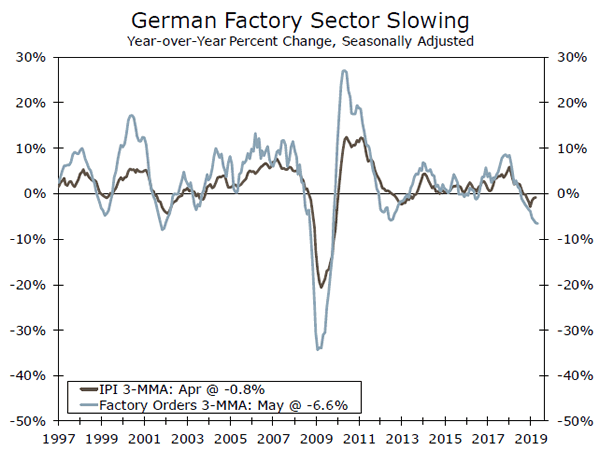
As discussed in the global review section, the slowdown in the Eurozone economy has been defined by a lagging manufacturing sector and a resilient service sector. This is perhaps best illustrated in Germany, Europe's biggest economy and manufacturing powerhouse. Factory orders in Germany are contracting at a pace not seen since the Great Recession.
The Eurozone-wide industrial production data released next week will be for May, right before another round of tariffs went into effect between the United States and China. On a year-over-year basis, industrial production was down 0.4% in April, but this small decline masks worrying trends in the details. Capital goods and durable consumer goods production were down 1.2% and 0.8%, respectively, partially made up for by growth in non-durable goods. Another decline in industrial output broadly and cyclically-sensitive sectors specifically would be a poor sign for the Eurozone economy.
Previous: -0.5% (Month-over-Month) Consensus: 0.2%
Point of View
Interest Rate Watch
Debt Ceiling Coming Into Focus
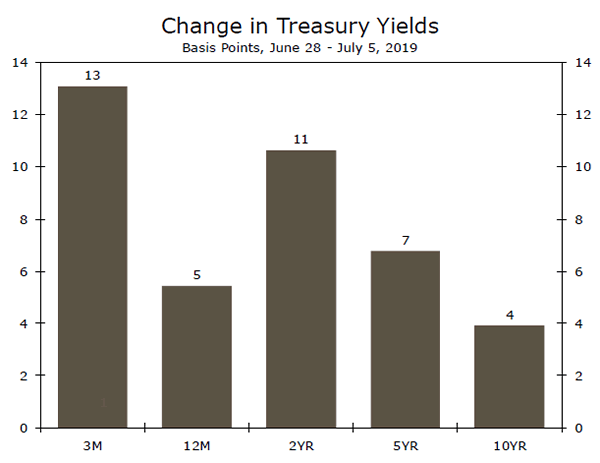
Yields on most Treasury securities were a bit higher on the week relative to their close last Friday, but the yield on the 3-month bill rose the most (top chart). Although the federal government's debt ceiling may not seem very relevant to many observers at present, it is starting to attract the attention of bond market participants.
The Treasury Department has been operating recently to keep the government under the $21.99 trillion debt ceiling, which was re-instated on March 2. Many analysts, including us, estimate that Treasury will run out of "extraordinary" measures to keep the government under the debt ceiling during the first week of October when large disbursements are scheduled to be paid.
Moreover, the federal government's fiscal year ends on September 30, and many analysts believe that a new budget will be paired with an increase in the debt ceiling. Political gridlock in Washington could threaten the ability of the Treasury Department to make payments on time. In short, the federal government could potentially default in early October if the debt ceiling is not raised. The 3-month bill that was auctioned on July 1 will mature in early October, and payment could be delayed if the debt ceiling is not raised.
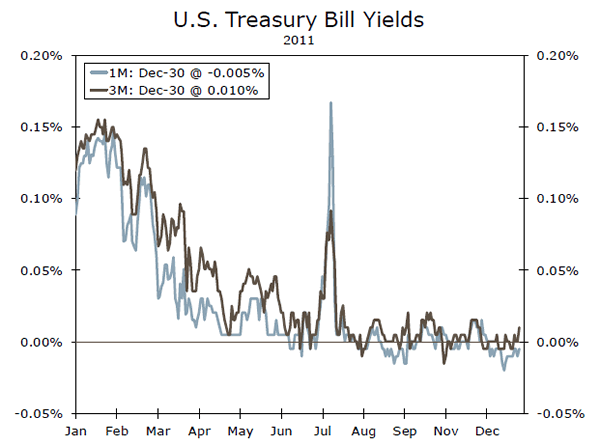
A similar phenomenon occurred in the summer of 2011 when the federal government came perilously close to defaulting on its debt. The yield on the 3-month Treasury bill rose nearly 10 bps in July 2011 (middle chart). The rate on the 1-month bill spiked more than 15 bps.
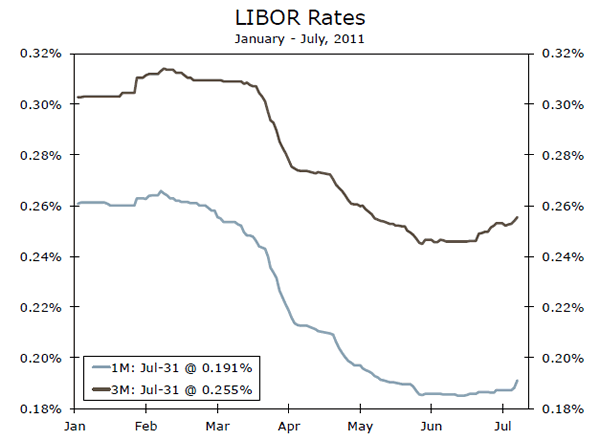
Unless the government actually defaults on its debt, most businesses likely won't be affected by developments in the Treasury market. 1-month and 3-month LIBOR, which are relevant for most businesses, edged higher in July 2011 but largely because the market was starting to price in some Fed tightening, which ultimately did not occur (bottom chart). Likewise, LIBOR was largely unchanged this week despite the rise in bill rates. That said, a default by the federal government, should one occur, would impart significant volatility into financial markets. Stay tuned.
Credit Market Insights
Credit Index Remains in Expansion
Credit conditions eased slightly in June, yet remained solidly in expansion territory, according to the National Association of Credit Management's Credit Managers' Index (CMI). The CMI is a representative survey of 1,000 trade credit managers nationwide, and is broken down by sector with subindices for both manufacturing and services credit markets. The headline index fell to 55.0 from 55.7, but as it is a diffusion index, any reading above 50 indicates an improvement in credit conditions. Still, one year ago the CMI was sitting at 56.3. The dip in the index bears watching, but on the whole it has deteriorated less than other measures, including the ISM manufacturing and services surveys. Over the past year, the CMI has had six monthly increases and six monthly declines, likely as credit managers digested a steady stream of trade rumors, threats and new deals. Indeed, the manufacturing CMI has fared worse, declining six of the past nine months to 54.9 in June. Yet this still remains in expansion, with NACM noting that "the worries that have affected the industrial community have not sent the manufacturing economy into a tailspin." The flow of credit, a leading indicator of real activity across the economy, appears at least for now to be sufficiently resilient. Moreover, with the Fed poised to cut rates later this month, lending should get another boost as the cost of borrowing falls. A more pronounced slowdown in measures such as the CMI is precisely what the Fed would like to avoid as it aims to "sustain the economic expansion."
Topic of the Week
Countries that Profit from the Trade War
This week, we took a look at how the trade war has impacted U.S. trade and which economies have benefitted from the U.S.-China trade war. It is early days yet, but not too early to glean some insights. In 2017, the three biggest U.S. import categories from China were computers, electronics and machinery & other manufacturing. We analyzed U.S. trade data to identify countries from which the United States sources goods for those categories to determine which foreign economies have benefitted most from the tariffs. While the trade report this week brought data through May, our conclusions remain the same. The winners vary by industry, but the key benefactors appear to be Vietnam, Mexico and the Eurozone.
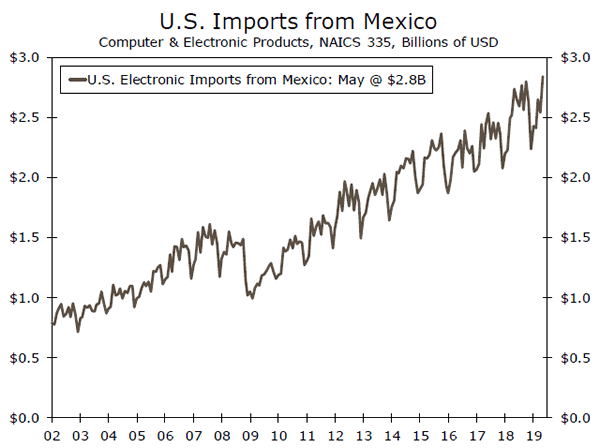
In 2017, the computer and peripheral equipment category accounted for more than a third of all imports from China. As supply chains shift, what foreign economies are taking up the slack? Vietnam more than doubled its share of U.S. computer imports to 5.7% in the first five months of 2019. The net increase of 2.8 percentage points was the largest pick-up of any country. The next category, electrical products, includes a number of consumer durable goods as well as smaller household appliances. When we look at how importers are shifting supply chains for this category, we find that Mexico is the largest beneficiary. Our third and final category combines miscellaneous manufacturing with the much larger equipment manufacturing. Mexico, the Eurozone and Japan are the key benefactors here through May.
Ultimately, the United States has imported less from China in the first five months of this year, but is not importing less overall. With no demonstrable evidence that U.S. domestic production is making up for the drop in Chinese goods imports, the trade data tell us where U.S. importers are turning. Perhaps the larger point here is rather than spurring domestic production, the tariffs are instead shifting global supply chains to other foreign trading partners.
The Weekly Bottom Line: Canada’s Q2 Defying Global Headwinds
U.S. Highlights
- News of a trade truce between the U.S. and China buoyed equity markets at the start of the week. The ceasefire put additional tariffs on hold, and there were some modest concessions on both sides.
- On the economic front, messages were decidedly mixed this week. The ISM manufacturing and non-manufacturing indexes moved lower in June, while the payroll report showed a reacceleration in hiring with 224k jobs created last month.
- Given the balance of risks, there is still a solid case for a 25- basis point "insurance" cut when the Fed meets later this month. But, insurance is likely to mean one or two rate cuts this year and not four or five as markets are pricing.
Canadian Highlights
- Financial markets were relatively quiet this week. The S&P/TSX posted a modest gain, whereas OPEC+ announced an extension of the group's oil supply cuts.
- Grabbing the bulk of the attention this week was a surprise trade surplus in May due to an impressive surge in exports.
- The shortened week also saw a decent Labour Force Survey for June, with the headline print remaining flat but the details of the report further supporting the narrative of healthy labour markets.
U.S. - Markets Celebrate The U.S.-China Trade Truce
News of a trade truce between the U.S. and China kicked off this holiday-shortened week. The ceasefire puts additional tariffs on hold. There were some modest concessions on both sides. The U.S. will allow American companies to continue selling equipment to Huawei (although specifics are still pending), while China will buy more American agricultural goods. The outcome was broadly in line with analyst expectations, but still positive enough to bouy equity markets, especially in sectors such as semiconductors hit by trade uncertainty. On Wednesday, the S&P 500 reached an all-time high.
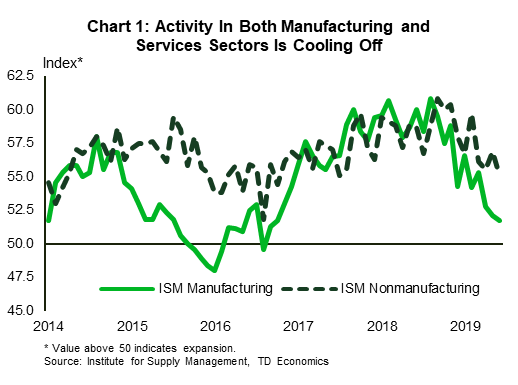
On the economic front, messages in this week's data releases were decidedly mixed. The ISM manufacturing and non-manufacturing indexes moved lower in June and are significantly below year-ago levels. Still, both remain in expansionary territory, implying slower, but not negative economic growth (Chart 1). More concerning is that the greatest weakness was in the forward-looking indicators. The new orders subcomponent narrowly avoided contraction in June, while pending orders have already slipped below the 50-point threshold.
It is not surprising that activity is slowing from its 3%-plus, stimulus-fueled pace of a year ago, but it makes reading the economic tea leaves more difficult. It is hard to know in real time if the economy is returning to a healthy trend-like pace or pushing past it into a slump. Tariffs and trade uncertainty further cloud the mix, and signs globally point to a less benign slowdown.
America's saving grace may be that a large share of its economy is relatively shielded from global events. Still, while its service sector is less impacted by trade, it has not been spared entirely. Indeed, comments from non-manufacturing survey respondents highlighted concerns about tariffs in several industries, including construction, retail trade, health care & social assistance and professional and technical services.
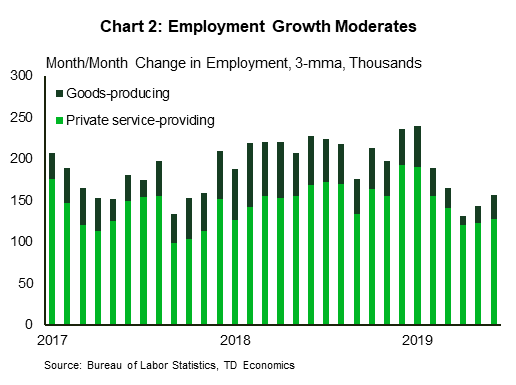
The best evidence that the American economy is headed for a soft landing is the continued resilience in the labor market. That had been brought into question with the May payroll report (job growth slowed to just 72k), but doubts were assuaged with this week's report showing a reacceleration to 224k in June. The only fly in the ointment was that there were no signs of faster wage growth. Instead average hourly wage growth remained unchanged at 3.1% for the third consecutive month.
Given the balance of risks, there is still a solid case for a 25- basis point "insurance" cut when the Fed meets later this month. But, as long as signs point to continued, albeit slower, economic growth, insurance is likely to mean one or two rate cuts and not four or five as financial markets are currently pricing. Fed speeches over the next two weeks will be key in communicating this to the public and financial market participants.
Canada - Canada's Q2 Defying Global Headwinds
Financial markets were relatively quiet this week. The S&P/TSX Composite followed its global peers higher, recording a modest 0.7% gain (as of writing). Sentiment was lifted by a positive conclusion to the G20 meeting and expectations of more stimulus forthcoming by the ECB this September. Meanwhile, the decision by OPEC+ to extend supply cuts for nine months was met with a subdued market reaction. In fact, oil prices fell on the week, as markets weighed weak global manufacturing and PMI data that bodes poorly for oil demand growth against an OPEC+ decision that was largely priced in.
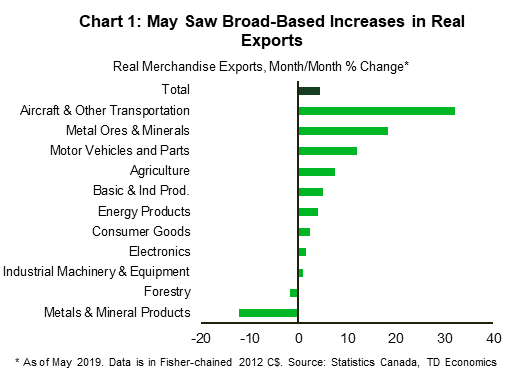
Kicking off the Canadian data release schedule was a surprise trade surplus for May, driven by a spike in exports. Part of the 4.6% surge in exports should be discounted given transitory factors. These include a resumption of activity following temporary disruptions in motor vehicle plants and a surge in the volatile aircraft category. Still, the details of the report were unambiguously positive, with 9 of the 11 product groups recording increases in both nominal and real terms (Chart 1).
The week also saw some regional housing data releases, which, while mixed, should not change the narrative of stabilizing housing markets. Preliminary data suggests that existing home sales advanced in Toronto for the fourth consecutive month. Pullbacks occurred in Vancouver and Calgary, but these followed outsized increases in the prior month.
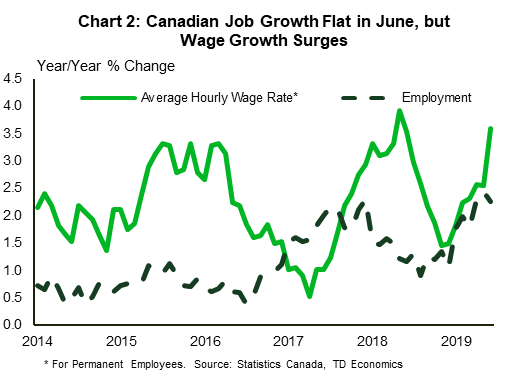
Capping this week's data calendar was a decent labour force survey report for June. Net job gains were flat on the month, but the details of the report further confirm that the Canadian labour market has been firing on all cylinders. Full-time jobs advanced by a healthy 24k in June, but the highlights of the report were a 3.6% increase in year-over-year wage growth for permanent employees (Chart 2) and a surge in full-time hiring in Alberta (+37k).
This run of positive data surprises stands in contrast to ongoing deceleration in economic momentum abroad. Taken together, recent releases are pointing to some upside to our already-strong second quarter tracking and the Bank of Canada's very cautious 1.3% forecast. And, with core and headline inflation measures also running slightly above target and wage growth finally picking up, this further justifies our expectation that the Bank of Canada is likely to leave its policy rate unchanged at 1.75% next week.
Of course, some moderation in growth is to be expected in the next few quarters as trade uncertainty and weaker foreign demand act as headwinds to export demand and manufacturing activity. Nevertheless, policy rates in Canada are likely to remain unchanged this year. Financial stability concerns related to elevated household debt levels temper the better-than-expected economic momentum. This sets up the case for divergence between the Federal Reserve's and the Bank of Canada's monetary policy paths as the most likely outcome later this year.
U.S.: Upcoming Key Economic Releases
U.S. Consumer Price Index - June
Release Date: July 11, 2019
Previous Result: 0.1% m/m, core 0.1% m/m
TD Forecast: 0.0% m/m, core 0.2% m/m
Consensus: 0.1% m/m, core 0.2% m/m
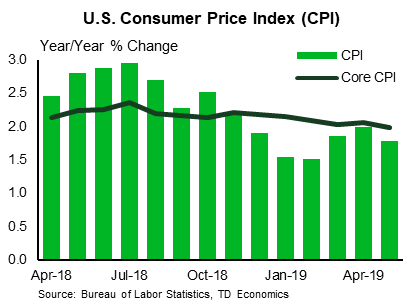
We look for headline CPI to slow a further two tenths to 1.6% y/y in June on the back of a flat monthly print, as negative non-core inflation will be balanced by firm underlying price gains. We expect the former to be driven by price declines in the energy segment on the back of a 5% m/m drop in gasoline prices. Core inflation, on the other hand, should remain steady at 2.0% y/y, reflecting a firm 0.2% m/m advance. Core prices should be supported by a 0.2% m/m increase in core services inflation, which we expect to be also aided by a flat showing in core goods – it has declined in the prior four months. We anticipate OER to remain largely steady at 0.3% m/m and for the ex-shelter segment to slow marginally on a monthly basis.
Canada: Upcoming Key Economic Releases
Canadian Housing Starts - June
Release Date: July 9, 2019
Previous Result: 202k
TD Forecast: 210k
Consensus: 209k
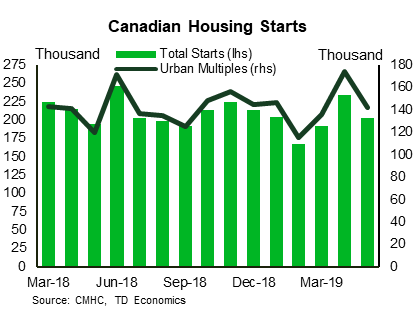
Housing starts are forecast to recover to an annualized 210k in June on a partial rebound in multi-unit construction. Apartments and other multi-unit projects were the main drivers behind the May slowdown and continued strength in permit issuance suggests this pullback will be short-lived. Permits for multi-dwelling buildings rose by 40% to a (non-annualized) 18.3k in April, the last month available, which stands as a new record for monthly issuance. While permits are just as volatile as starts, the trend still points continued sustained strength in residential construction despite moderating demand in certain regions.
Bank of Canada Rate Decision
Release Date: July 10, 2019
Previous Result: 1.75%
TD Forecast: 1.75%
Consensus: 1.75%
TD looks for the Bank keep rates unchanged at 1.75% in July and provide limited guidance as it awaits more clarity surrounding the global outlook. Since December, the Bank has been primarily focused on housing, energy markets and global trade, and we have seen a number of conflicting developments to global trade tensions since the April MPR (US/China escalation vs steel/aluminum tariffs removal). The Bank has also signaled it is keenly focused on incoming data, which has surprised materially to the upside since April and pushed Q2 tracking towards 3%, well above official estimates. All this suggests the BoC is in no rush to follow G10 central banks lower, and will require more time to assess global trade conditions and their impact on growth before shifting from the current policy stance.