Sample Category Title
USDCHF Faces Additional Price Strength On Rally
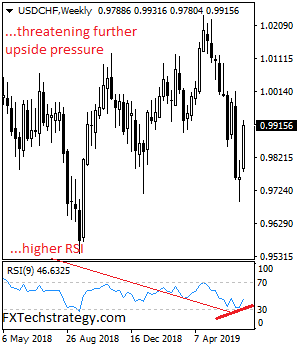
USDCHF faces additional price strength on rally as we enter a new week. Resistance resides at the 0.9950 level. Above here, resistance lies at the 1.0000 level and then the 1.0050 level. Further out, resistance comes in at the 1.0100 level. Its weekly RSI is bullish and pointing higher suggesting further strength. On the downside, support is seen at the 0.9850 level with a turn below here opening the door for more decline towards the 0.9800 level. And then the 0.9750 level. Further down, support resides at the 0.9700 level. All in all, USDCHF remains biased to the upside on further correction.
BoJ Kuroda: Will make necessary policy adjustments to sustain the economy’s momentum
BoJ Governor Haruhiko Kuroda told the central bank's regional branch managers that inflation is still expected to pick up gradually to 2% target. The economy is expected to continue expanding moderately as a trend, even though it's affected by overseas slowdown. But still, BoJ would maintain easing for as long as needed to hit stable target.
Kuroda reiterated that short- and long-term interest rate will be kept at current very low levels for extended period, "at least through around spring 2020". Also, monetary base will continue to expand, and QQE will be maintained under the yield curve control framework.
Also, Kuroda pledged that "the BOJ will make necessary policy adjustments to sustain the economy's momentum towards achieving its inflation target."
ECB Villeroy: Economic signals continuing slowdown, but also significant wage increase and job creation
ECB Governor Council member François Villeroy de Galhau hinted that the central bank could launch fresh stimulus before IMF Managing Director Christine Lagarde takes over Mario Draghi's job as ECB President. He noted that "If we speak about monetary policy we have several Governing Councils to come, in the next month, including with Mario Draghi. And if and when needed, there must be no doubt about our determination to act and our capacity to act."
Villeroy said policymakers look at the market, but emphasized "we are not market dependent, we are data dependent". And, "if we look at the economic signals there is a continuing slowdown but there also significant wage increases ... significant job creation on both sides of the Atlantic. So let us wait for our next Governing Council, and there are several to come, to assess the data and then to decide."
Meanwhile, he also pointed to trade tensions as the biggest uncertainty and threat to the global economy. However, "it's up to political leaders to reduce these uncertainties, which are sometimes self created. We cannot compensate for trade tensions."
Eco Data 7/8/19
[php_everywhere instance="1"]
Forex Forecast and Cryptocurrencies Forecast
First, a review of last week's events:
EUR/USD. As forecasted, the meeting of US President Donald Trump with PRC President Xi Jinping on the final day of the Osaka summit did not put an end to the trade war. The leaders were able to agree only on a respite in the hostilities and the resumption of trade and economic consultations. However, this result was perceived by the market with moderate optimism. The dollar was strengthening its positions for the whole day of Monday, having dropped the pair almost 100 points. This was followed by a long lull, which could only be broken by the publication of data from the US labor market on Friday. The number of new jobs created outside the agricultural sector (NFP) increased more than three times in June compared with May (from 72K to 224K), which allowed the dollar to press the euro further. The pair almost reached the level of 1.1200, after which a small rebound followed, and it ended the trading session at 1.1225;
GBP/USD. The main candidate for the post of British Prime Minister, Boris Johnson, continues to play the role of "horror" for markets. Johnson's statements regarding the possibility of a "hard" Brexit, without a deal, put pressure on the pound, dropping its quotes to the levels of the end of 2016 - beginning of 2017. It is natural that the positive statistics from the American labor market influenced the dynamics of the pair as well. As a result, the forecast that had been given by most experts last week turned out to be correct. As expected, the pair recorded a local low in the 1.2480 zone, after which it climbed 45 points, where it met the end of the working five-day session;
USD/JPY. Recall that a clear forecast for this pair could not be formed a week ago.40% of the experts had voted for the strengthening of the Japanese currency and the movement of the pair to the south. Another 30% turned their looks to the north, while the rest of the analysts just shrugged shoulders. As a result, they were all right: the pair dropped to the level of 107.52 by the middle of the week, and then turned up and on Friday, July 5, it returned to the highs of Monday, July 01. Thus, the dollar was able to win back only about 55 points from the yen in five days, practically keeping within the boundaries of the side corridor of the first half of this June;
Cryptocurrencies. The BTC/USD updated the two-week low last Tuesday, dropping to $9.725. That is, after an explosive growth of 155% in May-June, Bitcoin lost almost half of what it earned in these two months in just seven days, from June 26 to July 2. There is nothing surprising in this cryptocurrency volatility. And many experts talk about possible corrections of 30% and even 50%. But is it possible to call such fluctuations a "correction"?
After the fall, Bitcoin turned around and somewhat regained its position, rising to $11,100 by the evening of Friday July 5th. Ethereum (ETH/USD), Ripple (XRP/USD) and Litecoin (LTC/USD), following the benchmark coin, showed similar ups and downs. On average, the weekly range of fluctuations of coins was from 17% to 23%.
As for the forecast for the coming week, summarizing the opinions of a number of analysts, as well as forecasts made on the basis of a variety of methods of technical and graphical analysis, we can say the following:
EUR/USD. Market reacted with great attention to the June data on employment in the US. According to many experts, they may influence the decision of the Fed regarding the interest rate reduction. According to forecasts, this could happen at the meeting of the Federal Reserve on July 31. A low NFP would seriously increase the likelihood of a rate cut by 25 or even 50 basis points. But, as mentioned above, NFP has grown more than 3 times. It turns out that the situation in the US economy is not so critical. So why then pursue a policy of easing and give away cheap money?
Investors will try to hear the answer to this question from the speeches of Fed Chairman J.Powell on July 09, 10 and 11, as well as read in the lines of the minutes of the Fed meeting on Wednesday July 10.
The ECB meeting will take place this Wednesday. Markets are also expecting additional measures to stimulate the EU economy from the European regulator. Hour X is scheduled for July 25.
In whose direction the scales will swing is not yet clear. The easing of the monetary policy by the Fed may weaken the dollar. A similar easing by the ECB will push the euro down. And it can happen at the same time. Just one observation: the yield of 30-year German government bonds showed a decrease, up to a base point, which coincided with the dynamics of the yield of 30-year US bonds.
By the way, couple of words about Germany. This country will publish a number of macroeconomic data on Monday, July 8, including statistics on the trade balance for May. According to forecasts, it may be positive, which will somewhat strengthen the position of the euro.
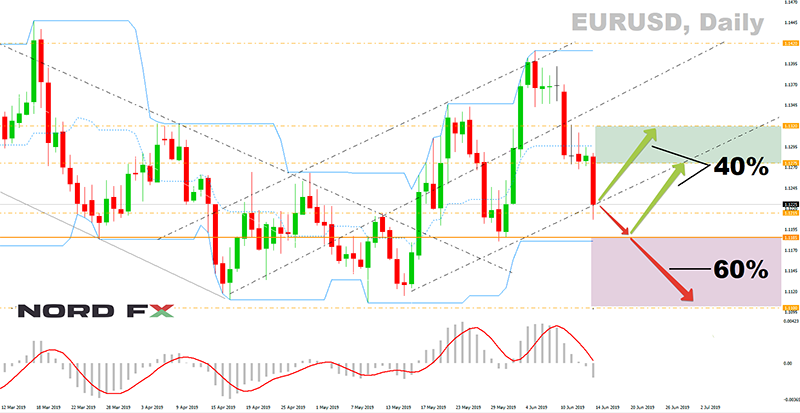
However, despite this, 60% of experts believe that the pair has not yet reached the local bottom and expect to see it in the zone of 1.1100-1.1185. 90% of trend indicators and 80% of oscillators on H4 and D 1 agree with them. As for the remaining 40% of analysts, in their opinion, the pair will not be able to break through support in the 1.1185 zone and will return to 1.1275-1.1320. The next targets are 1.1350 and 1.1400. It should be noted that in the transition from the weekly to monthly forecast, the number of bull supporters among experts increases from 40% to 65%. They are supported by 20% of the oscillators that are now in the oversold zone;
GBP/USD. Despite statements by the head of the Bank of England Mark Carney, most experts believe that neither on August 1, nor even on September 19 will interest rates on the pound be reduced. Hope on the "soft" Brexit does not fade. This provides a support to the British currency, although minor. Another positive factor for the pound is that this currency has now reached the zone of a three-week low. That is why 60% of experts expect the pair to rebound up and keep in the range of 1.125 0-1.2750. The nearest resistance levels are 1.2570 and 1.2700.
Supported by the graphical analysis on D1, 40% of analysts adhere to the opposite point of view, according to which the pair should fall to the lows of December 2018 - January 2019, to the zone 1.2405-1.2475.
As for the indicators, the vast majority of them are red on both H4 and D1. However, already about 15% of oscillators signal the pair is oversold;
USD/JPY. Interest in the yen is weakening against the backdrop of the strengthening dollar and the growing attractiveness of risky assets. But it is only 40% of analysts who expect that the pair will be able to overcome resistance in the area of 108.50-108.80 and rise to the echelon of 109.00-109.60. The remaining 60% of experts believe that the pair will move for some time in the side channel 107.55-108.50, attempting to break through its lower boundary, and, if successful, can sink to the horizon 106.75. 15% of oscillators on H4 and D1, which are in the overbought zone, signal about the possible movement of the pair downwards;
Cryptocurrencies. In general, the news background is positive for the crypto market. Bitcoin and other cryptocurrencies continue to attract major experienced investors. For example, according to Bloomberg, the billionaire from the "old guard", 75-year-old Henry R. Kravis, could not resist either and has recently become an investor in the cryptocurrency fund of ParaFi Capital. Interest in Bitcoin has peaked in the past 17 months. The subject has bypassed by the number of requests in Google Donald Trump and Kim Kardashian, who previously occupied the first and second places. Even the Chinese authorities have changed their attitude to cryptocurrencies. In the report of the official information agency of the country, Xinhua, bitcoin was called an asset that has the characteristics of an ideal "safe haven" for investors.
The optimistic forecast remains the same: $50-100 thousand per BTC coin in the next one and a half years. At the same time, "correction" drop downs are possible, reaching 50 percent or more. In the meantime, 30% of experts say that the BTC/USD pair may drop to support $9,200, 40% expect it to rise to a height of $14,000, and 30% talk about lateral movement in the channel $9,725-12,200.
EUR/USD Weekly Outlook
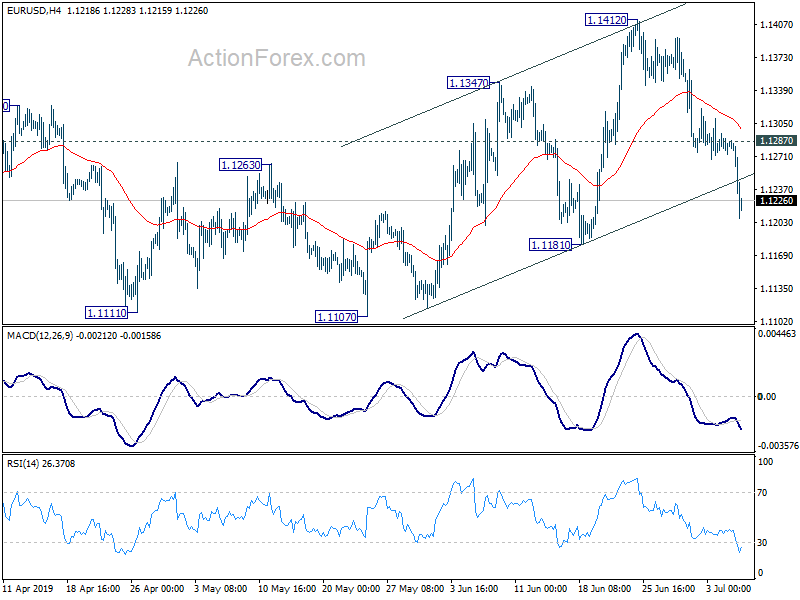
EUR/USD's sharp fall last week argues that corrective recovery from 1.1107 has completed way earlier than expected at 1.1412. Initial bias stays on the downside this week for 1.1181 support. Firm break will confirm this case and target retest of 1.1107 low. On the upside, above 1.1287 minor resistance will turn intraday bias back to the upside for 1.1412 instead.
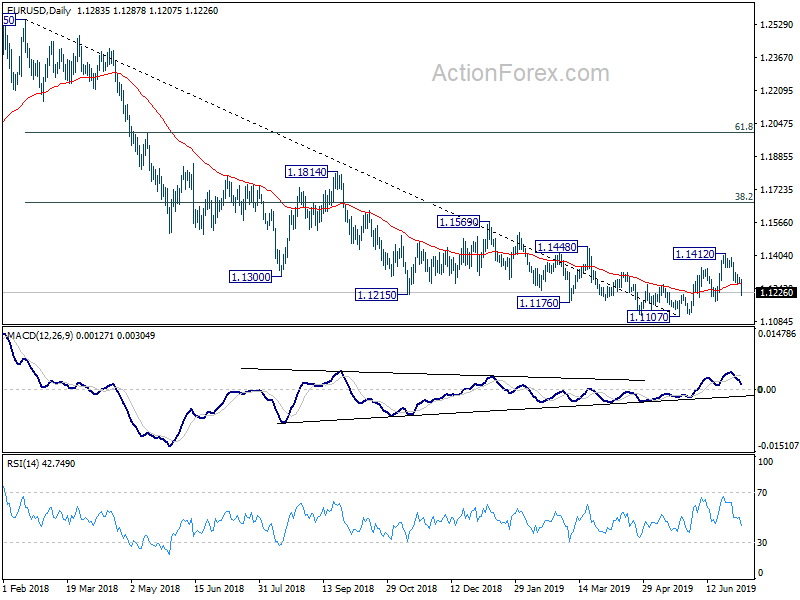
In the bigger picture, bullish convergence condition in daily and weekly MACD suggests that 1.1107 is a medium term bottom. However, rejection by 55 EMA retains medium term bearish. Outlook will be neutral for now. On the downside, break of 1.1107 will resume the down trend from 1.2555 (2018 high) to 78.6% retracement of 1.0339 to 1.2555 at 1.0813. Meanwhile, break of 1.1412 will resume the rebound to 38.2% retracement of 1.2555 to 1.1107 at 1.1660
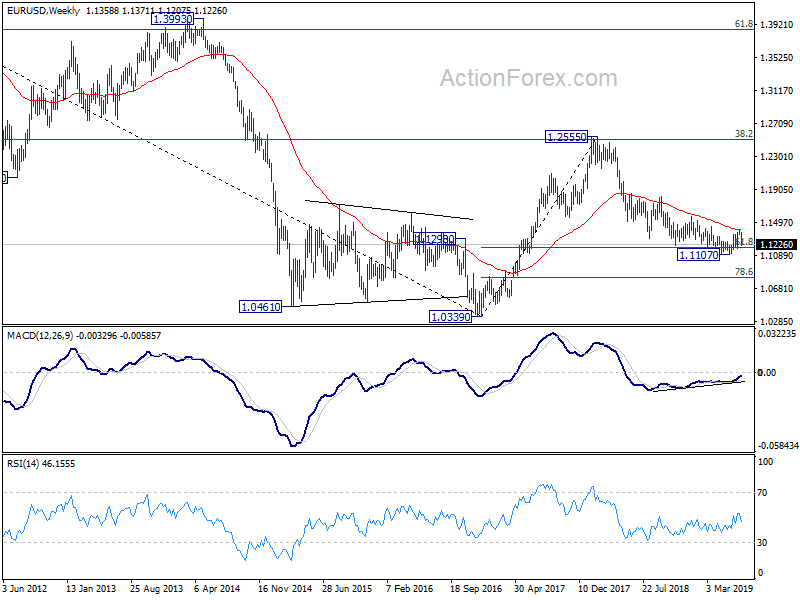
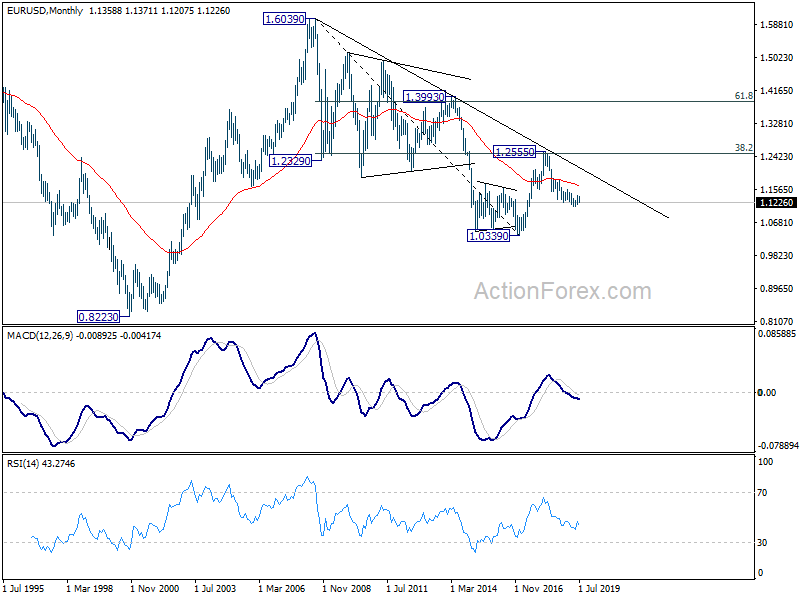
In the long term picture, outlook remains bearish for now. EUR/USD is held below decade long trend line that started from 1.6039 (2008 high). It was also rejected by 38.2% retracement of 1.6039 to 1.0339 at 1.2516 before. A break of 1.0039 low will remain in favor as long as 55 month EMA (now at 1.1658) holds).
USD/JPY Weekly Outlook
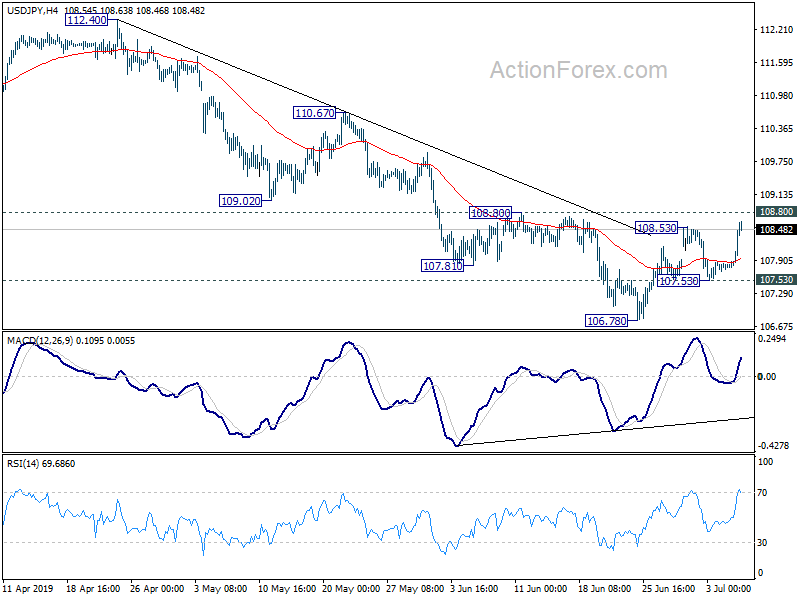
After dipping to 107.53 last week, USD/JPY took a u-turn to resume the rebound from 106.78 through 108.53. Initial focus is now on 108.80 resistance this week. Firm break there will confirm short term bottoming at 106.78. Further rise should then been seen to 110.67 resistance next. On the downside, break of 107.53 will turn bias to the downside for retesting 106.78 low.
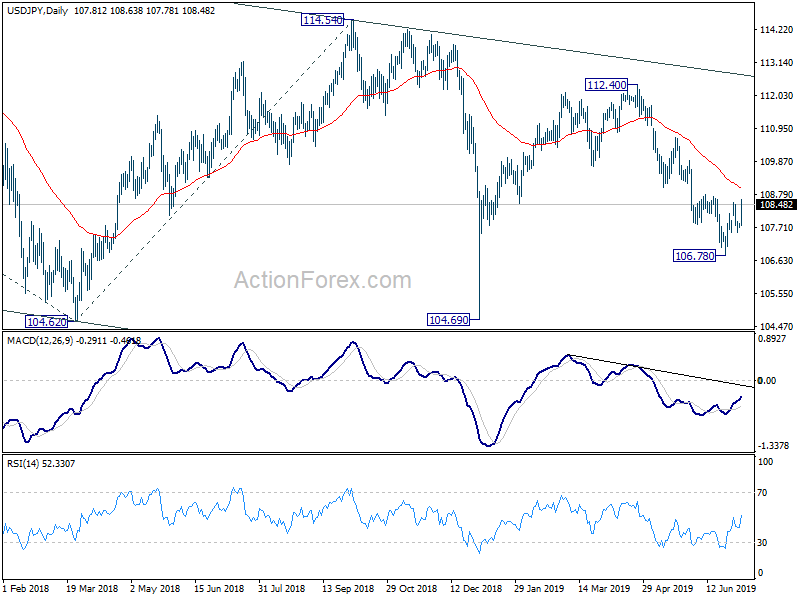
In the bigger picture, decline from 118.65 (Dec 2016) is still in progress, with the pair staying inside long term falling channel. Break of 104.62 will target 100% projection of 118.65 to 104.62 from 114.54 at 100.51. For now, we'd expect strong support above 98.97 (2016 low) to contain downside to bring rebound. In any case, break of 112.40 is needed to the first serious sign of medium term bullishness. Otherwise, further decline will remain in favor in case of rebound.
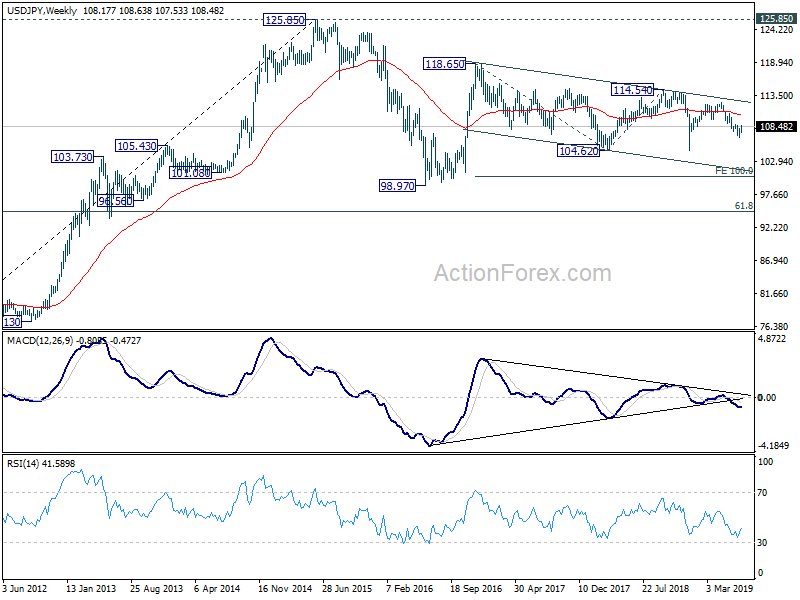
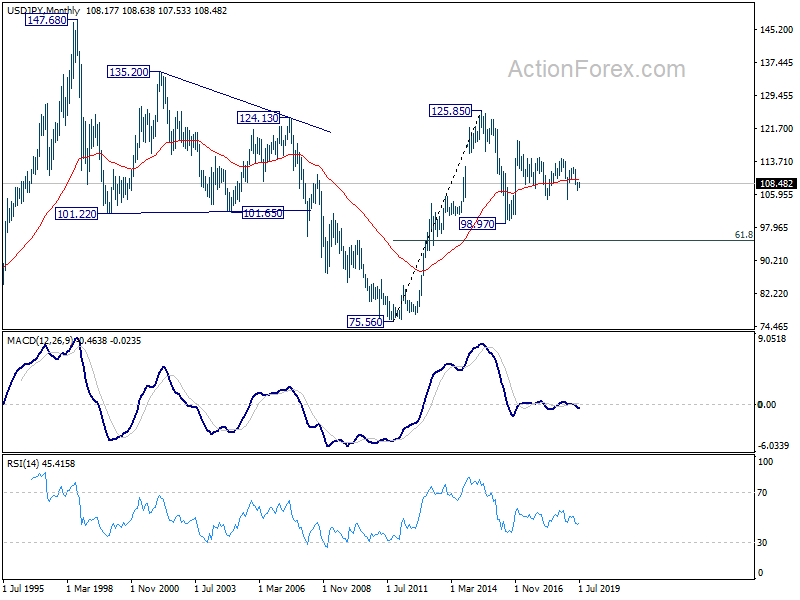
In the long term picture, the rise from 75.56 (2011 low) long term bottom to 125.85 (2015 high) is viewed as an impulsive move, no change in this view. Price actions from 125.85 are seen as a corrective move which could still extend. In case of deeper fall, downside should be contained by 61.8% retracement of 75.56 to 125.85 at 94.77. Up trend from 75.56 is expected to resume at a later stage for above 135.20/147.68 resistance zone.
GBP/USD Weekly Outlook
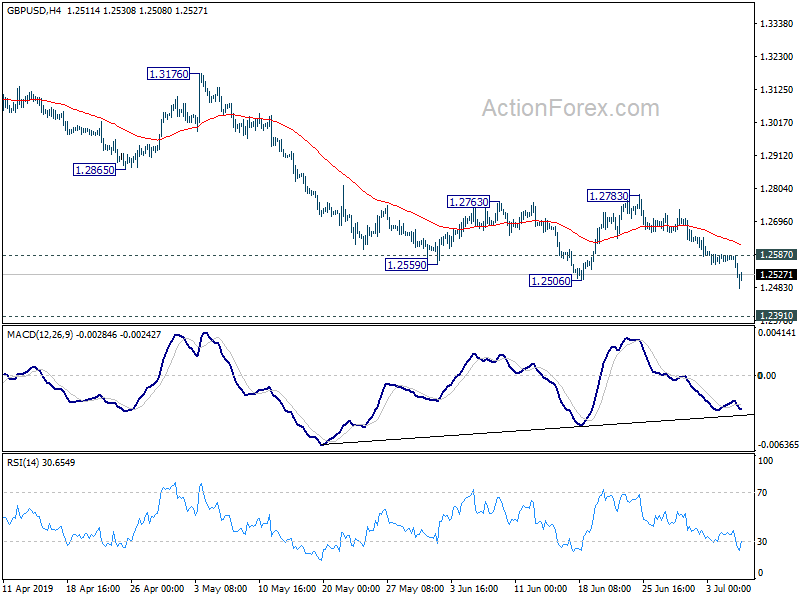
GBP/USD dropped further to as low as 1.2481 last week. Break of 1.2506 support indicate resumption of whole fall from 1.3381. The pair is also kept comfortably below falling 55 day EMA, maintaining near term bearishness. Initial stays on the downside this week for 1.2391 low. Firm break there will resume larger down trend. On the upside, above 1.2587 minor resistance will turn intraday bias neutral first. But near term outlook will stay bearish as long as 1.2783 resistance holds.
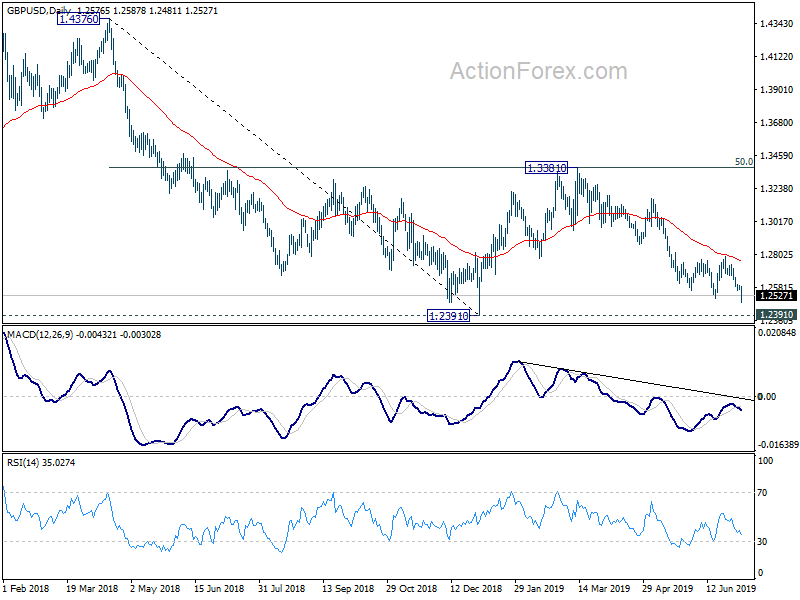
In the bigger picture, down trend from 1.4376 (2018 high) is still in progress. Break of 1.2391 would target a test on 1.1946 long term bottom (2016 low). For now, we don't expect a firm break there yet. Hence, focus will be on bottoming signal as it approaches 1.1946. In any case, medium term outlook will stay bearish as long as 1.3381 resistance holds, in case of strong rebound.
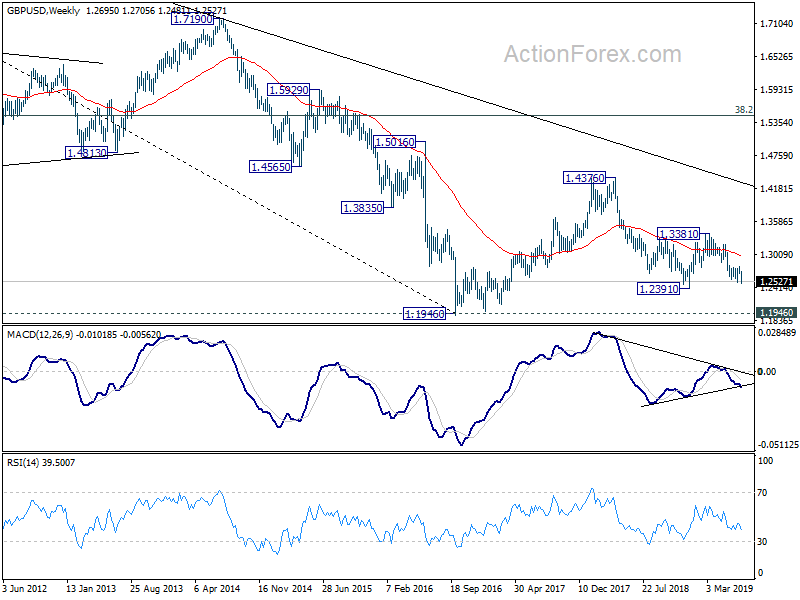
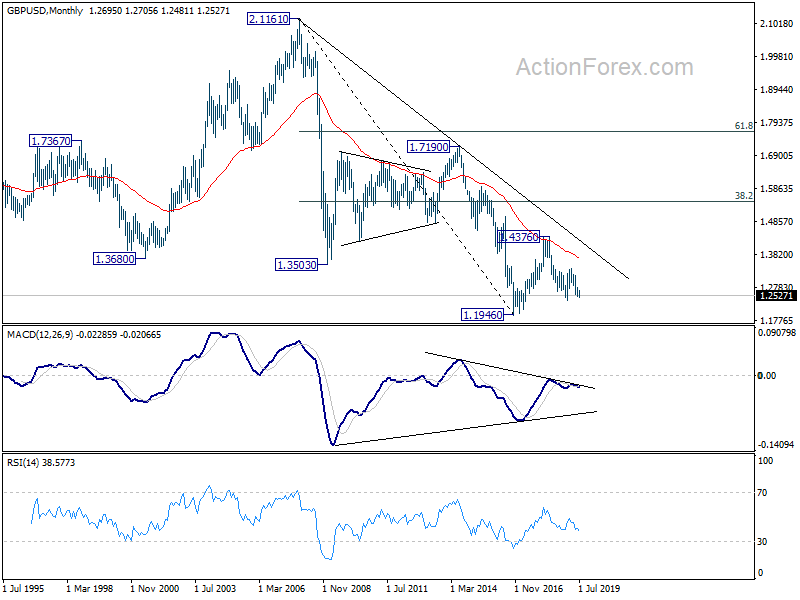
In the longer term picture, consolidative pattern from 1.1946 (2016 low) could still extend with another rising leg. But after all, decisive break of 38.2% retracement of 2.1161 (2007 high) to 1.1946 at 1.5466 is needed to indicate long term reversal. Otherwise, an eventual downside breakout will remain in favor.
USD/CHF Weekly Outlook
USD/CHF's strong rebound last week confirmed short term bottoming at 0.9695. Initial bias stays mildly on the upside for 1.0014 resistance. Upside could be limited by 61.8% retracement of 1.0237 to 0.9695 at 1.0030. On the downside, below 0.9842 minor support will turn bias back to the downside for retesting 0.9695 low instead. However, sustained break of 1.0030 will pave the way back to retest 1.0237 high.
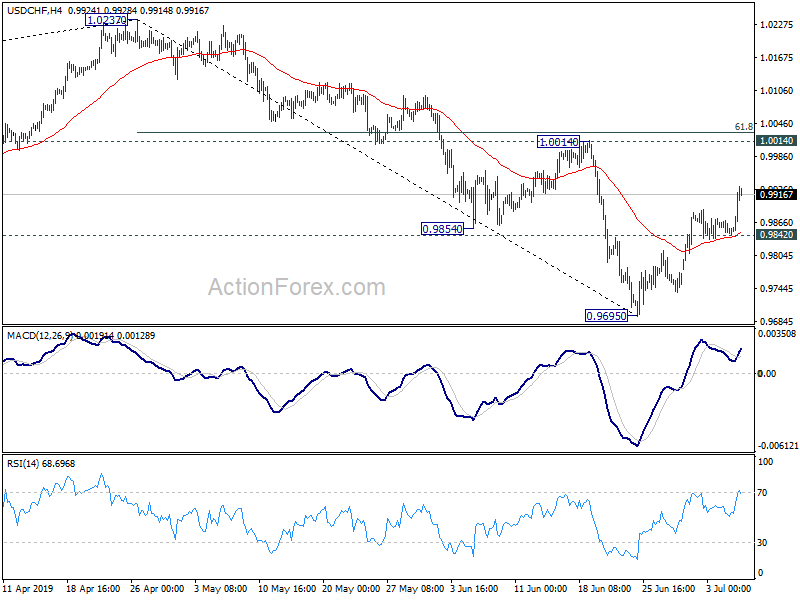
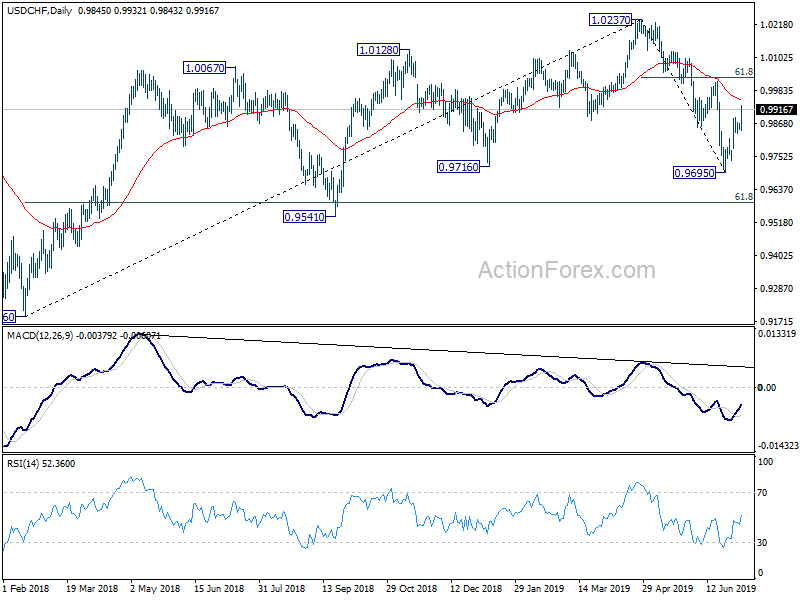
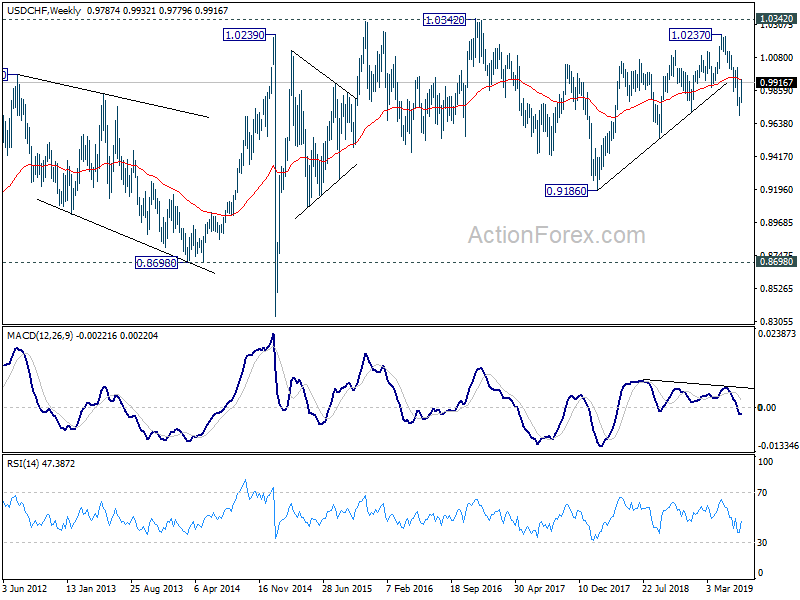
In the bigger picture, current development suggests that up trend from 0.9186 (2018 low) has completed at 1.0237 already. Deeper decline would be seen to 61.8% retracement of 0.9186 to 1.0237 at 0.9587 and below. For now, USD/CHF is seen as in long term range pattern between 0.9186 and 1.0342. Hence, we'd pay attention to bottoming signal below 0.9587. However, sustained break of 1.0014 will revive medium term bullishness and turn focus back to 1.0237 high.
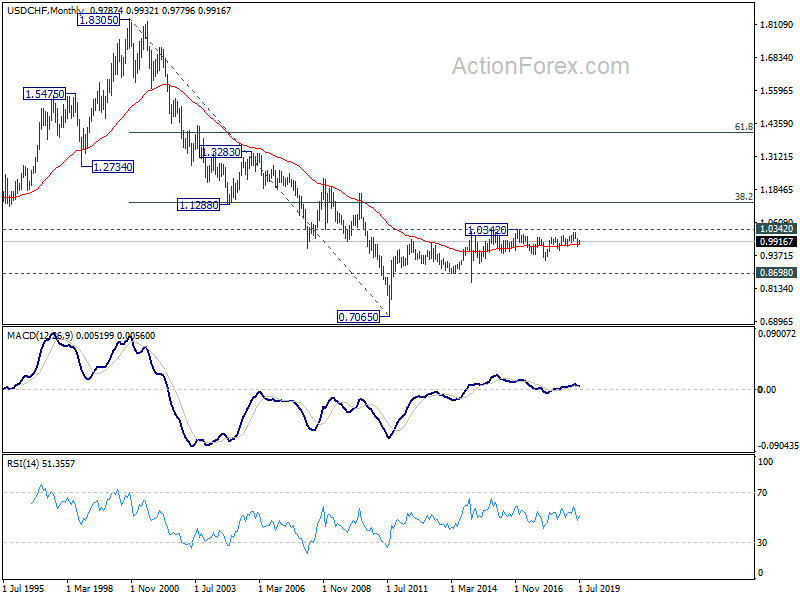
In the long term picture, price actions from 0.7065 (2011 low) are not clearly impulsive yet. Thus, we'll treat it as developing into a corrective pattern, at least, until a firm break of 1.0342 resistance.
AUD/USD Weekly Outlook
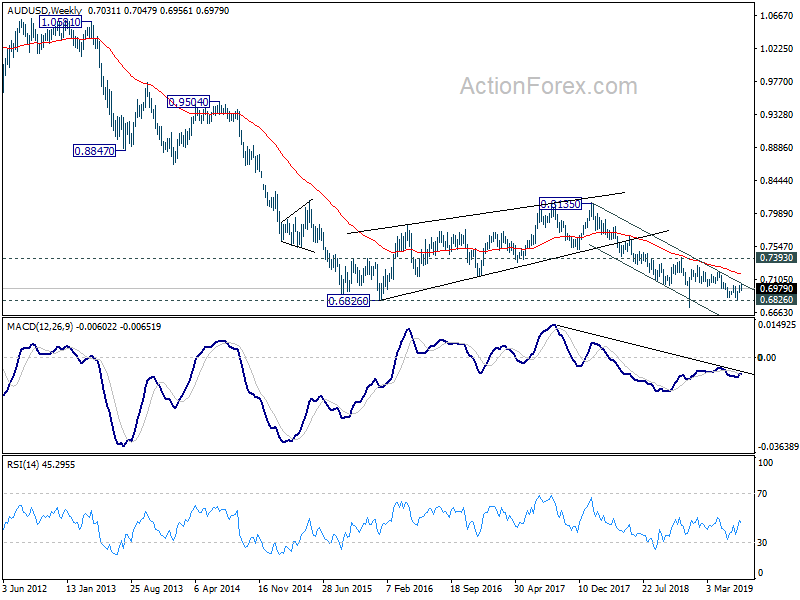
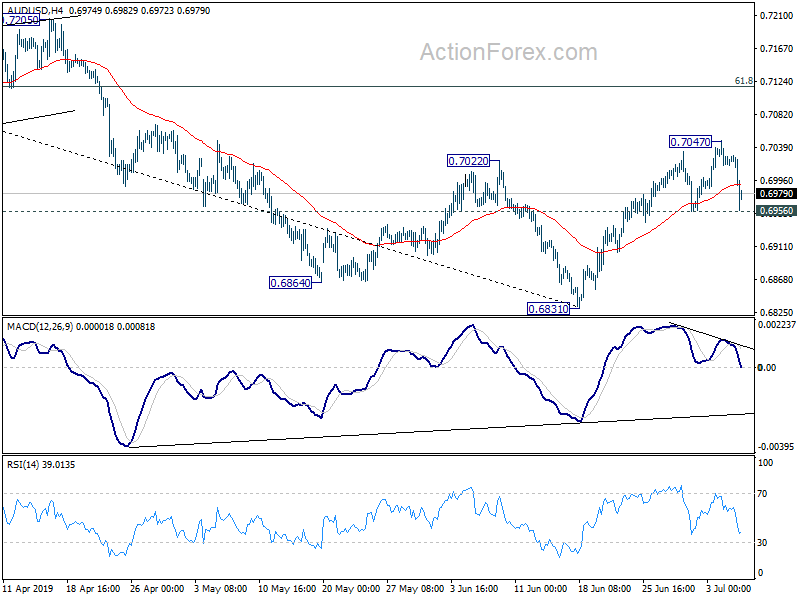
AUD/USD edged higher to 0.7047 last week but dropped sharply since then. Yet, as downside is contained above 0.6956 support, initial bias is neutral this week first. On the upside, break of 0.7047 will resume the rebound from 0.6831 to 61.8% retracement of 0.7295 to 0.6831 at 0.7118 first. Sustained break till target 0.7295 resistance next. On the downside, break of 0.6956 support, however, will indicate completion of the rebound. Intraday bias will be turned back to the downside for retesting 0.6831 low.
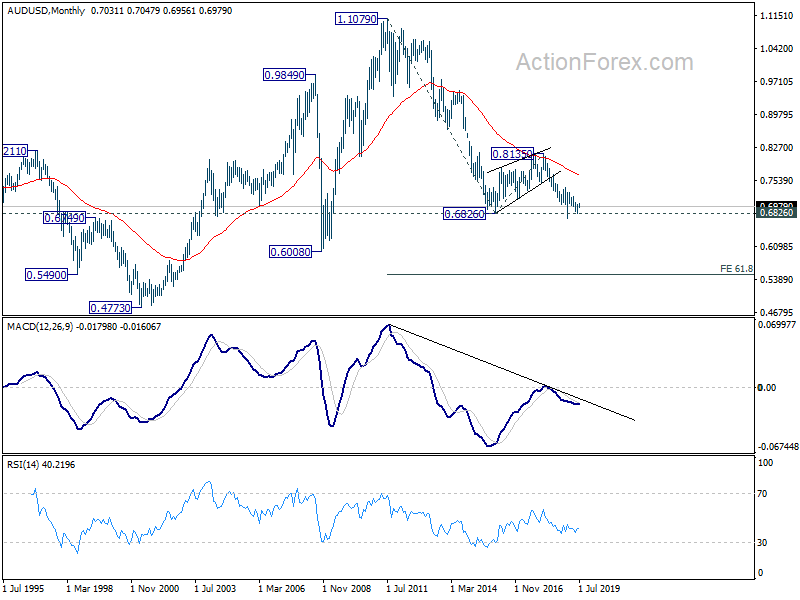
In the bigger picture, with 0.7393 key resistance intact, medium term outlook remains bearish. The decline from 0.8135 (2018 high) is seen as resuming long term down trend from 1.1079 (2011 high). Decisive break of 0.6826 (2016 low) will confirm this bearish view and resume the down trend to 0.6008 (2008 low). However, firm break of 0.7393 will argue that fall from 0.8135 has completed. And corrective pattern from 0.6826 has started the third leg, targeting 0.8135 again.
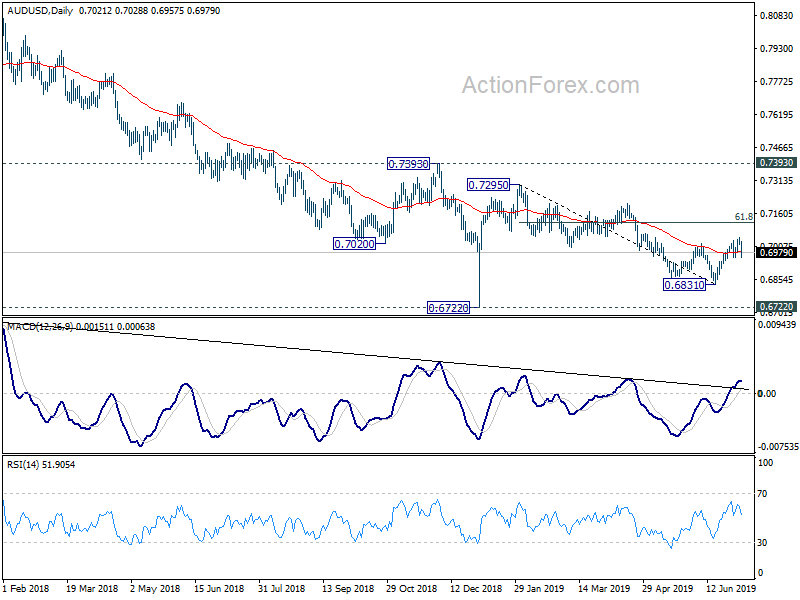
In the longer term picture, prior rejection by 55 month EMA maintained long term bearishness in AUD/USD. That is, down trend from 1.1079 (2011 high) is still in progress. Sustained break of 0.6826 will target 0.6008 low and then 61.8% projection of 1.1079 to 0.6826 from 0.8135 at 0.5507.