

Sample Category Title
Gold: Yellow Metal Trading Marginally Lower In The Morning Session
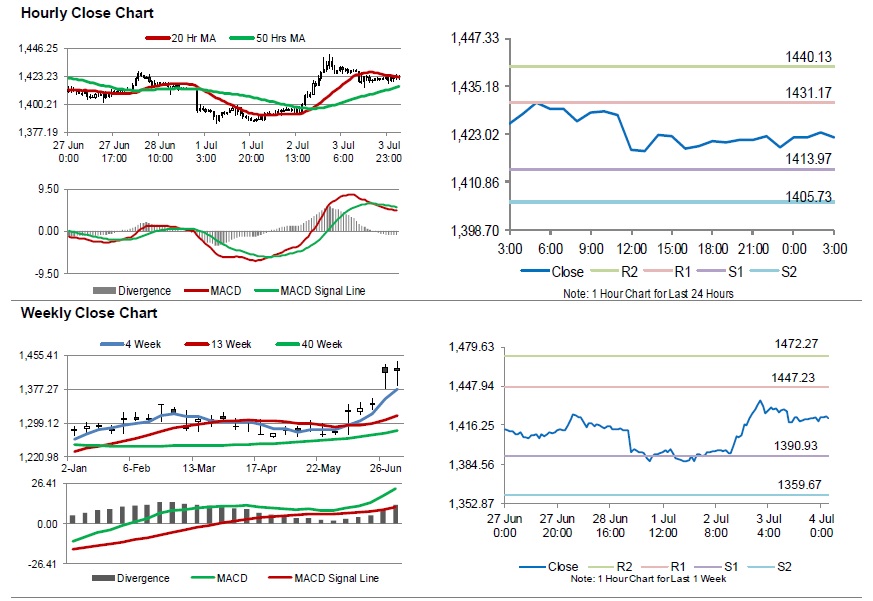
For the 24 hours to 23:00 GMT, Gold declined 0.46% against the USD and closed at USD1422.50 per ounce.
In the Asian session, at GMT0300, the pair is trading at 1422.20 with gold trading slightly lower against the USD from yesterday’s close.
The pair is expected to find support at 1413.97, and a fall through could take it to the next support level of 1405.73. The pair is expected to find its first resistance at 1431.17, and a rise through could take it to the next resistance level of 1440.13.
The yellow metal is showing convergence with its 20 Hr moving average and trading above its 50 Hr moving average.
WH Kudlow: Won’t lift tariffs during trade talks with China
White House Economic Adviser Larry Kudlow said US-China trade negotiations will "continue in earnest this coming week". The teams are "on the phone" and are "going to be on the phone this coming week". He doesn't know "precisely when" but the teams will be scheduling face-to face meeting.
Meanwhile, Kudlow emphasized that "We've been accommodative. We will not lift tariffs during the talks" He added, "we are hoping that China will toe its end of it by purchasing a good many of American imports."
Silver: White Metal Trading On A Stronger Footing This Morning
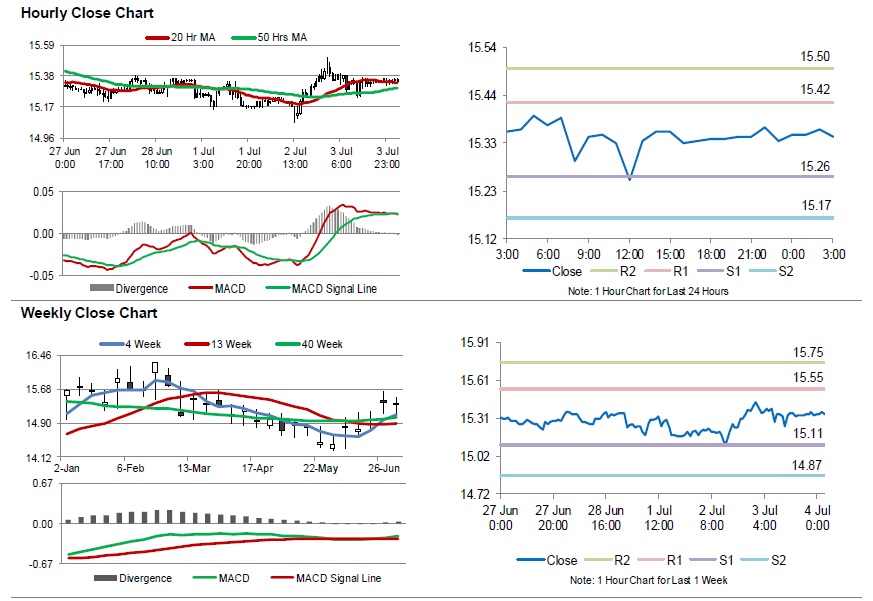
For the 24 hours to 23:00 GMT, Silver declined 0.23% against the USD and closed at USD15.34 per ounce, tracking losses in gold prices.
In the Asian session, at GMT0300, the pair is trading at 15.35, with silver trading 0.07% higher against the USD from yesterday’s close.
The pair is expected to find support at 15.26, and a fall through could take it to the next support level of 15.17. The pair is expected to find its first resistance at 15.42, and a rise through could take it to the next resistance level of 15.50.
The white metal is showing convergence with its 20 Hr moving average and trading above its 50 Hr moving average.
Crude Oil: Oil Trading Higher In The Asian Session
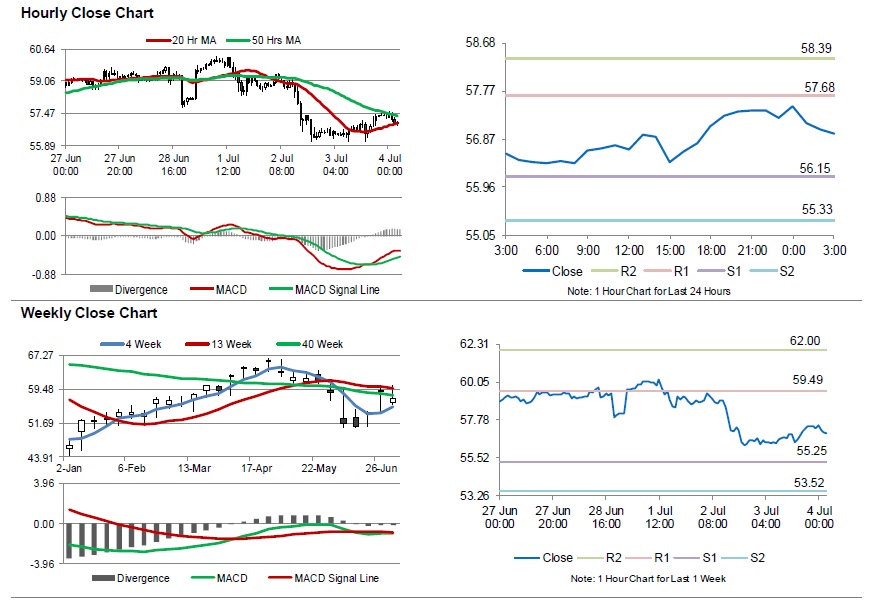
For the 24 hours to 23:00 GMT, Crude Oil rose 1.27% against the USD and closed at USD57.26 per barrel, after the Energy Information Administration (EIA) report indicated that US crude oil stockpiles fell by 1.1 million barrels to 468.5 million in the week ended 28 June 2019. Additionally, fresh figures from Baker Hughes disclosed that the number of active oil rigs declined by 5 to 788 in the week ended 03 July 2019.
In the Asian session, at GMT0300, the pair is trading at 56.97, with oil trading 0.51% lower against the USD from yesterday’s close.
The pair is expected to find support at 56.15, and a fall through could take it to the next support level of 55.33. The pair is expected to find its first resistance at 57.68, and a rise through could take it to the next resistance level of 58.39.
Crude oil is showing convergence with its 20 Hr moving average and trading below its 50 Hr moving average.
Will EUR/USD Bulls Regain Control At 61.8% Fibonacci?
The EUR/USD is testing a strong support zone at the 61.8% Fibonacci retracement level and support trend line (blue) of the uptrend channel. A break below this support zone increases the chances of a new downtrend and makes a new wave pattern also more likely. A bullish breakout above the resistance trend line (red) however could confirm the end of the bearish price swing within wave C (purple) and confirm the start of a bullish price swing.
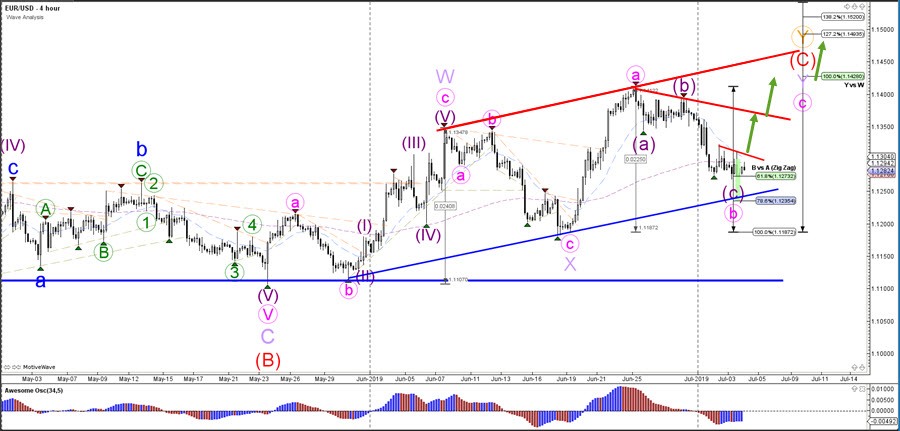
The EUR/USD seems to have completed 5 bearish waves (blue) within wave C (purple) but price will need to break above the resistance (red) before this wave pattern can be confirmed and becomes more likely. A bearish breakout would need to break below both support trend lines (blue) before the current wave pattern becomes less probable because a bullish bounce could also occur at 1.1250 and the 78.6% Fibonacci level.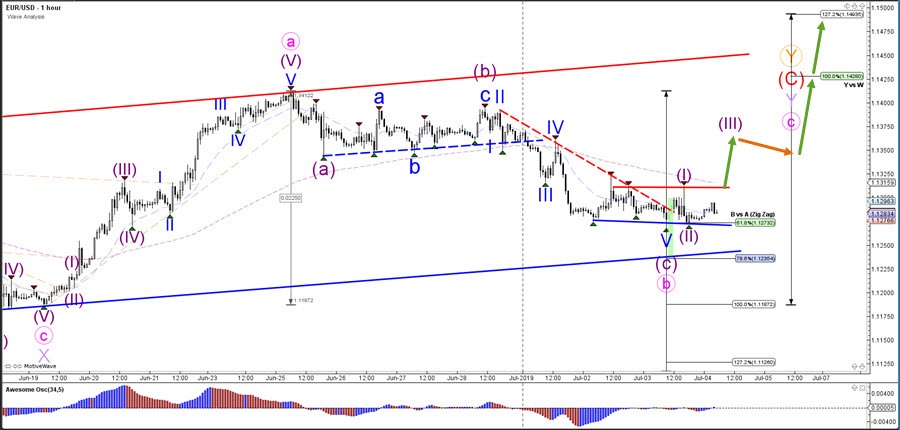
Elliott Wave View: More Upside In S&P 500 Futures
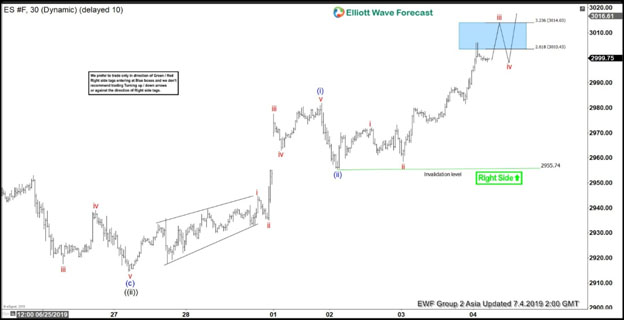
Elliott wave view in S&P 500 Futures (ES_F) shows a bullish sequence from December 26, 2018 low favoring further upside. In the short term chart below, the pullback to June 27 low (2914.5) ended wave ((ii)). Wave ((iii)) remains in progress as an impulse Elliott Wave structure looking for more upside. Up from June 27 low, wave (i ) ended at 2981.75 with subdivision as another impulse in lesser degree. Wave i of (i) ended at 2944.75 and wave ii of (i) pullback ended at 2935. Index then resumes higher in wave iii of (i) towards 2977.5, wave iv of (i) ended at 2963 and wave v of (i) ended at 2981.75.
Wave (ii) pullback ended at 2955.5. Wave (iii) is in progress and short term, while dips stay above 2955.74, expect the Index to extend higher. We don’t like selling the Index. As far as pullback stays above July 2 low (2955.74), expect Index to continue higher. If pivot at 2955.74 gives up, the Index is still expected to remain supported against June 4 low (2728.75). The Index has potential target to the upside towards 100% extension from December 26, 2018 low which comes at 3377 – 3529 area.
ES_F 1 Hour Elliott Wave Chart
Market Morning Briefing: Aussie Has Moved Up From Levels Below 0.70
STOCKS
Asian markets are in green taking cues from the rally in the US markets overnight. The US markets have closed at record highs yesterday. Positive sentiment is driving the global equities. While the US market has been driven by the hopes of a rate cut from the Fed this month, European markets are getting a push after the nomination of the IMF Chief Christine Lagarde as the new ECB President. Will the positive sentiment in the global equities help India's Sensex and Nifty which have been struggling for a strong rally, gain momentum today? We will have to wait and see.
As expected, Dow (26966.00, +179.32 +0.67%) has risen to test 27000 and keeps our bullish view intact. A further break above 27000 will pave way for the next targets of 27200 and 27500. The US markets are closed today on account of a public holiday.
DAX (12616.24, +89.52, +0.71%) has held well above 12450 and has risen sharply. The outlook remains bullish to test 12800 and 13000 in the coming weeks.
Nikkei (21706.72, +68.56, +0.32%) has bounced back and can revisit its resistance at 21750. A decisive rise past 21750 is needed to gain fresh momentum and target 22250 on the upside. Inability to breach 21750 can drag it to 21500 and 21350 in the coming days.
Shanghai (3017.86, +2.60, +0.09%) is holding above 3000. As mentioned yesterday, a sideways move between 3000 and 3050 is possible in the near-term. Thereafter the broader uptrend can resume targeting 3080 and 3100.
Sensex (39839.25, +22.77, +0.06%) and Nifty (11916.75, +6.45, +0.05%) managed to sustain above their support levels of 39750 and 11900 respectively. The view remains bullish for Sensex and the Nifty to test 40500 and 12150 respectively on the upside. But at the moment it looks like both the indices need some trigger to accelerate the pace of the upmove. We have to wait and see whether the Union Budget tomorrow can provide that trigger or will the indices gain momentum taking cues from the global markets today itself.
COMMODITIES
The EIA reported a draw of only 1.1mln barrels for the week ended 28th June after the huge draw of 12.8mln barrels the previous week. This could help stabilize or even lower Crude prices over the next few sessions. Gold and Silver could trade sideways for some sessions within the longer term bullish view. Copper is expected to rise while above 2.65.
Brent (63.37) and Nymex WTI (56.95) are trading slightly higher today. Upside is likely to be capped at 67 and 60 for the near term while a fall towards 60 and 54 respectively could be on the cards.
Gold (1422.70) tested 1440 on the upside before falling to current levels. Some consolidation in the 1400-1450 region is possible in the near term. Overall medium term is bullish for Gold towards 1500.
Silver (15.35) is almost stable but while below resistance near 15.60 we could see a test of 15 on the downside. Overall sideways trade within 15.0-15.60 looks likely.
Copper (2.6820) has risen slightly and while above immediate support near 2.65, the metal could re-attempt to move towards 2.70 or higher in the near term.
FOREX
Dollar Index (96.74) is stuck below 97 for the last 2-sessions. Note that 97.25 is an important resistance and while that holds, the index could fall towards 96.25 in the near term. A fall from levels below 97 itself is more preferred for now. Near term view is bearish for Dollar Index.
Euro (1.1283) is likely to hold above support near 1.1250-1.1275 and move back towards 1.13+ levels in the near term.
Dollar-Yen (107.75) could re-test 107 on the downside or even lower levels of 106 before bouncing back sharply towards 108.50-109.00 and higher in the longer run. For now the near term view is bearish for Dollar-Yen.
Euro-Yen (121.59) is likely to trade stable for some time before rising back towards 123. Note that 121 is an important support which is likely to hold in the coming week.
Aussie (0.7034) has moved up from levels below 0.70. While the rise sustains it could test resistance near 0.71 before coming off from there again in the medium term.
Pound (1.2581) is trading above support near 1.25 and while that holds, the currency could move higher towards 1.27 again in the near term. Below 1.25, there is scope for falling towards 1.24 on the longer term charts. Watch price action near 1.255-1.250.
USDCNY (6.8715) could trade sideways within 6.83-6.90 region. No major movement is expected over the coming week.
USDINR (68.92) is likely to range within 68.80-69.00 just now with a possibility of falling towards 68.60/50 eventually. Markets wait for the Union Budget on Friday to see if that brings in further volatility. Overall today the currency is likely to remain stable.
INTEREST RATES
Yields have dipped further as the increased hopes for a rate cut from the Fed is weighing on it. A private job data release yesterday missed to meet the market expectation and is strengthening the case for a rate cut. If Friday's job data from the government also comes out weak then the yields can come under more pressure. The US markets are closed today on account of a public holiday.
The US Treasury yields continues to trade lower and keeps the bearish view intact. The yields were down across tenors. The 2Yr (1.76%) and 5Yr (1.73%) were down 1bps and 4bps respectively while the 10Yr (1.95%) and 30Yr (2.47%) were down sharply by 6bps and 7bps respectively. As mentioned yesterday, the 10Yr has support at 1.93% from where a bounce to 2% is possible. But the broader view is negative for it to fall eventually to 1.85% or even lower. The 30Yr can test 2.45%-2.43% on the downside.
The German yields have dipped further. The 2Yr (-0.77%), 10Yr (-0.39%) and 30Yr (0.20%) have dipped while the 5Yr (-0.65%) has bounced slightly. The outlook remains negative. The 5Yr can test -0.73% and the 10Yr can dip to -0.42% in the coming days.
The 10Yr GOI (6.9710%) dipped below 6.95% yesterday as expected but failed to sustain lower. The near-term outlook continues to remain mixed and the 10Yr GOI can remain sideways between 6.90% and 7.10% in the near-term. However, the broader view remains bearish for the 10Yr GOI to break below 6.90% and fall to 6.80%-6.75% in the coming weeks.
Gold Price Remains Well Supported On Dips
Key Highlights
- Gold price failed once again near the $1,435 resistance area against the US Dollar.
- A major bullish trend line is forming with support near $1,396 on the 4-hours chart of XAU/USD.
- The US ADP Employment changed 102K in June 2019, less than the 140K forecast.
- The Euro Zone Retail Sales in May 2019 might rise 0.3% (MoM), up from the last -0.4%.
Gold Price Technical Analysis
After testing the $1,380-$1,382 support area, gold price climbed higher this week against the US Dollar. The price traded above the $1,420 resistance, but it failed once again near the $1,435 resistance area.
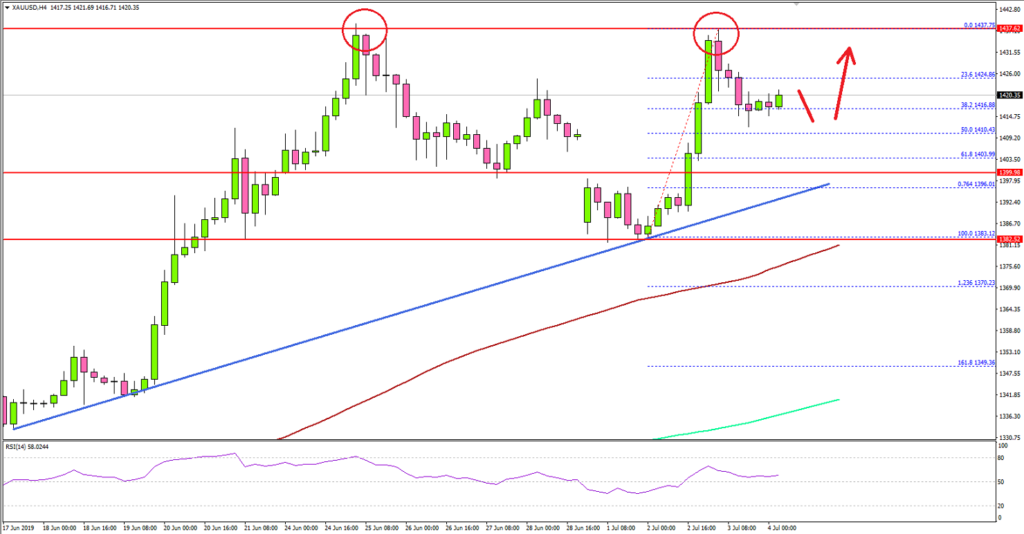
The 4-hours chart of XAU/USD indicates that the price topped near the $1,437 level and recently started a fresh downside correction. There was a break below the $1,430 level to start the recent correction.
The price traded below the 23.6% Fib retracement level of the last wave from the $1,383 low to $1,437 high. However, there are many supports on the downside near the $1,410, $1,400 and $1,395 levels.
An immediate support is near $1,410 plus the 50% Fib retracement level of the last wave from the $1,383 low to $1,437 high. Moreover, there is a major bullish trend line forming with support near $1,396 on the same chart.
Therefore, dips towards the $1,400 and $1,395 levels remain well supported. To move into a bearish zone, gold price must settle below $1,380 plus the 100 simple moving average (4-hours, red).
On the upside, the main hurdle for the bulls is near the $1,435 and $1,440 levels. If there is an upside break above $1,440, the price could easily rise towards the $1,450 and $1,460 levels.
Fundamentally, the US ADP Employment change figure was released by the Automatic Data Processing, Inc. The market was looking for an increase of 140K in June 2019, more than the last 27K.
However, the actual result was less than the market forecast, as the private-sector employment increased by 102K from May to June, on a seasonally adjusted basis. Besides, the last reading was revised up from 27K to 41K.
Commenting on the report, the vice president and co-head of the ADP Research Institute, Ahu Yildirmaz, stated:
Job growth started to show signs of a slowdown. While large businesses continue to do well, small businesses are struggling as they compete with the ongoing tight labor market.
The report was weak, but the US Dollar managed to hold the ground and pairs such as EUR/USD and GBP/USD extended losses in the past few sessions.
Economic Releases to Watch Today
- Swiss CPI for June 2019 (YoY) – Forecast +0.5%, versus +0.6% previous.
- Euro Zone Retail Sales for May 2019 (YoY) – Forecast +1.6%, versus +1.5% previous.
- Euro Zone Retail Sales for May 2019 (MoM) – Forecast +0.3%, versus -0.4% previous.
Daily Markets Broadcast
Wall Street higher in holiday-shortened session
Wall Street extended recent gains into the Independence Day holiday yesterday, with the US30 index hitting a record high. Trump's chief economic adviser Kudlow said US-China trade talks to resume by phone in the coming week.
US30USD Daily Chart
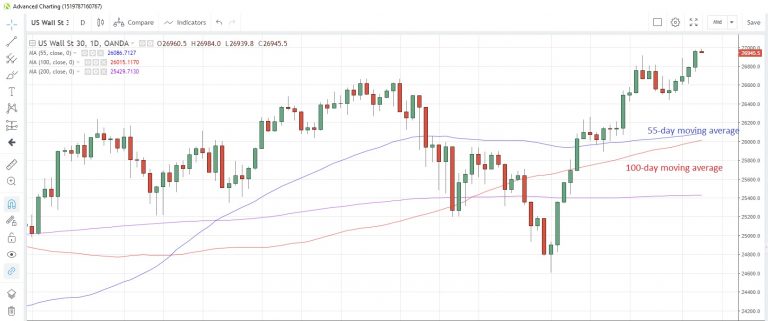
The US30 index rallied for a fifth day yesterday and has extended those gains to a record high of 26,984 this morning
the 100-day moving average at 26,015 and the 55-day average at 26,086 are on a convergence path, with a crossover likely by the end of next week
Mixed results from the June services PMIs released last night. The Markit version improved to 51.5 from 50.9 but the ISM equivalent fell to 55.1 from 56.9. There are no data releases today due to the Independence Day holiday.
DE30EUR Daily Chart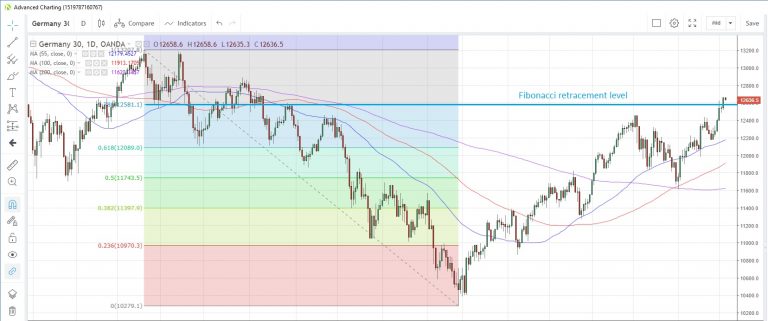
The Germany30 index rallied to an 11-month high yesterday, encouraged by the climb to record levels on Wall Street and better-than-expected PMI data
The index closed above the 78.6% Fibonacci retracement of the May-December drop last year at 12,581 for the first time since August 9
Germany's June Markit services PMI improved to 55.8 from 55.4 while the Euro-zone reading rose to 53.6 from 52.9. Euro-zone retail sales are expected to rise 0.3% m/m in May after a 0.4% decline in April.
CN50USD Daily Chart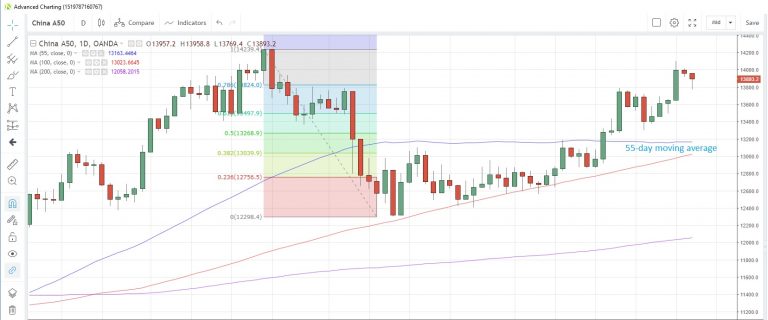
The China50 index fell for a second consecutive day yesterday despite the gains on Wall Street
The index has held above the 55-day moving average at 13,163 since June 18
The Office of the US Trade Representative confirmed that the two sides were in the process of scheduling a principal-level phone call with Chinese officials for next week. Trump again accused China and Europe of currency manipulation.
USD/CAD Canadian Dollar Rises On US Private Jobs Miss
The Canadian dollar rose 0.34 percent on Wednesday. The US market closed early to start the fourth of July celebrations, but the dollar is on the back foot as the ADP came in lower than expected and the services PMI put together by the ISM is slowing down. The loonie got a boost from a surprise surplus in the trade balance. Oil prices rebounded with a softer dollar and the market reacting to the third consecutive drawdown of US crude stocks.
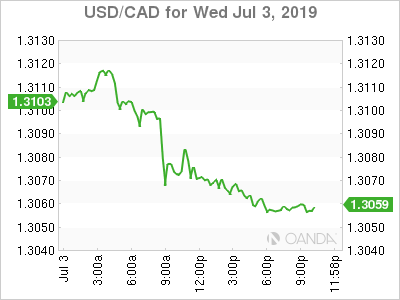
The miss in the US employment data, puts even more emphasis on the June NFP report. The Fed signalled it is ready to cut its benchmark interest rate. The Bank of Canada (BoC) does not face that much pressure to act as stronger economic indicators have given the central bank some breathing room.
Low volumes are expected on Thursday with the US on holiday and little on the economic calendar, this contrasts Friday that will start the North American session with a bang, with US and Canadian employment data at 8:30 am.
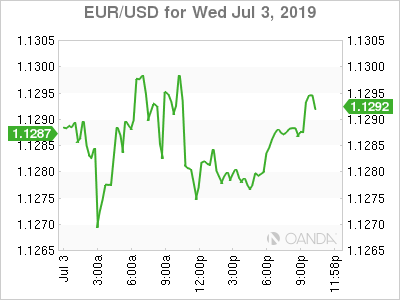
The US dollar is mixed against major pairs. Commodity currencies appreciated against the greenback, while the dollar gained against the CHF, EUR and GBP. US markets will be close for the US independence holiday, but it will be a short break for the market that will get back to their trading screens for the release of the June employment report to be published on Friday.
OIL – Crude Higher on Lower US Crude Inventories
Oil prices rebounded on Wednesday ahead of the July 4th weekend. The API delivered another drop in inventories with crude falling by 5 million barrels. The EIA weekly report showed a similar drawdown with crude stock shrinking by 1.1 million barrels and gasoline by 1.6 million.
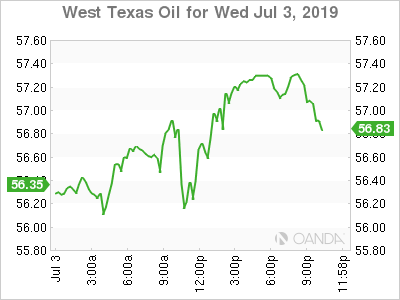
West Texas Intermediate gained 2.06 percent and Brent 2.53 percent, but the two are still in the red on a weekly basis by more than 1 percent despite the best efforts of the OPEC+. The meeting at the G20 between Presidents Trump and Xi was not a success, and with declining economic indicators and more trade battles gearing up, energy demand is under pressure.
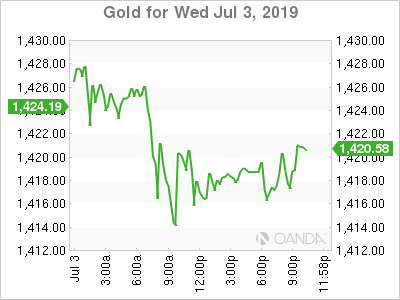
GOLD – Gold Rebounds as Trade Hopes Fade
Gold rose 0.89 percent on Wednesday. The yellow metal remains trading above $1,400 as the G20 trade optimism started to dissipate. Weak global manufacturing and comments from US officials on the length and difficulty of the US-China deal put gold back in play as a safe haven.
STOCKS – US Stocks Hit New High Ahead of Short Trading Session
US stocks posted another record as central bank stimulus is boosting equities. The biggest challenge for global equities to keep rising will be economic strength of the major economies. Central banks are ready to keep rates low to avoid growth losing momentum, but if economic indicators start showing signs that a recession is inevitable, consumer and investor confidence would suffer.
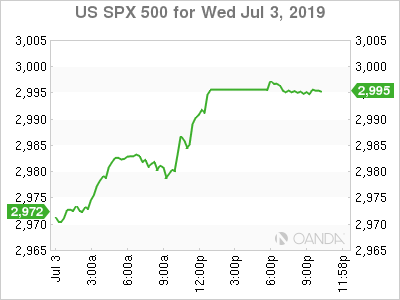
The US non farm payrolls (NFP) report to be published on Friday is expected to rebound from last month’s disappointment, but if the ADP is any indication it could fall further triggering more red flags of economic uncertainty. The market is now pricing in a Fed rate cut at 100 percent with the biggest debate on if it will be a 50 or 25 basis points. The ISM manufacturing PMI also showed a slowdown of the services industry and is now at a 2 year low.