Sample Category Title
US: Trade Deficit Widens in May as Exports and Imports Rebound
- The U.S. trade deficit widened to $55.5bn in May from a downwardly revised $51.2bn in April (previously $50.8bn) and was broadly in line with consensus expectations.
- Trade in both goods and services saw strong rebounds in May. Nominal exports of goods grew by 2.9% month-on-month, following a 3.2% contraction in April. The rise was even stronger when stripping out prices as real goods exports grew by 3.1% month-on-month. There was broad-based improvement across all product categories except industrial supplies, which saw a mild contraction (-0.9%). Capital goods (3%) and consumer goods (4.8%) exhibited particular strength, picking up from weak April showings.
- Nominal imports of goods rose by 3.9% m/m in May, after contracting by 2.5% in April. Like real exports, real imports recorded a stronger increase, growing by 4.1%, the strongest increase since March 2015. Growth was positive across all import categories with a standout performance from automotive imports (7.6%).
- Services exports and imports both grew by 0.5% m/m, reversing the downturn observed in April.
- Trade deficits widened with most trading partners specifically Canada, China and Mexico.
Key Implications
- Trade bounced back in a big way in May. Exports from China picked up sharply likely due to a pull-forward of imports in expectation of further tariffs on Chinese imports. The 10% to 25% increase in tariffs on $200bn worth of Chinese goods will take full effect in June.
- The strength in imports reflects the continued strength in U.S. domestic demand. Rebounds in capital goods and industrial supplies indicate some life in investment, diverging somewhat from the signals coming from other indicators.
- On the whole, we don’t expect May's strength in international trade to persist, especially as much of it appears merely to get ahead of anticipated tariffs. With slowing global growth and tariff uncertainty in the air, gains in trade will likely remain muted through the rest of the year.
Sunset Market Commentary
Markets
Dovish Fed and head of ECB nominees inspired an early move higher in both the 10-yr T Note and Bund futures. The upleg reversed at the start of European dealings though. Yields returned from intraday lows, supported by slightly better than expected (final) services and composite EMU PMI’s. A poor ADP reading (102k vs. 140k expected although with a 14k upward revision for May) suggests caution for Friday’s official payrolls but markets shrugged. It might also mean the recent decline in yields has gone far enough for investors while adapting positions having the 4th of July US holiday in mind. Still, the German yield curve flattened as yields change from flat (2-yr) to -1.3 bps (10-yr) and -3.7 bps (30-yr). The European periphery again profits strongly from yield searchers as spreads narrow 12 bps in Italy and 14 bps in Greece, bringing the total to about -40 bps in just three days! The US yield curve eventually didn’t shift materially, with the 10-yr yield slipping 1 bp and other maturities staying unchanged.
EUR/USD touched a minor correction low in the 1.1270 area this morning. The euro traded with a slightly negative bias as the new ECB Chair, Christine Lagarde was expected to continued Draghi’s policy of ample policy accommodation. Still, EUR/USD soon found a bottom as the EMU services PMI’s were slightly better than expected. EUR/USD returned to the 1.1280/1.1300 area. Italy avoids a disciplinary EC procedure on its budget. Italian spreads narrowed further, but this European risk-on move again hardly helped the euro. Early in US dealings, the ADP private job growth misses the consensus for a second month in an row. The impact on the dollar remained close to non-existent. The jobless claims and the US May trade deficit were also too close to expectations to give any directional guidance for USD trading. Investors are counting down to the US non-Manufacturing ISM. EUR/USD is currently trading in the 1.1290/1.1300 area. USD/JPY (107.75 area) is rebounding off the intraday lows as sentiment on risk remains constructive.
Today, the UK economic eco news turned further negative. In the post-Brexit era, the UK services sector was an important stronghold for the UK economy, but the June services PMI (50.2) suggests that growth in the sector came almost to a standstill. With measures of the manufacturing and the construction sector printing below the 50 boom-or-bust level earlier this week, the UK composite PMI (49.7) pointed that overall activity in the economy is at the brink of moving in contraction territory, too. Today’s poor eco data and persistent uncertainty on the Brexit, make investors conclude that the BoE will be forced to make a U-turn and prepare for a rate cut rather than a rate hike. EUR/GBP again came with reach of the 0.90 barrier even as the euro is in rather poor shape, too. No break of the 0.90 barrier occurred, but any further negative (eco or political) news might finally do the job.
News Headlines
The European Commission is likely to refrain from the excessive debt procedure against Italy after Rome committed to limit it’s 2019 deficit to 2.04%. It has passed a law earlier this week that would set aside future to keep the deficit in line with EU limits.
The Swedish Riksbank kept rates stable at today’s meeting and still assumes a rate hike by the end of this year or early next year is required. The central bank acknowledges global growth risks but thinks the impact on its economy will remain limited (little changed forecasts). The Swedish krona advanced.
Elliott Wave Analysis: Bearish USD Index On Pause; Lower Prices in View!
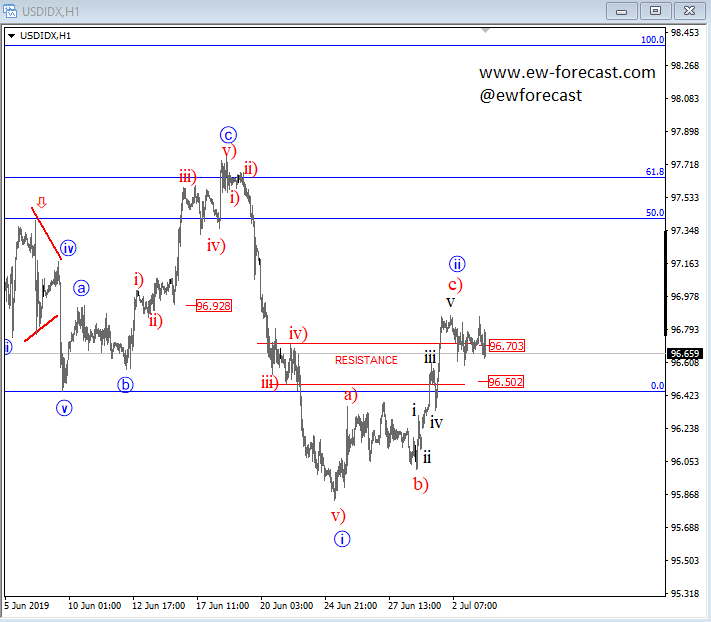
USD index is recovering from the lows, however this recovery can only be temporary as we see it as part of a bigger setback of a bearish decline. We labelled a corrective wave ii in progress with sub-wave c) now trading near possible resistance and turning point zones (96.70/96.98 region). A drop in impulsive fashion would confirm more weakness.
Despite bearish looking USD Index, JPY currency pair can be even weaker and that is why we are bullish on USDJPY.
USD Index, 1h
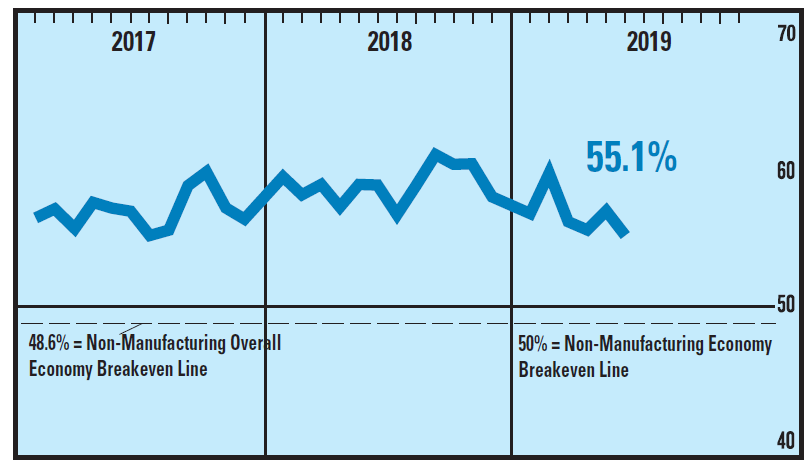
US ISM non-manufacturing dropped to 55.1, mixed sentiment on trade and tariffs uncertainty
US ISM Non-Manufacturing Composite dropped to 55.1 in June down from 56.9 and missed expectation of 56.0. Looking at some details, Business Activity dropped -3.0 to 58.2. New Orders dropped -2.8 to 55.8. Employment dropped -3.1 to 55.0.
ISM noted in the release: "Although the non-manufacturing sector's growth rate dipped in June, the sector continues to reflect strength. The comments from the respondents reflect mixed sentiment about business conditions and the overall economy. A degree of uncertainty exists due to trade and tariffs."
Surging Canadian Exports Drive a Surprise Trade Surplus in May
- Canada posted a $0.76 billion trade surplus in May following an upwardly revised $1.1 billion deficit in April (previously reported as a $0.97 billion deficit). This came against consensus estimates for a $1.7 billion deficit. Exports advanced an impressive 4.6% (m/m) to $53.1 billion, while imports were up 1% to $52.3 billion.
- After accounting for price changes, the picture was still solid. Export volumes were up a significant 4.0%. Import volumes were up 1.2%.
- The surge in exports was relatively broad-based, spanning 9 out of the 11 product categories. Leading the way were increased exports of motor vehicles and parts (+12.4%) and the volatile aircraft and other transportation equipment category (+33%). Exports of energy products (+5%) and metal ores and non-metallic minerals (+24.3%) were also strong. The spike in some of these categories was partly due to transitory factors, including a resumption in activity in motor vehicle production plants following the shutdowns in April.
- Imports were up in 6 out of the 11 product categories, but were mainly driven mainly by increased imports of aircraft and other transportation equipment (+14.2%) and motor vehicles and parts (+1.6%).
- Canada's merchandise trade surplus with the U.S. widened to $5.9 billion, its widest since 2008. Its merchandise trade deficit with the rest of the world narrowed to $5.2 billion.
Key Implications
- Overall, there is little to complain about in this release. Part of the unexpected surge in May's exports should be discounted given the one-off transactions (resumption of motor vehicle production following shutdowns, spikes in the volatile aircraft and boats and other transportation equipment categories). Still, a solid report is a solid report, with today's data revealing an encouragingly broad-based May export picture.
- May's international trade data joins a suite of other data releases confirming that the Canadian economy is recovering from the soft patch seen in late 2018 and early 2019. Today's print adds some further upside to our 2.5% tracking for Q2 GDP.
EURUSD Bear Pressure Targets The 1.1225 Area
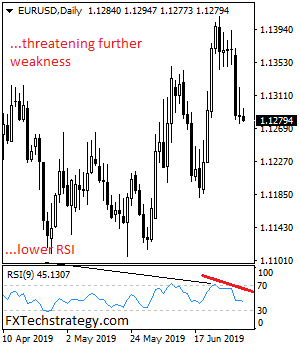
EURUSD bear pressure targets the 1.1225 area as it looks for price extension. Support comes in at the 1.1225 where a violation will turn risk to the 1.1200 level. A turn below here will target the 1.1150 level. Further down, support lies at the 1.1100. Its daily RSI is bearish and pointing lower suggesting more decline. Conversely, on the upside, resistance resides at 1.1350 level with a break through there opening the door for further upside towards the 1.1.1400 level. Further up, resistance comes in at the 1.1450 level where a violation will expose the 1.1500 level. All in all, EURUSD bear pressure targets the 1,1225 area as more weakness is expected.
EURAUD May Pause Downside Rally Near 38.2% Fibo
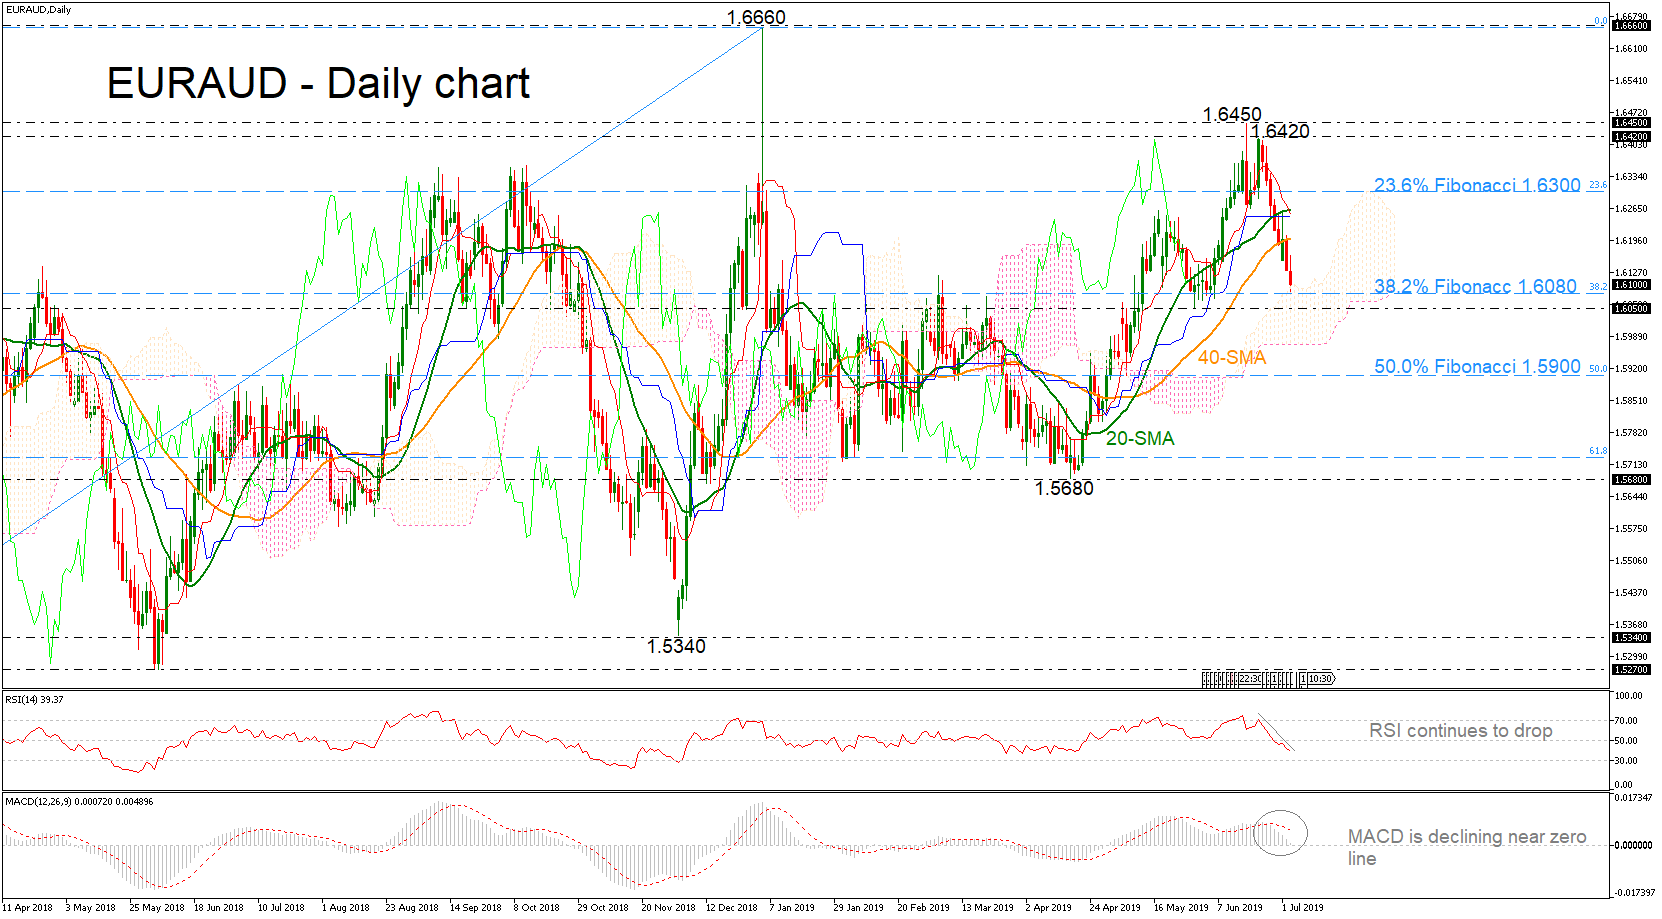
EURAUD found some footing around the 1.6420 resistance level last week and returned to bearish thereafter in the short-term.
The price is currently testing the 38.2% Fibonacci retracement level of the upleg from 1.5150 to 1.6660 around 1.6080 and the upper surface of the Ichimoku cloud. The red Tenkan-sen is turning lower above the blue Kijun-sen line which is flat and the RSI and the MACD are flirting with negative levels, pointing to a bearish short-term trading.
In the negative scenario, the pair could slip towards the immediate support level of 1.6050 before testing the next psychological mark of 1.5900, which is the 50.0% Fibonacci region.
A pullback on the 38.2% Fibo may drive the pair around the 40-day simple moving average (SMA) currently at 1.6200, while slightly higher the bulls could try to touch the 20-day SMA around 1.6260. Should the pair rise above these lines the 23.6% Fibo of 1.6300 could provide significant resistance to the market.
In brief, EURAUD is expected to pause the southward run in the short-term as it is testing strong support levels, while in the long-term buying interest could advance if the market jumps above the latest high of 1.6450.
Brent Futures Bears Look Exhausted; Indicators Signal Bullish Action
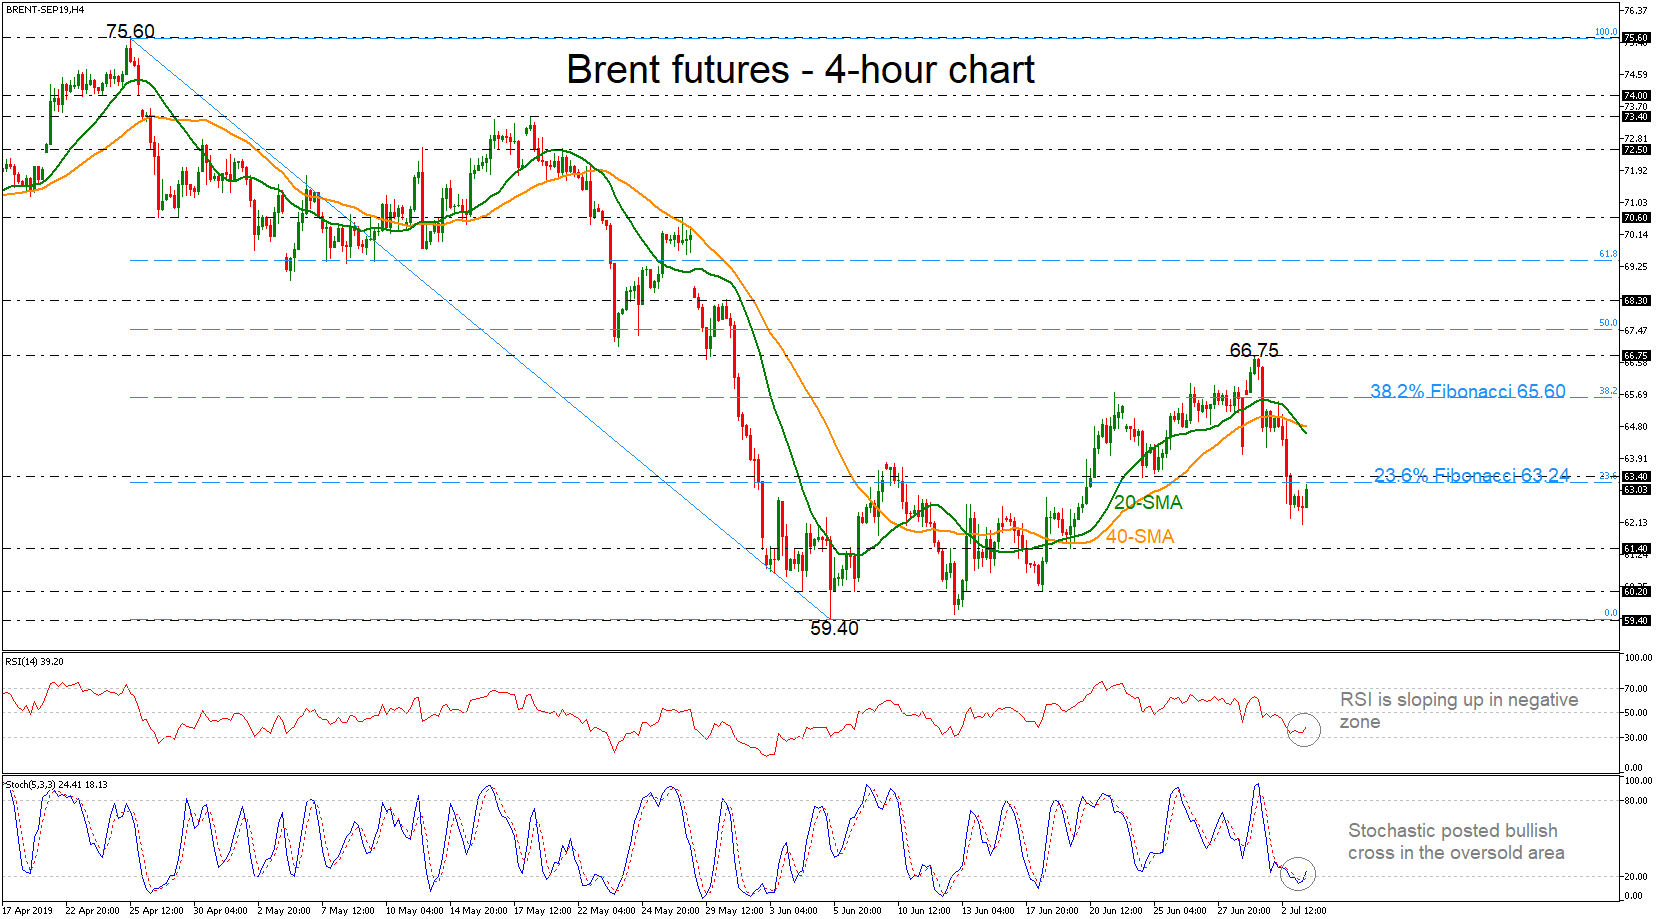
Brent crude oil futures have gained a bit in the last 4-hour session, paring some losses of yesterday’s move. The technical indicators are currently feeding prospects for a possible positive short-term trading as the RSI is pointing up in the negative area and the %K line of the stochastic oscillator is creating a bullish cross with the %D line in the oversold zone, suggesting the end of the bearish phase.
Alternatively, if 63.40 and the 23.6% Fibonacci of the downward wave from 75.60 to 59.40, near 63.24, proves easy to get through, the spotlight will turn to the 38.2% Fibonacci of 65.60 but first they need to surpass the short-term bearish crossover within the SMAs currently at 64.80.
A failure to overcome the 63.40 resistance, could send the price down to the 61.40 support. Lower, the next level could be found around 60.20, while a decisive close below it could stage a steeper sell-off until 59.40.
Summarizing, the oil market seems to turn slightly higher today in the very short-term with the technical indicators suggesting more bullish actions.
Canadian Trade Back in Surplus in May
- The trade balance unexpectedly swung to a surplus in May
- Exports surged 4.6%, 4.4% excluding price impacts
- Import volumes rose 1.3% as equipment imports rose
The Canadian net trade numbers are notoriously volatile and revision-prone. And part of the swing in the trade balance to a $0.8 billion surplus – the first positive balance since July 2018 – was due to one-off factors that won’t be repeated. A bounce up in motor vehicle exports was a retracement from earlier transitory production disruptions and a surge in transport equipment sales to Saudi Arabia presumably won’t be repeated. We don’t expect the surplus position will last. Still, the recovery in export volumes over the last couple of months just adds to the list of evidence that economic growth bounced-back in Q2 after transitory factors (bad weather, Alberta oil production curtailments) held back growth over the winter. An increase in equipment imports in May also is a positive sign for Canadian business investment.
The unpredictability of the US approach to international trade negotiations still leaves significant uncertainty about the future trade backdrop, but the economic data in Canada has also looked significantly better recently – and that is a big reason why markets are pricing in significantly lower odds of interest rate cuts from the Bank of Canada than elsewhere.
USD/CAD Mid-Day Outlook
Daily Pivots: (S1) 1.3088; (P) 1.3114; (R1) 1.3130; More...
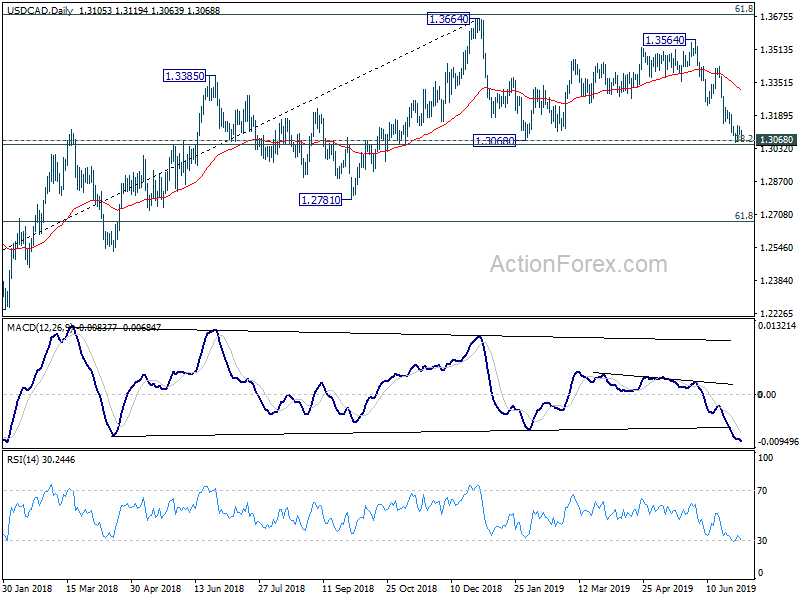
USD/CAD drops notably today but stays above 1.3059 temporary low. Intraday bias remains neutral with focus on 1.3052/68 cluster support zone. Decisive break there will carry larger bearish implication and target 1.2673 fibonacci level next. However, break of 1.3151 support turned resistance will indicate short term bottoming and bring rebound back to 1.3239/3432 resistance zone.
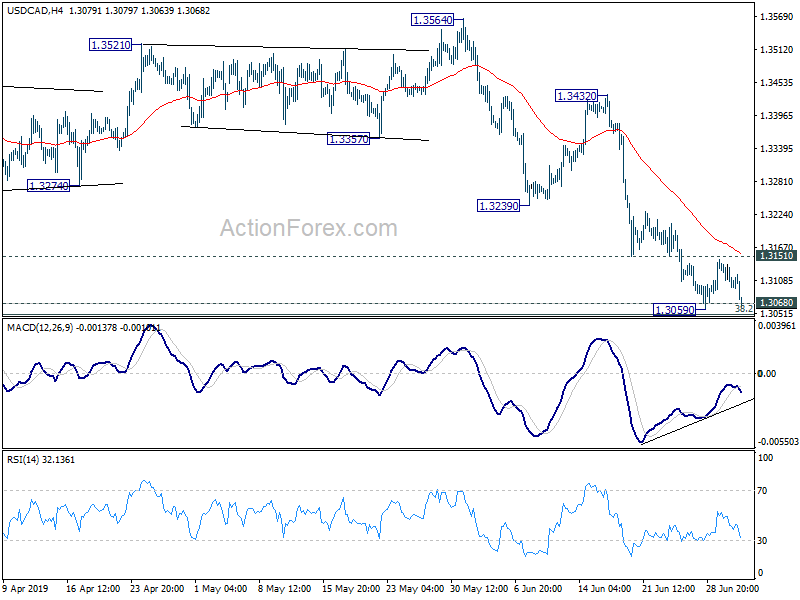
In the bigger picture, medium term outlook stays neutral for now even though the case of bearish reversal is building up. Decisive break of 1.3068 cluster support (38.2% retracement of 1.2061 to 1.3664 at 1.3052) will confirm completion of up trend from 1.2061 (2017 low). Further fall should be seen to 61.8% retracement at 1.2673 next. On the upside, sustained break of 61.8% retracement of 1.4689 (2016 high) to 1.2061 at 1.3685, is needed to confirm resumption of up trend from 1.2061 (2017 low). Otherwise, risk will stay on the downside.