Sample Category Title
Safe Haven Assets Restore Gains As Risk Appetite Falters Despite US-China Trade Truce
Despite all the hype, the US-China trade truce hasn’t been able to sustain risk sentiment. Anxious investors flocked to safe haven assets, sending Gold back above the psychological $1400 level, the Japanese Yen to sub-108 levels against the US Dollar, and yields on 10-year US Treasuries below two percent. Asian stocks are currently lower, while Asian currencies are mixed against the US Dollar.
The feel-good sentiment that followed the Trump-Xi meeting proved fleeting as investors were fed with a slew of manufacturing PMI data that exposed economic shortcomings across Asia and Europe. The threat of more US tariffs on EU goods hasn’t done risk appetite any favours, as tariffs on shipments between the US and China remain in place and continue inflicting damage on the global economy.
Downside risks continue to feed into market trepidation that the global economy will experience a steeper-than-expected slowdown. Whether or not policymakers will have enough ammunition to cushion the fall remains to be seen, leaving market optimism hanging by a thread as US-China trade tensions remain the key antagonist to the global growth outlook.
Dollar traders look ahead to June US jobs report
The Dollar index (DXY) is steadying around the 96.7 mark at the time of writing, with Friday’s non-farm payrolls (NFP) data set to trigger the next major move in the Dollar. The June US jobs data, to be announced after the 4th of July holiday, is expected to show 164,000 new jobs being added last month, a marked improvement from May’s dismal 75,000 print.
The latest employment data will be used by investors to ascertain how the Federal Reserve will act on its monetary policy setting during its July meeting, even as markets price in a 100 percent chance of a Fed rate cut this month. Should the upcoming US jobs report come in below market expectations, then the path for a larger-than-expected US interest rate cut becomes clearer, potentially allowing Dollar bears the chance to push the Greenback lower.
Oil prices pare losses after OPEC+ decision to extend supply cuts
Brent futures are now up 0.6 percent to trade at $62.78/bbl at the time of writing, while WTI crude is higher by 0.5 percent at $56.55/bbl, slightly blunting Tuesday’s steep drop as US inventories reportedly fell by some five million barrels last week. Oil prices are testing the floor set by the OPEC+ decision to extend its supply cuts through the first quarter of 2020, even as global manufacturing activity contracted for a second straight month in June.
Concerns over faltering demand continue to swirl in the markets, exposing Oil’s downside. Investors have yet to buy into the OPEC narrative that keeping the supply cuts at current levels for the next nine months will be enough to rebalance global markets
USD/CAD Daily Outlook
Daily Pivots: (S1) 1.3088; (P) 1.3114; (R1) 1.3130; More...
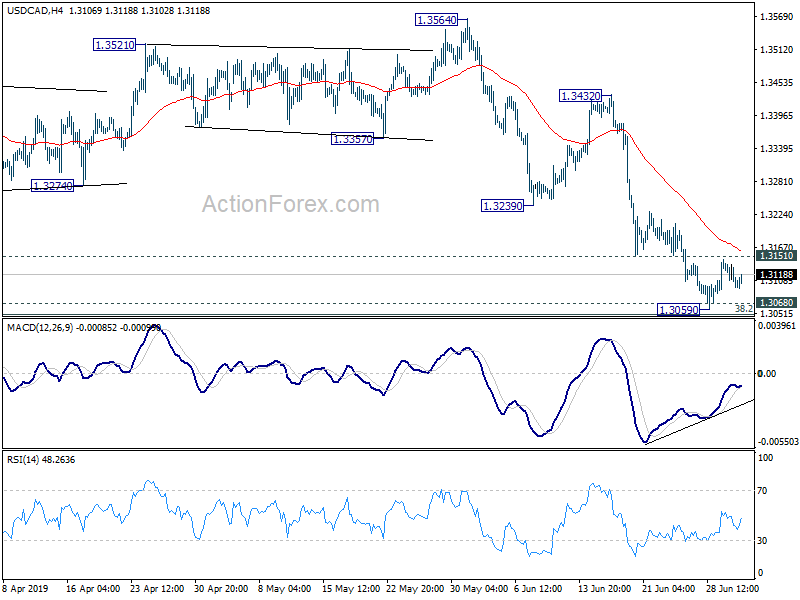
USD/CAD is staying in consolidation from 1.3059 and intraday bias remains neutral first. On the downside, decisive break of 1.3052/68 cluster support zone will carry larger bearish implication and target 1.2673 fibonacci level next. However, break of 1.3151 will indicate short term bottoming and bring rebound back to 1.3239/3432 resistance zone.
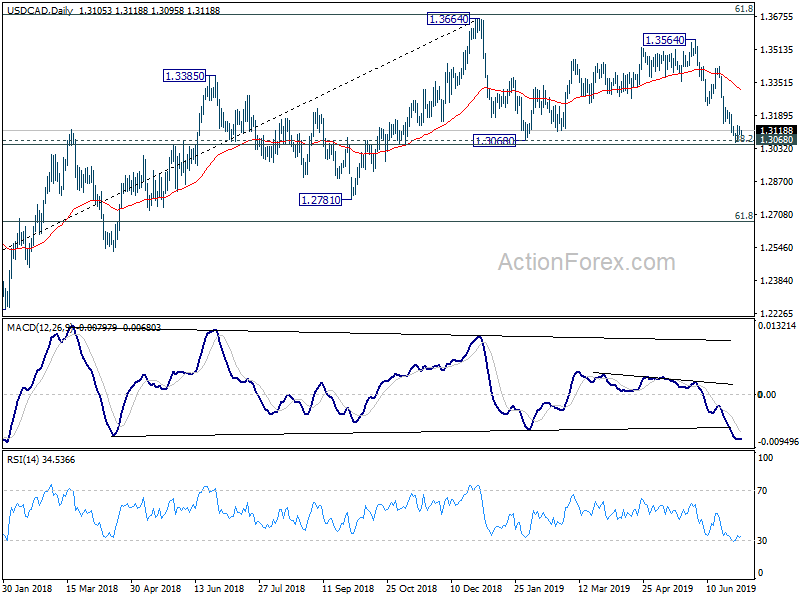
In the bigger picture, medium term outlook stays neutral for now even though the case of bearish reversal is building up. Decisive break of 1.3068 cluster support (38.2% retracement of 1.2061 to 1.3664 at 1.3052) will confirm completion of up trend from 1.2061 (2017 low). Further fall should be seen to 61.8% retracement at 1.2673 next. On the upside, sustained break of 61.8% retracement of 1.4689 (2016 high) to 1.2061 at 1.3685, is needed to confirm resumption of up trend from 1.2061 (2017 low). Otherwise, risk will stay on the downside.
The Analytical Overview Of The Main Currency Pairs
The EUR/USD currency pair
Technical indicators of the currency pair:
Prev Open: 1.12849
Open: 1.12841
% chg. over the last day: -0.02
Day's range: 1.12841 - 1.12952
52 wk range: 1.1111 - 1.2009
The EUR/USD has stabilized. Trading instrument is in a lateral movement. EUR/USD quotes test key support and resistance levels at 1.12750 and 1.13150. The financial market participants took a wait-and-see attitude until important economic releases. We recommend tracking up-to-date information regarding trade negotiations between Washington and Beijing. Positions must be opened from key levels.
The Economic News Feed for 03.07.2019:
a number of indicators on business activity in Germany and the Eurozone - 10:55 (GMT+3:00) and 11:00 (GMT+3:00), respectively;
ADP Nonfarm Employment Change (Jun)- 15:15 (GMT+3:00);
Continuing Jobless Claims - 15:30 (GMT+3:00);
ISM Non-Manufacturing Business Activity (Jun) - 17:00 (GMT+3:00).
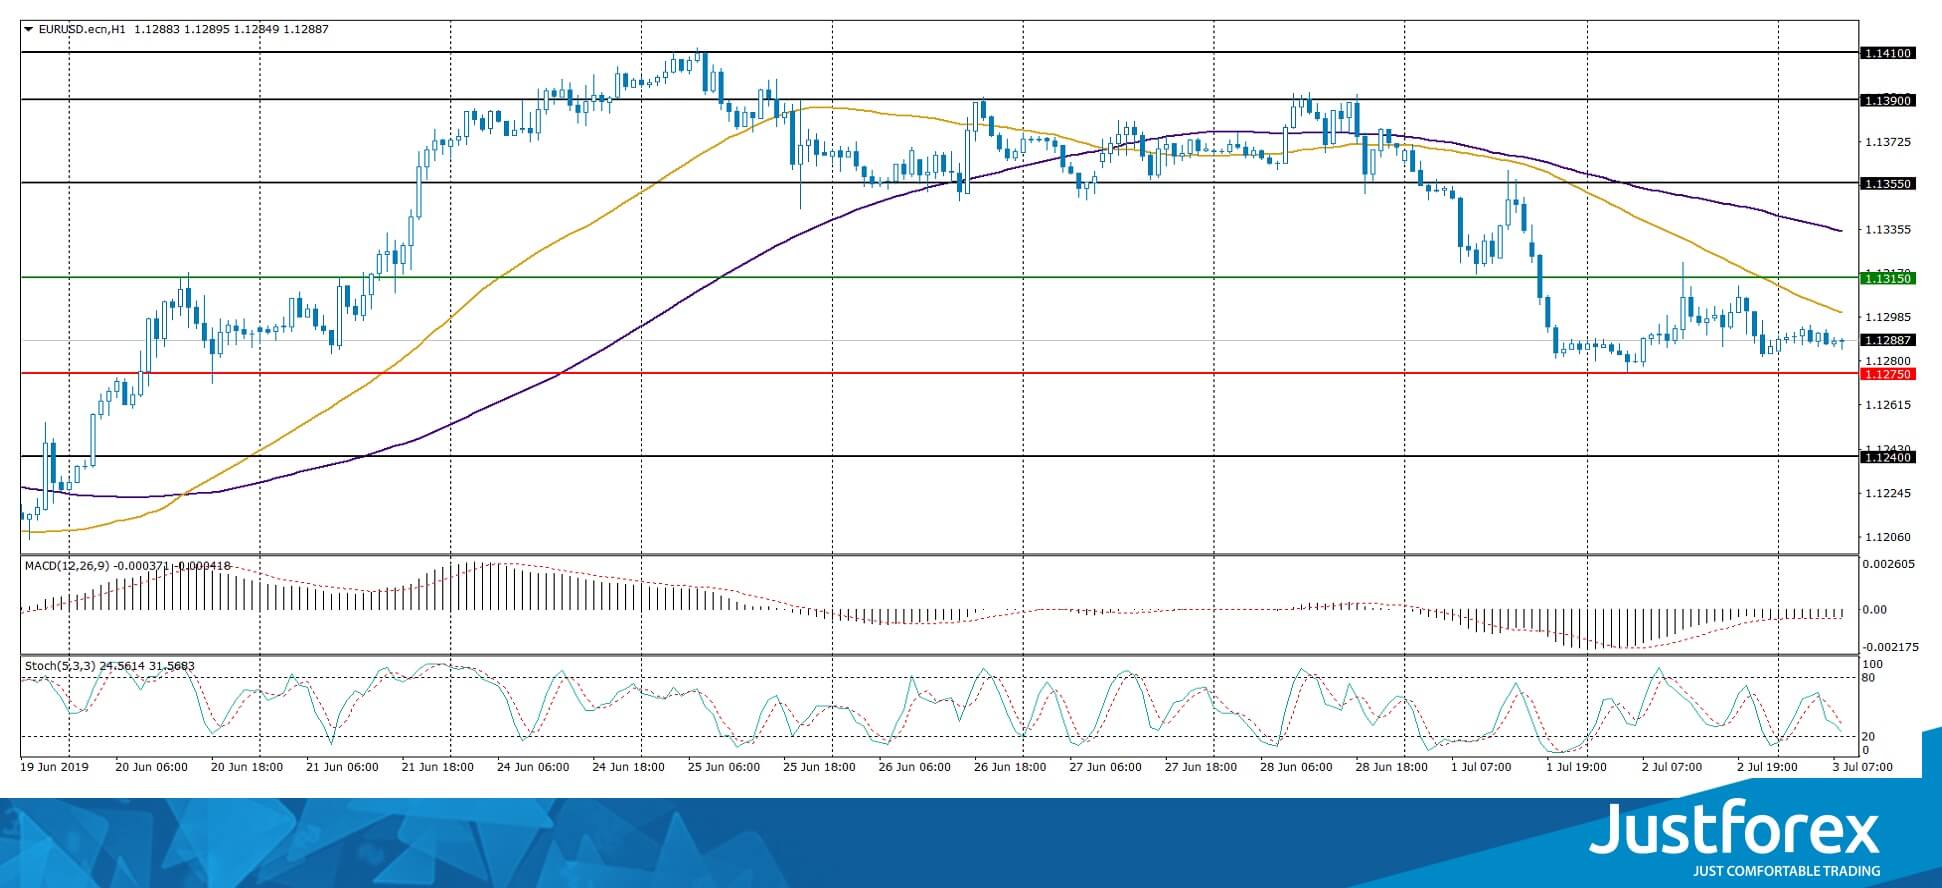
The price has fixed below 50 MA and 100 MA, which indicates the strength of the sellers.
The MACD histogram is in the negative zone, but above the signal line, which gives a weak signal to sell EUR/USD.
The Stochastic Oscillator is in the neutral zone, the %K line is below the %D line, which also indicates bearish moods.
Trading recommendations
Support levels: 1.12750, 1.12400
Resistance levels: 1.13150, 1.13550, 1.13900
If the price consolidates below the local support of 1.12750, it will soon fall toward 1.12400-1.12200.
Alternatively, the quotes can recover toward 1.13400-1.13600.
The GBP/USD currency pair
Technical indicators of the currency pair:
Prev Open: 1.26374
Open: 1.25907
% chg. over the last day: -0.34
Day's range:
52 wk range: 1.25721 - 1.25999
GBP/USD continues to show a negative trend. The trading instrument again updated local minimums. GBP remains under pressure amid weak economic reports from the UK. In June, the index of business activity in the construction sector of the country slowed to 43.1 compared with the forecast value of 49.3. At the moment, GBP / USD quotes are testing the support level of 1.25700. Round level 1.26000 is the nearest resistance. The pound has the potential to further decline. Positions must be opened from key levels.
At 11:30 (GMT+3:00) the UK will publish an index of business activity.
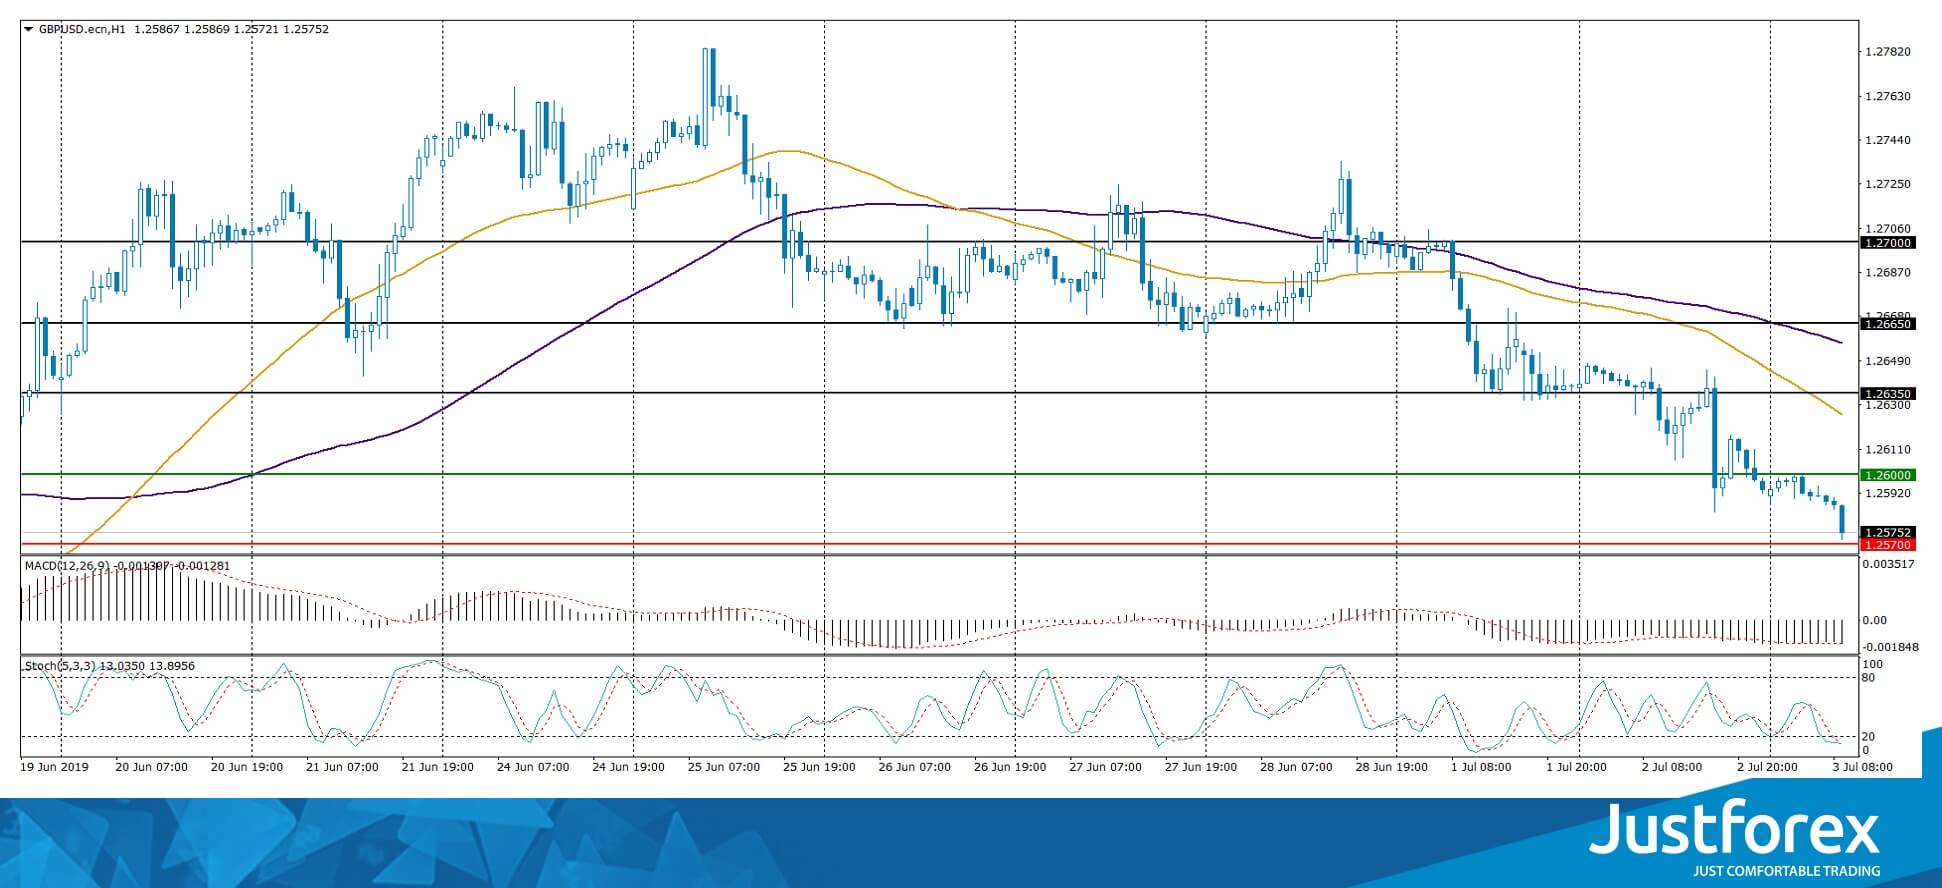
The price has fixed below 50 MA and 100 MA, which indicates the power of the sellers.
The MACD histogram is located in the negative zone and below the signal line, which gives a strong signal to sell GBP/USD.
The Stochastic Oscillator is in the oversold zone, the% K line has started to cross the% D line. There are no signals at the moment.
Trading recommendations
Support levels: 1.25700, 1.25300, 1.25000
Resistance levels: 1.26000, 1.26350, 1.26650
If the price consolidates below 1.25700, a further drop in GBP/USD quotes is expected, towards 1.25400-1.25200.
Alternatively, the quotes could grow towards 1.26300-1.26500.
The USD/CAD currency pair
Technical indicators of the currency pair:
Prev Open: 1.31331
Open: 1.31055
% chg. over the last day: -0.29
Day's range: 1.30956 - 1.31136
52 wk range: 1.2727 - 1.3664
An ambiguous technical picture emerged on the USD/CAD. At the moment, Looney is consolidating in a fairly narrow range. Local levels of support and resistance are: 1.30950 and 1.31200, respectively. In the near future, correction of the USD/CAD quotes after a prolonged fall is not excluded. Additional pressure on the Canadian dollar is exerted by aggressive sales in the oil market. Today, the investors will evaluate important economic releases from the United States. Positions must be opened from key levels.
The Economic News Feed for 03.07.2019 is calm.
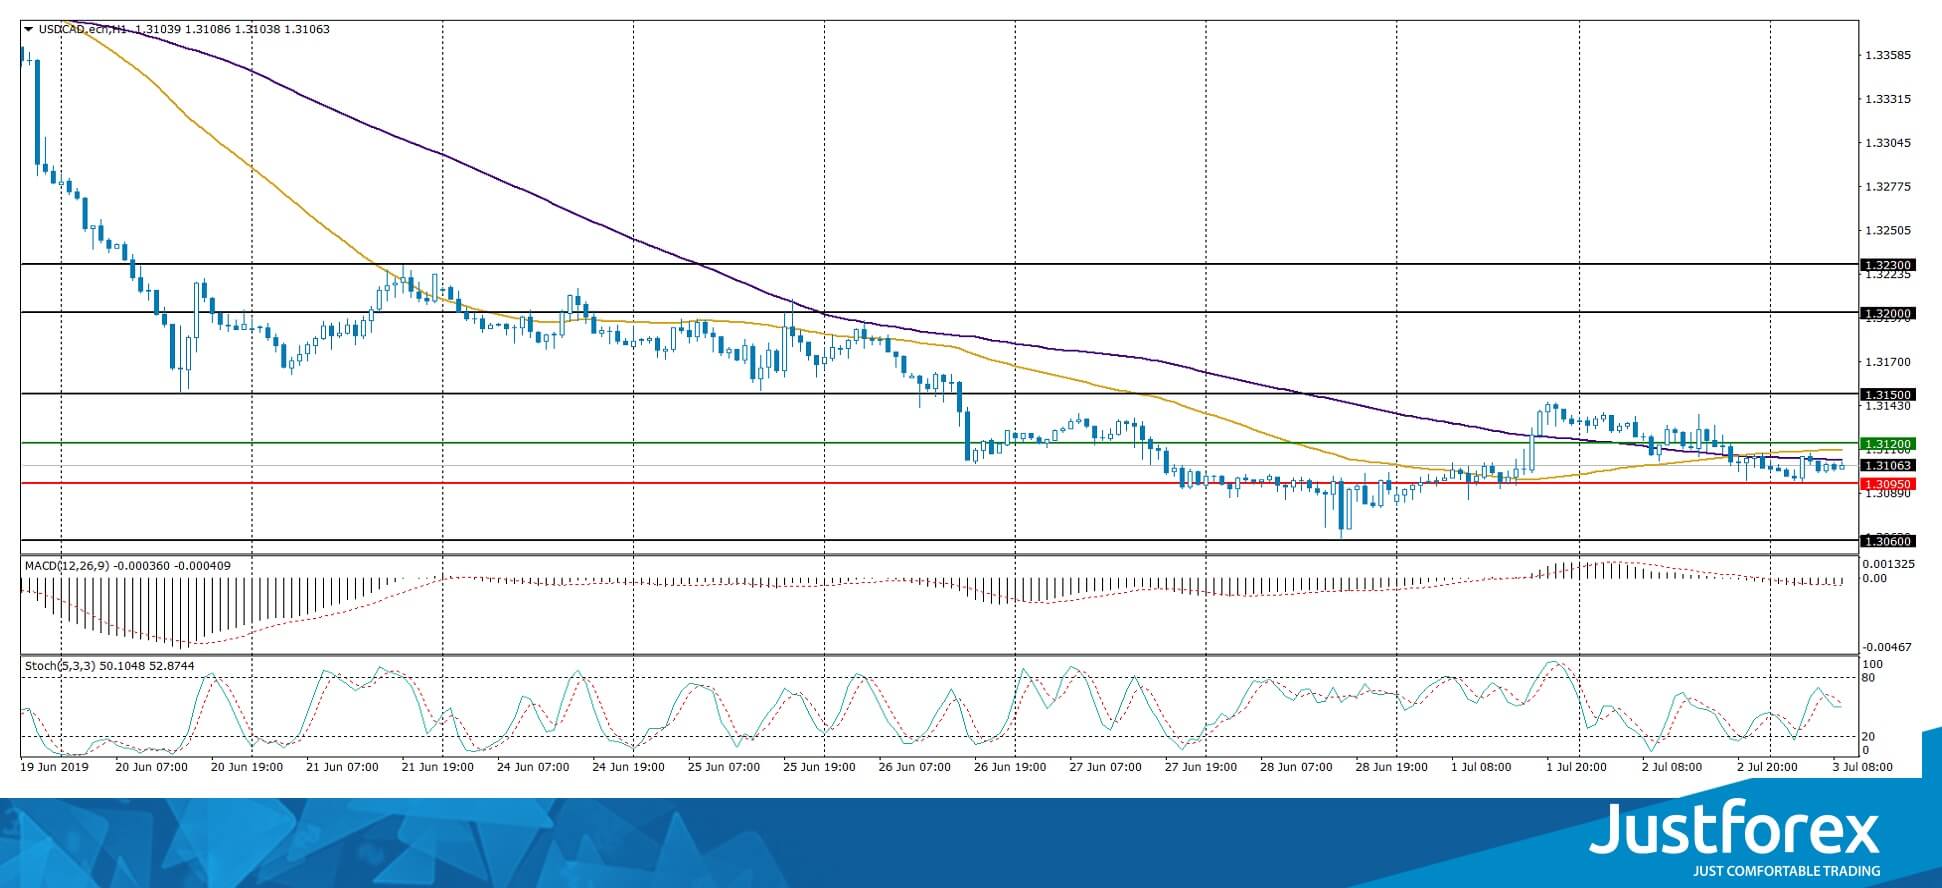
Indicators of accurate signals do not give: 50 MA crossed 100 MA.
The MACD histogram is close to the 0 mark.
The Stochastic Oscillator is in the neutral zone, the %K line has started to cross the %D line. There are no signals at the moment.
Trading recommendations
Support levels: 1.30950, 1.30600
Resistance levels: 1.31200, 1.31500, 1.32000
If the price consolidates above the level of 1.31200, the quotes can correct toward 1.31500-1.31800.
Alternatively, the quotes can fall toward 1.30700-1.30500.
The USD/JPY currency pair
Technical indicators of the currency pair:
Prev Open: 108.427
Open: 107.878
% chg. over the last day: -0.56
Day's range: 107.533 - 107.913
52 wk range: 104.97 - 114.56
The USD/JPY currency pair has gone down. During yesterday's and today's trading, the drop in quotes exceeded 80 pips. The trading instrument has established new local minima. At the moment, the safe harbor currency is consolidating. The key support and resistance levels are 107.500 and 107.850, respectively. The focus of economic reports from the United States. The technical picture signals a further drop in the USD / JPY quotes. We recommend to open positions from key levels.
The Economic News Feed for 03.07.2019 is calm.
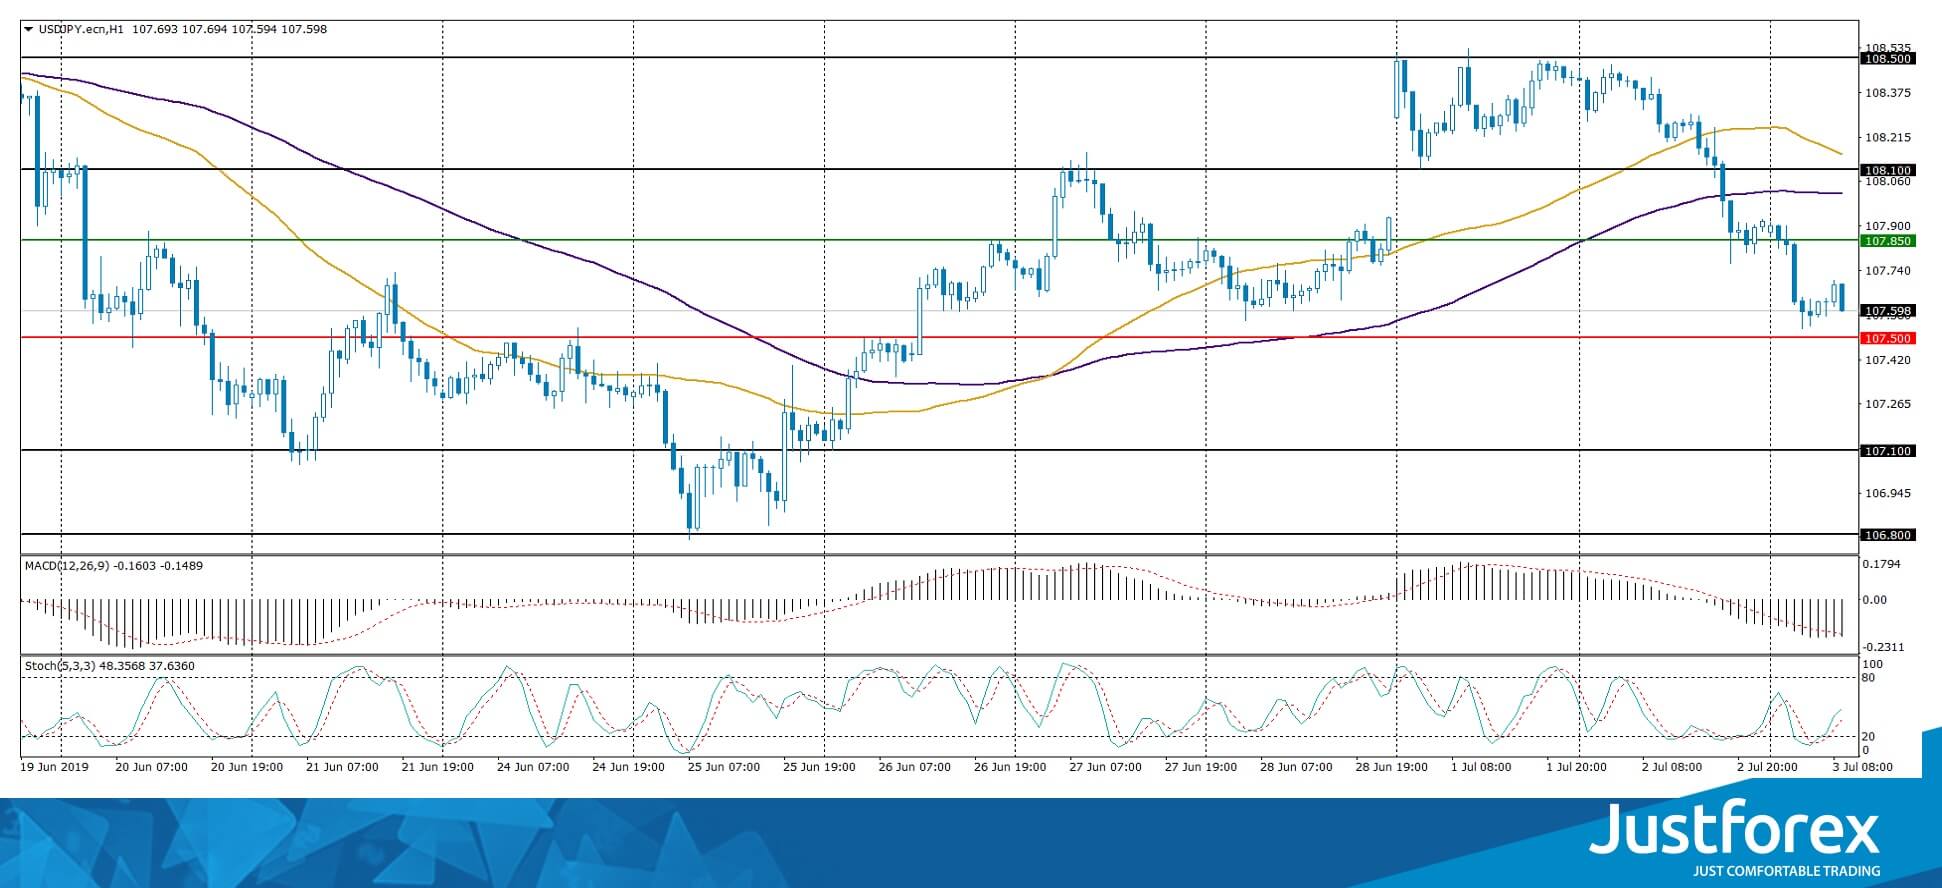
The price has fixed below 100 MA, which indicates the power of the sellers.
The MACD histogram is in the negative zone and below the signal line, which gives a strong signal to sell USD/JPY.
The Stochastic Oscillator is in the neutral zone, the %K line is above the %D line, which indicates bullish moods.
Trading recommendations
Support levels: 107.500, 107.100, 106.800
Resistance levels: 107.850, 108.100, 108.500
If the price consolidates below 107.500, the quotes can fall towards 107.200-107.000.
Alternatively the quotes can grow toward 108.100-108.300.
GBP/USD Outlook: Bears Remain Fully In Charge And Eye Key 1.2500 Support Zone
Tuesday's speech of BoE Governor Carney further soured the sentiment, keeping the pair in red for the third day.
Carney pointed at negative impact on growth, driven by trade conflict, lower than expected inflation and political uncertainty in the UK on rising risk of no-deal Brexit that keep pound under pressure.
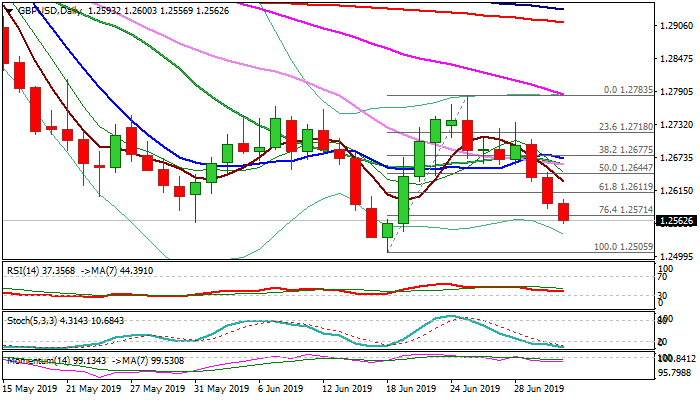
Pullback from recovery high at 1.2783 (25 Jun) broke below 1.2571 (Fibo 76.4% 1.2505/1.2783) on Wednesday, opening way towards key support at 1.2505 (18 June low, the lowest since 3 Jan).
UK Services PMI is in focus for fresh signals (Jun 51f/c vs 51 prev) with weaker than expected release to accelerate bears towards 1.2500 zone.
Rising negative momentum and bearish configuration of daily MA's, support scenario, but deeply oversold daily stochastic warns that bears may face strong headwinds on approach to 1.2505 support.
Potential upticks should stay below 1.2644 (daily Kijun-sen / base of thick 4-hr cloud) to keep bears intact.
Res: 1.2600, 1.2644, 1.2661, 1.2671
Sup: 1.2556, 1.2542, 1.2505, 1.2476
EUR/GBP Daily Outlook
Daily Pivots: (S1) 0.8931; (P) 0.8952; (R1) 0.8983; More...
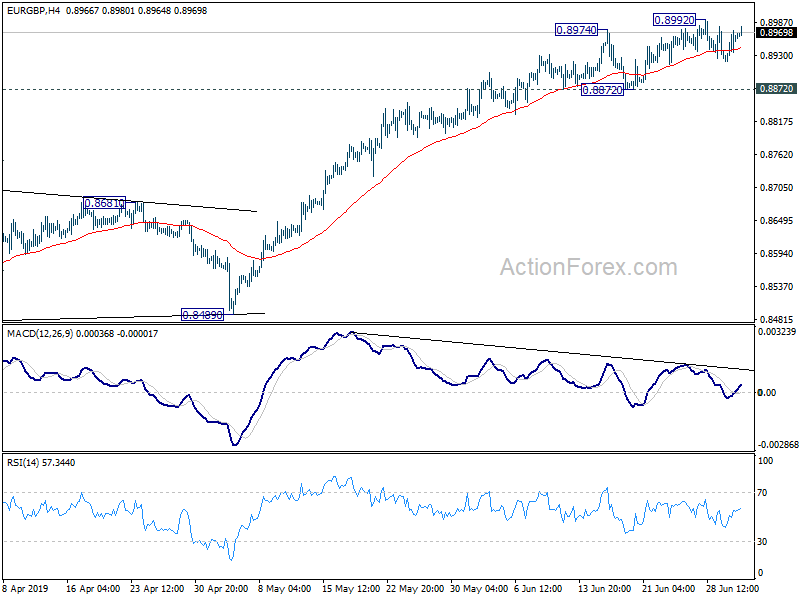
Intraday bias in EUR/GBP stays neutral and consolidation from 0.8992 might extend. . Further rise is expected as long as 0.8872 resistance holds. But considering bearish divergence condition in 4 hour MACD, we'd look for topping signal as it approaches 0.9101 key resistance. On the downside, break of 0.8872 will indicate short term topping. Deeper pull back could be seen to 55 day EMA (now at 0.8825) first.
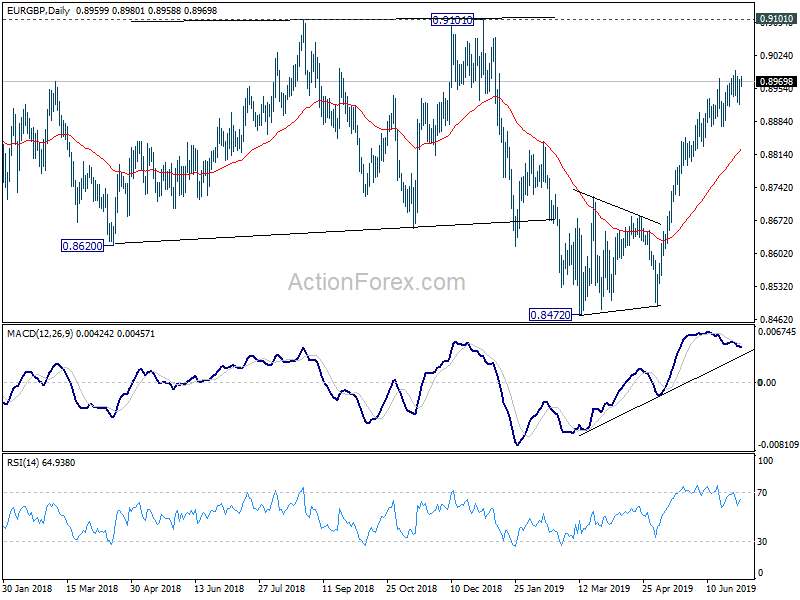
In the bigger picture, medium term decline from 0.9305 (2017 high) is seen as a corrective move. No change in this view. Current development argues that it might have completed with three waves down to 0.8472, just ahead of 38.2% retracement of 0.6935 (2015 low) to 0.9306 at 0.8400, after hitting 55 month EMA (now at 0.8527). Decisive break of 0.9101 resistance will confirm this bullish case. Nevertheless, as EUR/GBP is still staying inside long term falling channel, correction from 0.9305 could still extend to 0.8400 fibonacci level before completion, if upside is rejected by 0.9101.
Gold Pares Losses On EU Tariff Threats
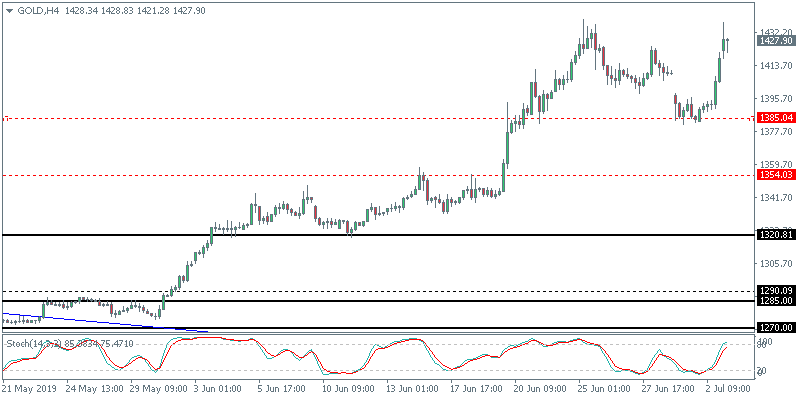
Gold prices pared losses from earlier this week as the precious metal reversed to close bullish on Tuesday. This sent gold prices briefly higher to test the six year high established few days ago. The reversal in gold prices comes amid renewed threats on trade against the EU. This curbed investor sentiment earlier this week when the US and China called for a truce to trade wars.
Will Gold Breakout Higher?
The current reversal in gold prices means that we see a consolidation taking place. Unless the precious metal breaks out higher above 1431, we could see some pullback. The lower support is formed at the reversal area of 1385. This support could potentially stall the declines in the short term
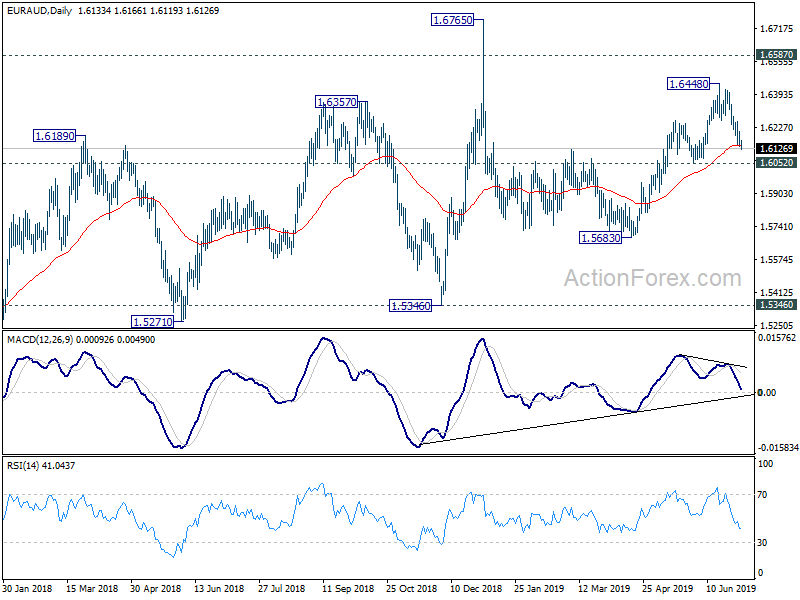
EUR/AUD Daily Outlook
Daily Pivots: (S1) 1.6112; (P) 1.6160; (R1) 1.6185; More...
EUR/AUD's pull back from 1.6448 is in progress and could extend lower. We'd still expect downside to be contained above 1.6052 support to bring rise resumption. On the upside, above 1.6259 minor resistance will turn bias to the upside for 1.6448 first. Break of 1.6448 will resume the rally from 1.5683 and target 1.6765 high. However, firm break of 1.6052 support will near term outlook bearish for 1.5683 support again.
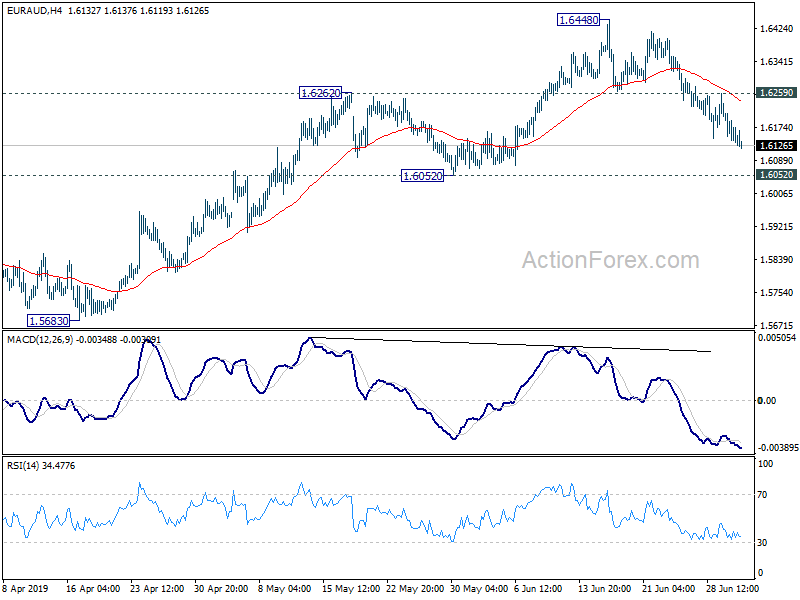
In the bigger picture, as long as 1.5346 support holds, outlook will still remain bullish. Up trend from 1.1602 (2012 low) is expected to resume sooner or later. Break of 1.6765 will target 61.8% retracement of 2.1127 (2008 high) to 1.1602 at 1.7488 next. However, firm break of 1.5346 key support will indicate trend reversal and turn outlook bearish.
UK Construction PMI Falls Sharply In June
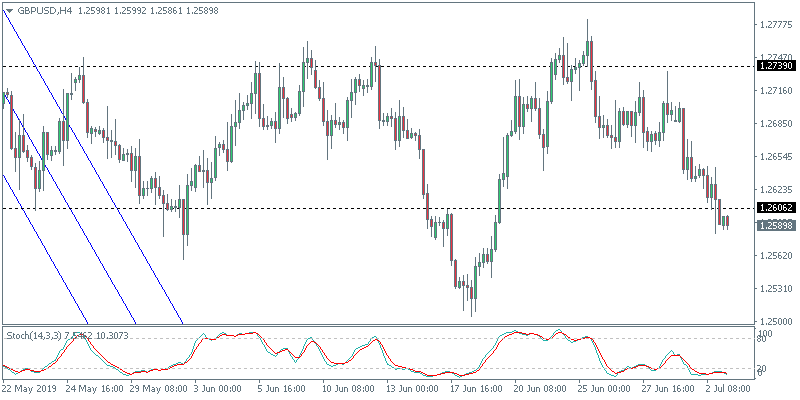
The monthly construction PMI survey from IHS Markit saw construction activity falling sharply. Data showed that construction activity slipped to 43.1 in June from 49.4 in May. The data follows weak results in manufacturing which fell to 48.0 in June. The Bank of England Governor, Mark Carney cautioned of the downside risks to the sterling due to Brexit and the global trade wars.
GBPUSD Forming Inverse Head & Shoulders?
The currency pair has established a strong resistance level at 1.2739. Failing to breakout from this level after multiple tests, the GBPUSD has extended declines. If the current declines form a modestly higher low, then this would validate the inverse head and shoulders pattern. A breakout from the neckline resistance of 1.2739 could potentially open the way for some gains in the GBPUSD currency pair.
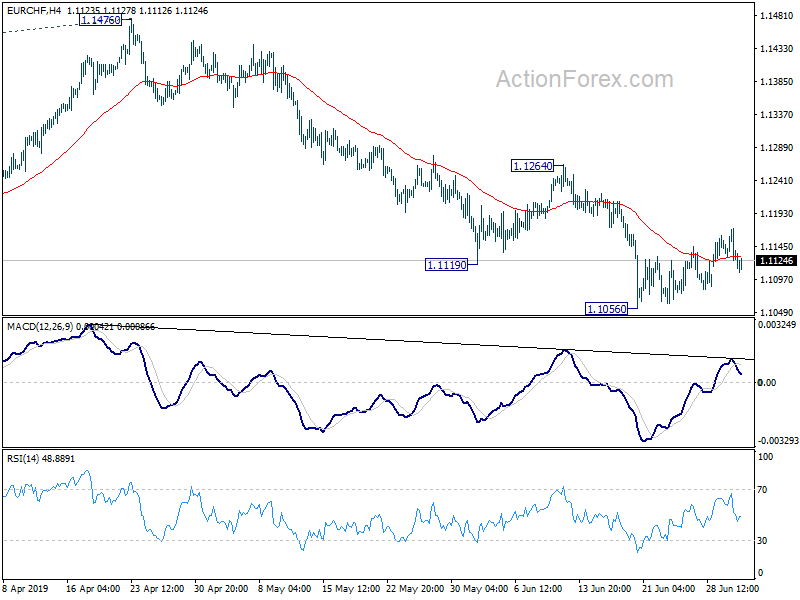
EUR/CHF Daily Outlook
Daily Pivots: (S1) 1.1113; (P) 1.1143; (R1) 1.1160; More...
No change in EUR/CHF's outlook as consolation from 1.1056 is still in progress. Intraday bias remains neutral first. In case of another recovery, upside should be limited below 1.1264 resistance to bring fall resumption. On the downside, break of 1.1056 will extend the larger down trend for 61.8% projection of 1.2004 to 1.1173 from 1.1476 at 1.0962 next.
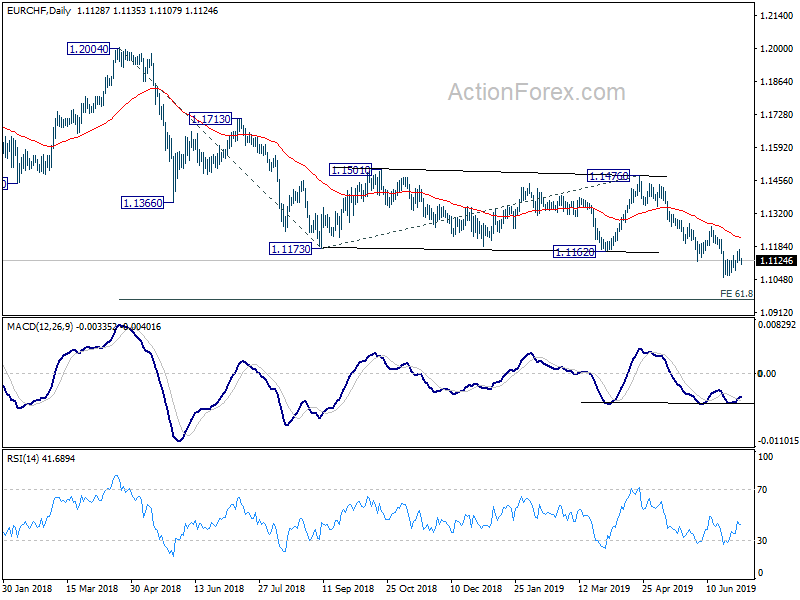
In the bigger picture, current development firstly suggests that down trend from 1.2004 is still in progress. More importantly, it's likely a long term down trend itself, rather than a correction. Outlook will remain bearish as long as 1.1476 resistance holds. EUR/CHF could target 1.0629 support and below.
Euro Muted
The euro traded a bit volatile but closed the day flat. This came after the markets digested the fresh tariff threats from Washington against the EU. The US was reportedly building a list of products to hike tariffs on, in retaliation for the EU subsidies given to Airbus, the European planemaker. On the economic front, Germany’s retail sales fell 0.6%.
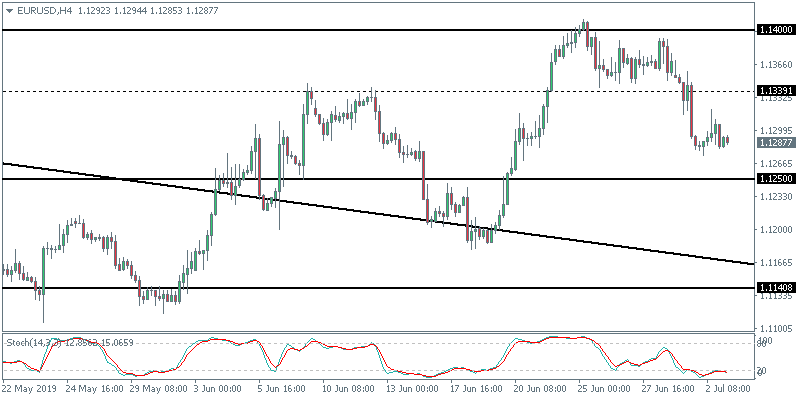
EURUSD Could Fall to 1.1250
The currency pair managed to rebound off the initial lows formed at 1.1282. However, this rebound led to a lower high forming. Currently, we see the minor support forming at 1.1282. A break down below this level will push the EURUSD down to test the 1.1250 level of support. Overall, the EURUSD is back trading within the range of 1.1400 and 1.1200.