Sample Category Title
GBP/USD Outlook: Sterling Extends Weakness After Downbeat UK Data
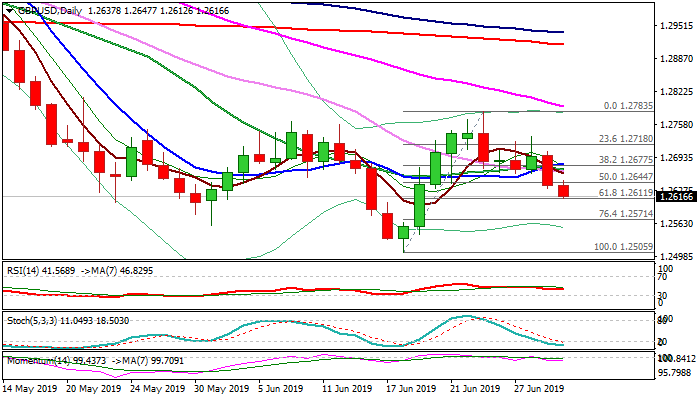
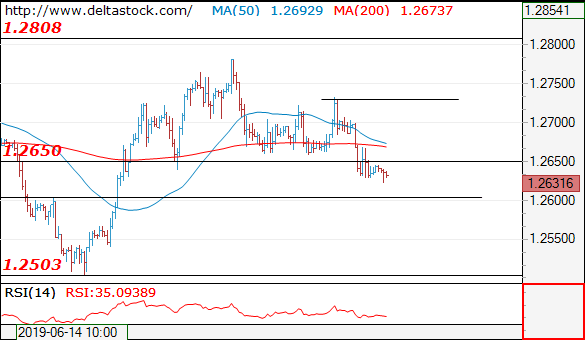
Cable remains in red on Tuesday and extends weakness after Monday's fall on downbeat UK Manufacturing PMI (June 48.0 vs 49.2 f/c) and close below three-day congestion that generated bearish signal.
Sterling came under fresh pressure from much weaker than expected UK construction PMI data (June 43.1 vs 49.3 f/c) that marks the weakest result since April 2009.
Fresh bears cracked key Fibo support at 1.2612 (61.8% of 1.2505/1.2783 upleg), with firm break here to confirm reversal and unmask key support at 1.2505 (18 June low, the lowest since 3 Jan).
Daily MA's are in bearish setup and momentum is negative that supports scenario, however, oversold stochastic may slow bears.
Cluster of converged MA's at 1.2661/81 zone is expected to cap extended upticks and maintain bearish bias.
Res: 1.2647, 1.2661, 1.2681, 1.2705
Sup: 1.2612, 1.2571, 1.2542, 1.2505
Forex Technical Analysis: EUR/USD, USD/JPY, GBP/USD
EUR/USD
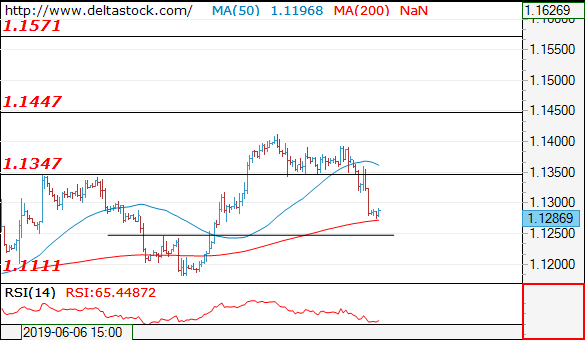
Current level - 1.1286
I favor a reversal above 1.1250 to trigger a rise through the crucial 1.1350, en route to 1.1450 resistance zone. Minor intraday hurdle lies at 1.1320.
| Resistance | Support | ||
| intraday | intraweek | intraday | intraweek |
| 1.1350 | 1.1570 | 1.1250 | 1.1110 |
| 1.1410 | 1.1820 | 1.1250 | 1.1010 |
USD/JPY
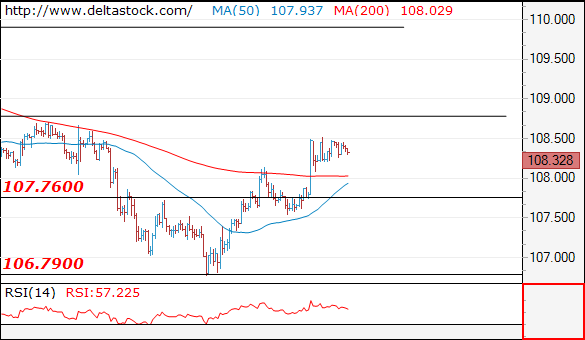
Current level - 108.32
The uptrend remains intact above 108.10, for a rise through 108.80, towards 109.80.
| Resistance | Support | ||
| intraday | intraweek | intraday | intraweek |
| 108.80 | 109.80 | 108.10 | 106.70 |
| 109.80 | 112.40 | 107.50 | 104.50 |
GBP/USD
Current level - 1.2631
My outlook is counter-trend, for a reversal above 1.2600 and break through 1.2730 crucial high, en route to 1.2880.
| Resistance | Support | ||
| intraday | intraweek | intraday | intraweek |
| 1.2730 | 1.2890 | 1.2600 | 1.2503 |
| 1.2810 | 1.3170 | 1.2600 | 1.2420 |
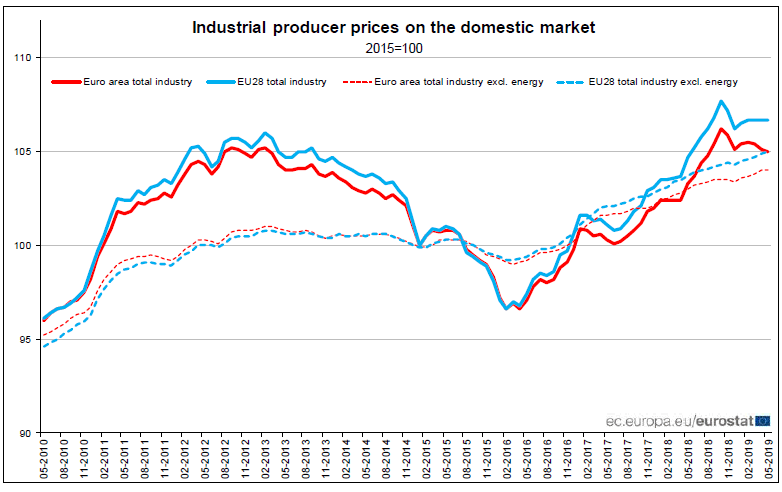
Eurozone PPI -0.1% mom, 1.6% yoy in May
Eurozone PPI came in at -0.1% mom, 1.6% yoy in May, versus expectation of 0.1% mom, 1.8% yoy. In April, PPI was at -0.3% mom, 2.6% yoy.
Comparing by main industry grouping, PPI dropped -0.6% mom in energy sector and by -0.1% mom in intermediate goods. PPI rose 0.1% mom in capital goods and durable consumer goods, and by 0.2% in non-durable consumer goods. Prices in total industry excluding energy was flat.
German retail sales dropped -0.6% mom in May, 10-year bund yield hits new record low
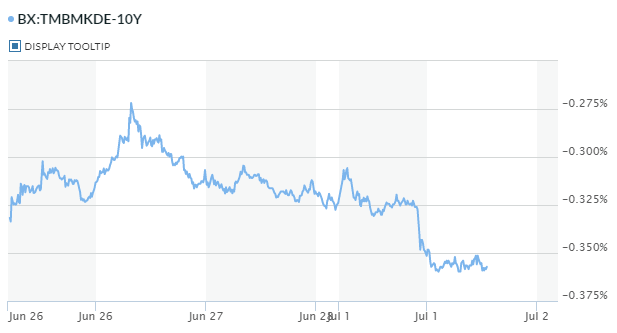
German retail sales dropped -0.6% mom in May, well below expectation of 0.5% mom. Compared with 2018, for the first fives months of the year, retail sales rose 2.8% in real terms. The weak data dampened hope that domestic demand could offset the drag from global trade on the export-led economy. Euro is steady after the release. But German 10-year bund yield is extending recent record run, hitting as low as -0.362 so far today.
USD/JPY Outlook: Bulls Stay On Hold While 30DMA Caps, Risk Of Deeper Pullback Exists
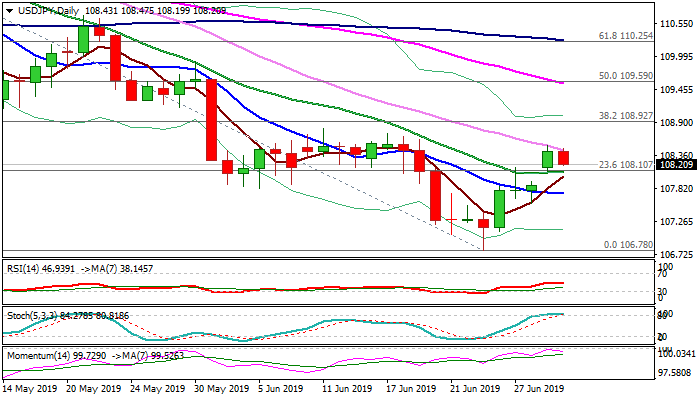
The pair eases in early European trading on Tuesday after falling 30SMA (currently at 108.44) repeatedly capped advance that was accelerated on Monday on US/China ceasefire agreement.
Bulls lose traction despite Monday's close above pivotal 20SMA barrier (108.08), as momentum remains negative on daily chart and stochastic is overbought, adding to negative signals.
Return below 20SMA would risk filling Monday's gap that would weaken near-term structure, with break below 10SMA (107.72) needed to confirm reversal.
Only close above 30SMA would revive bulls, but sustained break above key barriers at 108.80/92 (11 June lower top/Fibo 38.2% of 112.40/106.78) is needed to confirm bullish signal.
Res: 108.44, 108.53, 108.80, 108.92
Sup: 108.08, 107.93, 107.72, 107.56
Risk Sentiment Cautious As Trade Truce Paints Illusion Of Market Stability
Some semblance of stability returned to financial markets yesterday as investors breathed a collective sigh of relief after US-China trade talks during the G20 summit ended on a positive note over the weekend.
Global sentiment brightened with “risk-on” making a return after the United States and China agreed to restart trade negotiations. A sense of optimism over both sides finding a middle ground on trade is likely to distract market players away from geopolitical risk factors. However, given how the implemented tariffs are denting global growth and still remain unresolved – nothing much has changed. With the underlying factors weighing on investor confidence still in play, this illusion of market stability may be tested as the second half of 2019 gets under way.
Dollar cheers US-China trade truce
The Dollar’s aggressive appreciation on Monday confirms thatthe currency remains extremely sensitive and reactive to speculation around a potential US interest rate cut this year.
A trade truce between the United States and China is positive for global sentiment and removes some element of uncertainty over trade. The Federal Reserve is unlikely to pull the rate cut trigger as tensions ease between the two largest economiesand this hesitance is good for King Dollar.
Looking at the technical picture, the Dollar Index is trading marginally above 96.70 as of writing. The upside momentum is likely to send prices towards 97.00 in the near term. Should market expectations continue cooling over the Fed cutting interest rates, the Dollar Index has the potential to blast through 97.00.
Reserve Bank of Australia cuts rates to historic low
The drum beat of central banks showing a willingness to ease monetary policy beat louder this morning after the Reserve Bank of Australia (RBA) cut interest rates to a fresh record low of 1% - down from 1.25% last month.
This means that in the space of four weeks, interest rates in Australia havedecreasedfrom 1.5% to 1.0%. Should the rate cuts fail to revive household spending and stimulate economic growth, the RBA could pull the trigger once again this year.
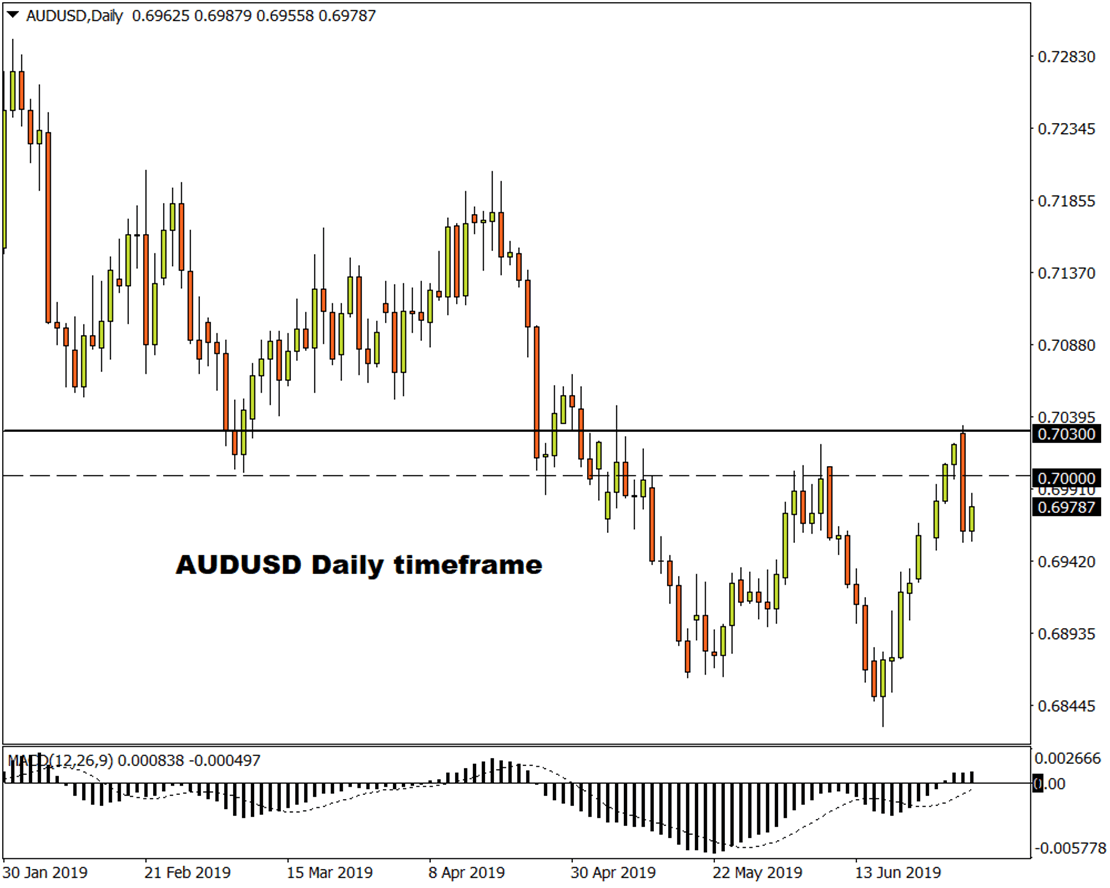
In regards to the technical picture, the AUDUSD pushed higher despite the rate cut with prices trading around 0.6980. An intraday breakout above 0.7000 could open the doors towards 0.7030.
Elliott Wave Update: EUR/USD And GBP/USD At Support! Gains Expected!
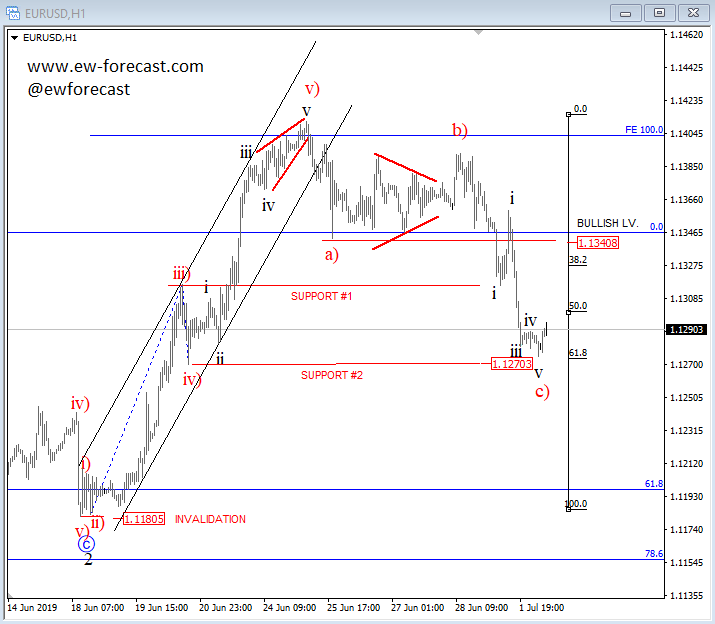
EURUSD is trading right at projected and important 61,8% Fibo. support level, but keep in mind that bulls can only be confirmed if price turns back above 1.1340 region. At the same time we see something similar on cable, where price is approaching important support around 61.8% Fibo. retracement and 1.2600 area. That being said, watch out for a bullish turn that can be suggesting USD weakness, but only a strong five-wave bounce would be a signal for a completed correction within the uptrend.
EURUSD, 1h
GBPUSD, 1h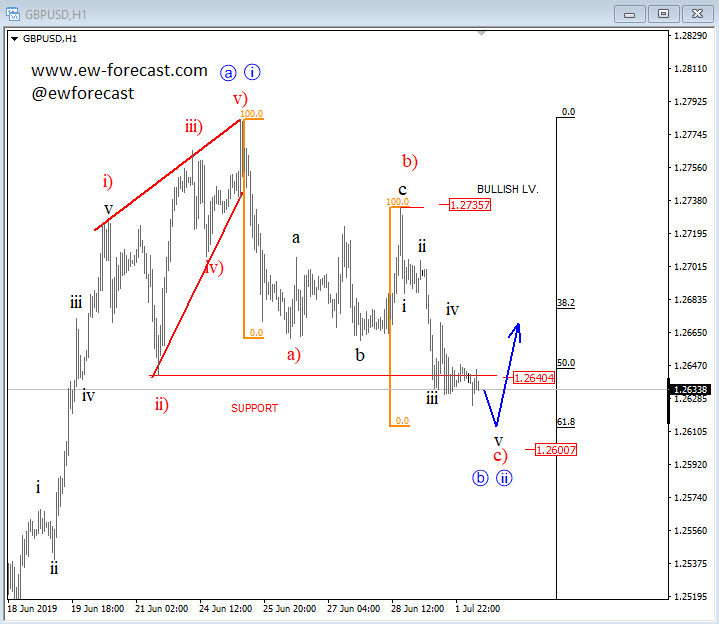
GBP/JPY Daily Outlook
Daily Pivots: (S1) 136.59; (P) 137.19; (R1) 137.63; More...
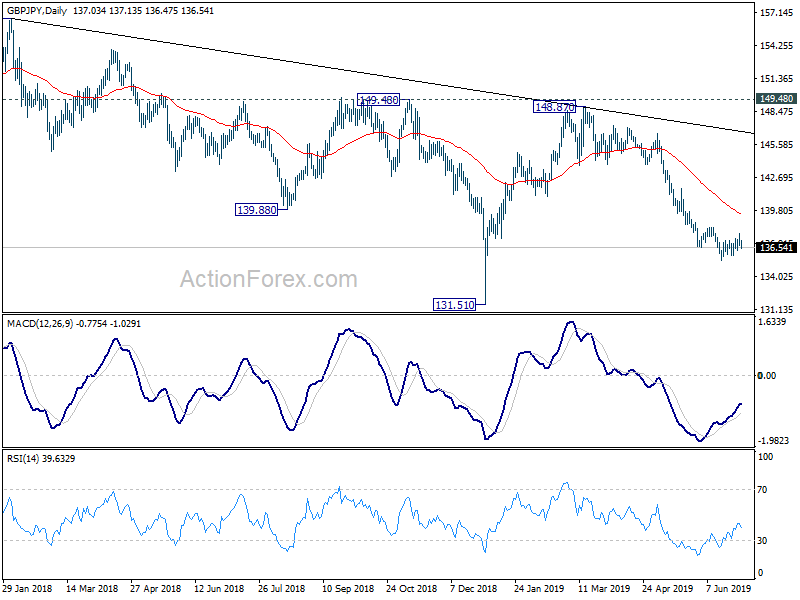
GBP/JPY is staying in consolidation from 135.38 and intraday bias remains neutral first. In case of another recovery, upside should be limited by 138.32 resistance to bring fall resumption. On the downside, break of 135.38 will extend recent fall from 148.87 to retest 131.51 low. Though, firm break of 135.38 will confirm short term bottoming and bring stronger rebound to 55 day EMA (now at 139.43) and above.
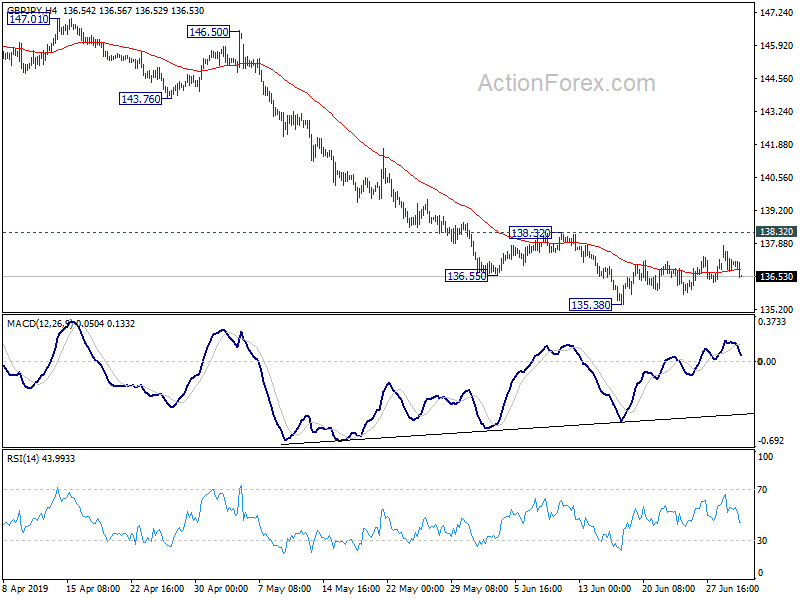
In the bigger picture, current development suggests that GBP/JPY's medium term fall from 156.59 (2018 high) is still in progress. Break of 131.51 will target 122.36 (2016 low). Structure of such decline is corrective looking so far, arguing that it's just the second leg of consolidation from 122.36. Thus, we'd expect strong support from 122.36 to contain downside to bring reversal.
EUR/JPY Daily Outlook
Daily Pivots: (S1) 122.04; (P) 122.69; (R1) 123.03; More....
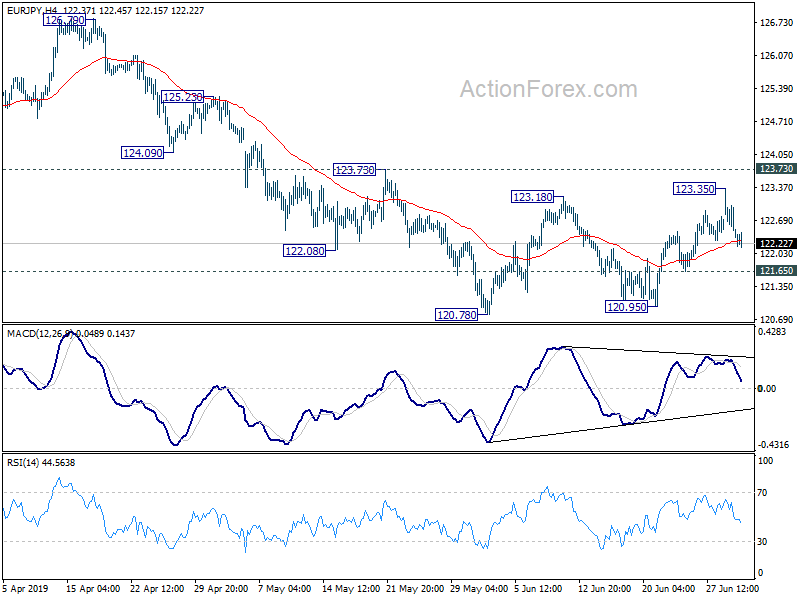
EUR/JPY is staying in consolidation from 120.78 and intraday bias remains neutral first. Another rise cannot be ruled out. But upside should be limited by 123.73 resistance to bring larger fall resumption. On the downside, below 121.65 minor support will turn bias to the downside for 120.78 low. Decisive break there will resume the decline from 127.50 and target 118.62 low next.
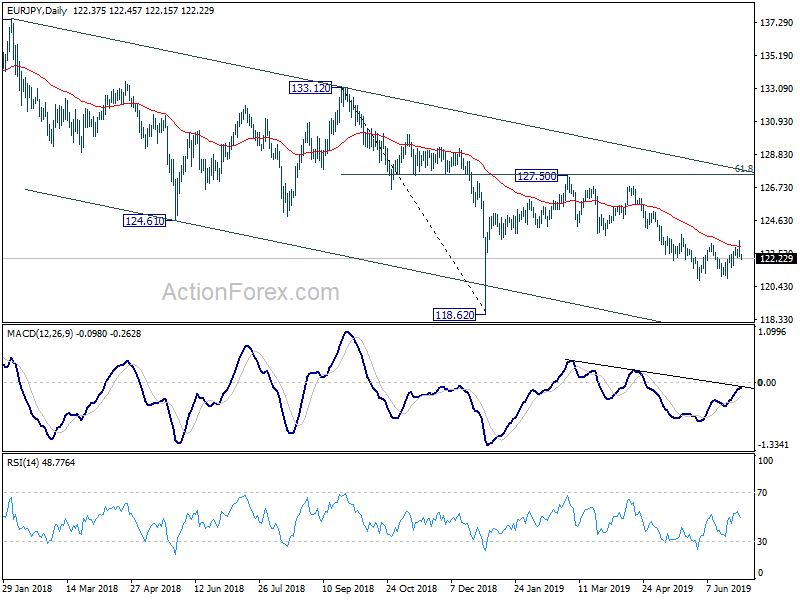
In the bigger picture, down trend from 137.49 is still in progress with the cross staying inside long term falling channel. Break of 118.62 will extend the fall to 109.48 (2016 low). On the upside, break of 127.50 resistance is needed to be the first sign of medium term reversal. Otherwise, outlook will remain bearish in case of strong rebound.
WTI Futures Remain Above 50.0% Fibo, MACD Signals Negative Divergence
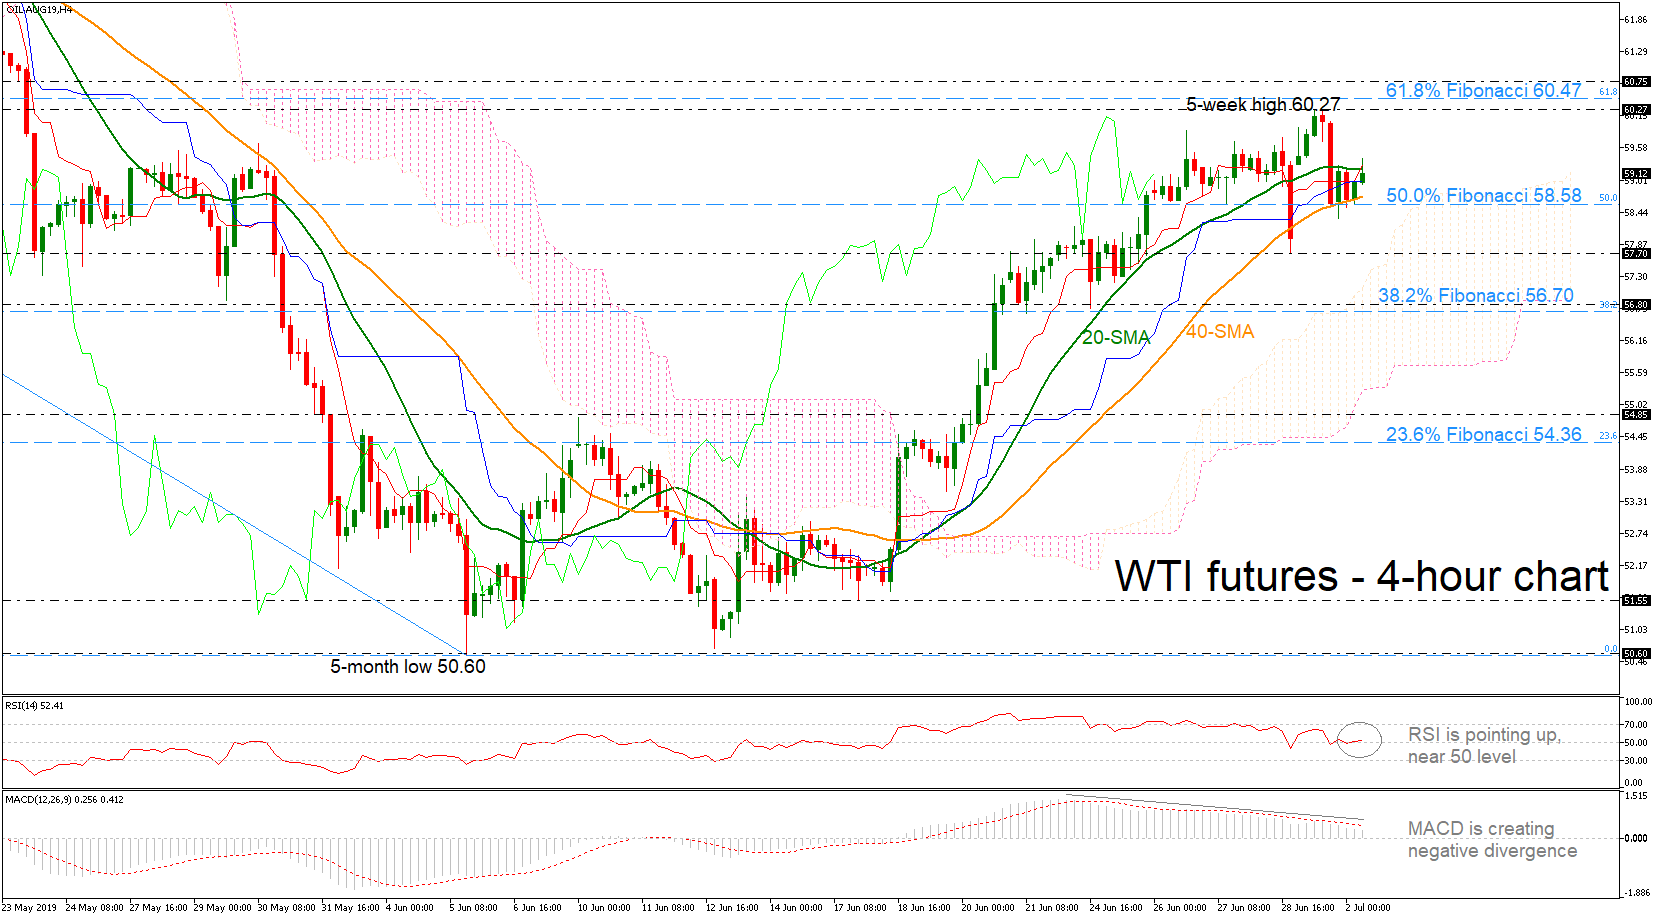
WTI crude oil futures are on course to jump above the 20-simple moving average (SMA) after they found crucial support at the 50.0% Fibonacci retracement level of the downleg from 66.60 to 50.60 near 58.58 over the last sessions.
Having a look at the technical indicators, the MACD oscillator is creating a bearish divergence as it is slipping at the same time that prices are moving higher in the 4-hour chart, suggesting a possible negative correction soon. However, the RSI indicator is pointing upwards marginally above the 50 threshold.
The next resistance is being provided by the five-week high of 60.27 and the 61.8% Fibonacci of 60.47. If prices rise higher again, the 60.75 barrier, taken from the low on May 13 could come in focus.
In case of a downward attempt, oil prices would likely meet support at the 50.0% Fibo (58.58) again, easing upside pressure. A break below this strong hurdle could open the door for a retest of the 57.70 obstacle and the Ichimoku cloud, signaling the start for a potential neutral phase in the very short-term.
Summarizing, WTI crude oil futures have been in a bullish mode over the last three weeks, following the rebound on the 50.60 support barrier. A bearish correction is possible if there is a drop below the 50.0% Fibo, while a climb above the 61.8% Fibo would endorse the bullish picture.