Sample Category Title
EUR/GBP Daily Outlook
Daily Pivots: (S1) 0.8909; (P) 0.8945; (R1) 0.8964; More...
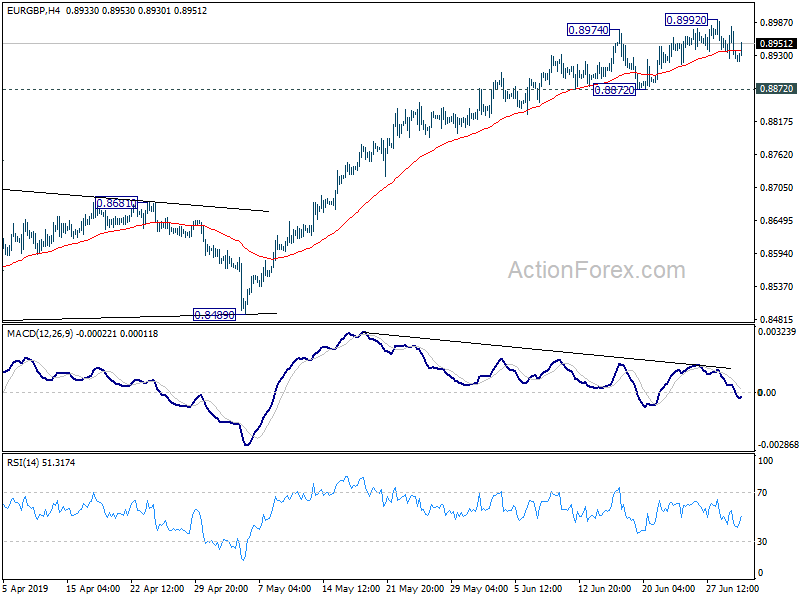
No change in EUR/GBP's outlook and intraday bias remains neutral for more consolidations below 0.8992. Further rise is expected as long as 0.8872 resistance holds. But considering bearish divergence condition in 4 hour MACD, we'd look for topping signal as it approaches 0.9101 key resistance. On the downside, break of 0.8872 will indicate short term topping. Deeper pull back could be seen to 55 day EMA (now at 0.8819) first.
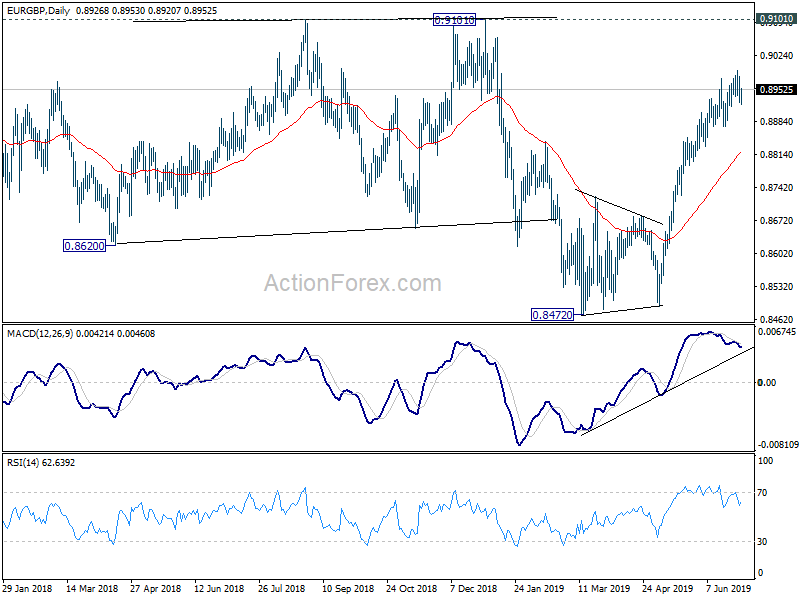
In the bigger picture, medium term decline from 0.9305 (2017 high) is seen as a corrective move. No change in this view. Current development argues that it might have completed with three waves down to 0.8472, just ahead of 38.2% retracement of 0.6935 (2015 low) to 0.9306 at 0.8400, after hitting 55 month EMA (now at 0.8527). Decisive break of 0.9101 resistance will confirm this bullish case. Nevertheless, as EUR/GBP is still staying inside long term falling channel, correction from 0.9305 could still extend to 0.8400 fibonacci level before completion, if upside is rejected by 0.9101.
EUR/AUD Daily Outlook
Daily Pivots: (S1) 1.6159; (P) 1.6210; (R1) 1.6254; More...
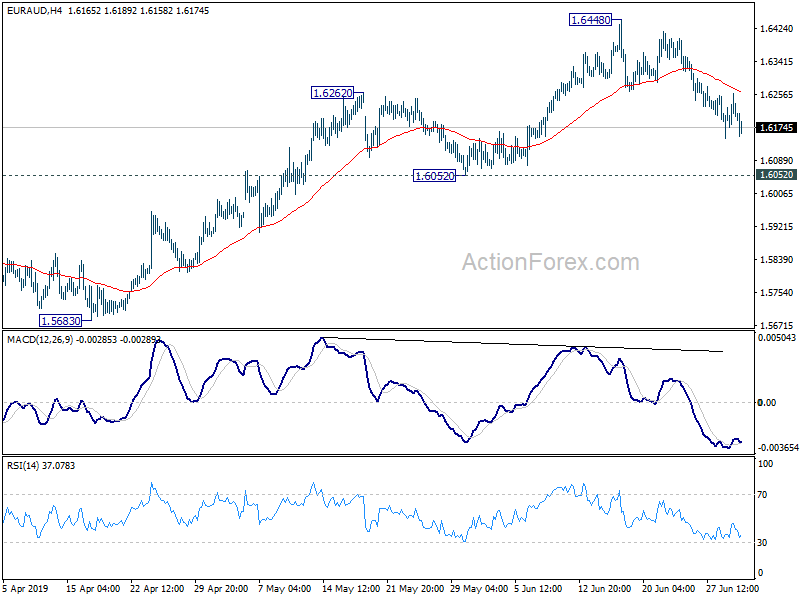
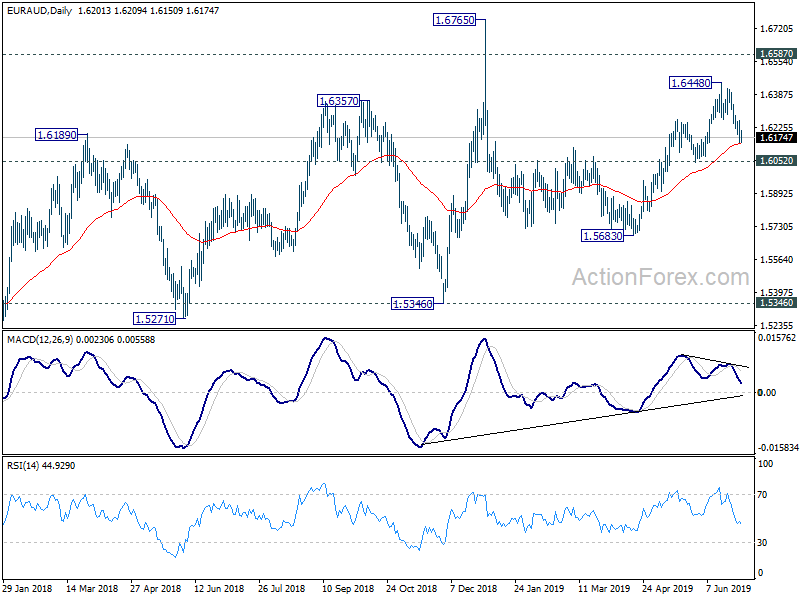
No change in EUR/AUD's outlook as corrective pull back from 1.6448 is in progress. We'd expect downside to be contained above 1.6052 support to bring rise resumption. On the upside, break of 1.6448 will resume the rally from 1.5683 and target 1.6765 high. However, firm break of 1.6052 support will near term outlook bearish for 1.5683 support again.
In the bigger picture, as long as 1.5346 support holds, outlook will still remain bullish. Up trend from 1.1602 (2012 low) is expected to resume sooner or later. Break of 1.6765 will target 61.8% retracement of 2.1127 (2008 high) to 1.1602 at 1.7488 next. However, firm break of 1.5346 key support will indicate trend reversal and turn outlook bearish.
EUR/CHF Daily Outlook
Daily Pivots: (S1) 1.1124; (P) 1.1143; (R1) 1.1166; More...
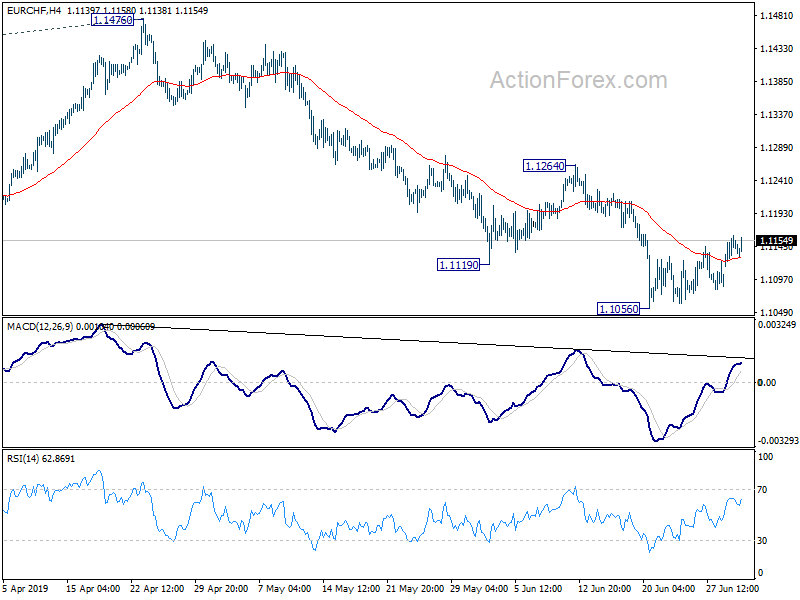
EUR/CHF's consolidation from 1.1056 is still extending and intraday bias remains neutral. Upside of recovery should be limited below 1.1264 resistance to bring fall resumption. On the downside, break of 1.1056 will extend the larger down trend for 61.8% projection of 1.2004 to 1.1173 from 1.1476 at 1.0962 next.
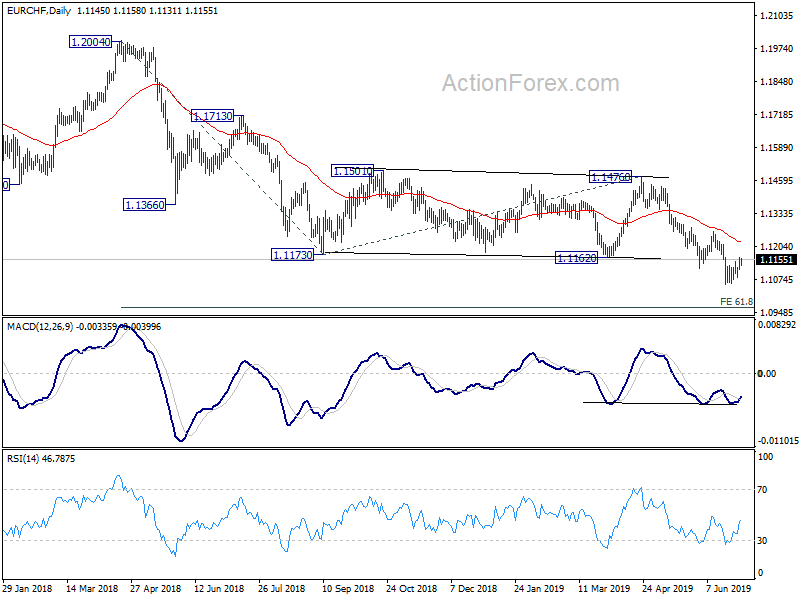
In the bigger picture, current development firstly suggests that down trend from 1.2004 is still in progress. More importantly, it's likely a long term down trend itself, rather than a correction. Outlook will remain bearish as long as 1.1476 resistance holds. EUR/CHF could target 1.0629 support and below.
AUD/USD Outlook: Holding Within Thick Daily Cloud Keeps Larger Bulls Alive
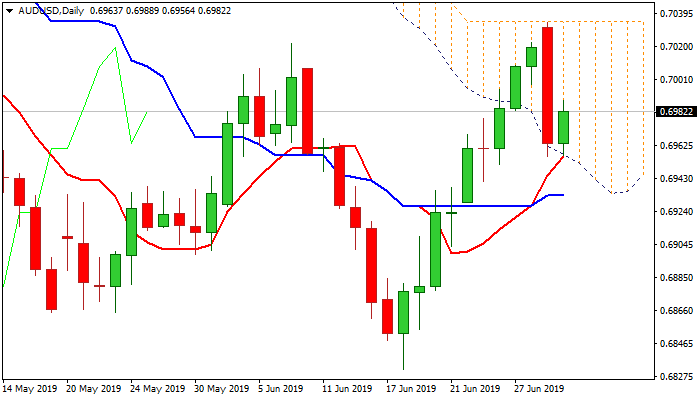
The Australian dollar bounced from 0.6956 (Monday's low, posted after the biggest one-day loss since 24 Apr) in early Asian trading on Tuesday.
Monday's pullback from new recovery high at 0.7034 (capped by daily cloud top / 100DMA) was contained by key supports at 0.6956 (daily cloud base / Fibo 38.2% of 0.6831/0.7034 / rising 10SMA).
The pair showed mild reaction on anticipated RBA rate cut by 0.25%, with rather dovish tone of the statement, as the central bank left door open for further easing.
Weaker US dollar despite the agreement between the USA and China for ceasefire and continuation of trade talks, helped Aussie's recovery.
Immediate downside risk from Monday's bearish engulfing is sidelined, with repeated close within thick daily cloud expected to keep bulls alive, as bullish momentum remains strong and offsets for now negative signals.
Return and close above psychological 0.70 barrier would add to positive signals, however, sustained break above daily cloud top / 100DMA is needed to confirm bullish continuation.
On the other side, key support at 0.6956 is still vulnerable and close below is needed to confirm reversal and open way for deeper correction of 0.6831/0.7034 upleg.
Res: 0.7000, 0.7022, 0.7035, 0.7048
Sup: 0.6956, 0.6945, 0.6933, 0.6909
RBA Cuts, But Aussie Won’t Stay Down, Dollar Recovers
- RBA reduces rates again, but aussie remains unfazed
- Dollar recovers as July rate-cut bets are scaled back
- EU leaders resume talks over top jobs; Global PMIs due
RBA cuts, but can't keep the aussie down
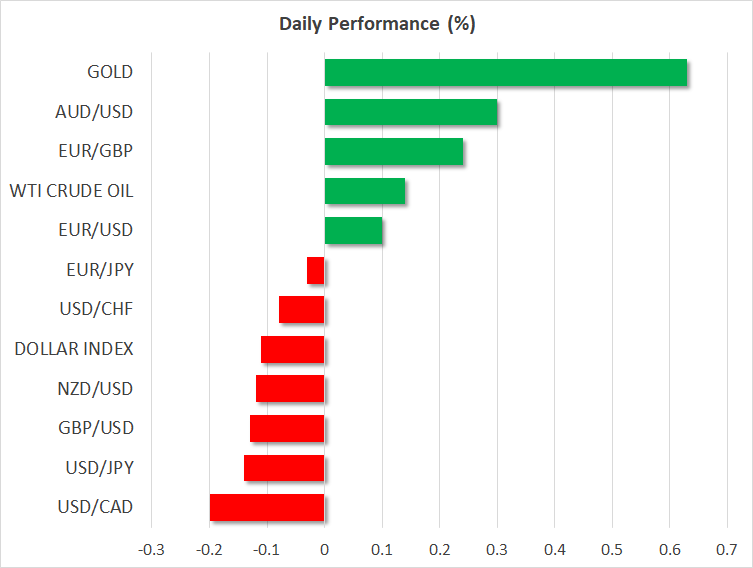
The Reserve Bank of Australia (RBA) slashed interest rates earlier today, for the second time in two meetings, indicating that the move will help reduce unemployment and boost inflation. The cut was widely signaled in advance and largely priced in ahead of the event, so even though the aussie dropped a little on the decision, it quickly recovered all its losses to trade even higher.
The currency's resilience may be owed to the RBA appearing somewhat reluctant to commit to any further cuts, noting instead that any more moves will depend on the quality of incoming data. In other words, having cut twice already, the Bank may now move to the sidelines for a while.
As for the aussie, the picture seems to be turning cautiously positive. Another RBA cut by December is priced in with an ~80% chance, and given that the Fed is now also preparing to ease along with the likes of the ECB, monetary policy is not a clear negative force for the aussie anymore. Separately, the trade war may be about to enter a 'quiet period' as talks resume, implying that there may be room for a relief rally.
Dollar soars as traders trim rate-cut bets after decent ISM print
The world's reserve currency enjoyed a good run on Monday, outperforming all its major peers as traders scaled back bets for an aggressive 50 basis points (bps) rate cut at the Fed's upcoming policy meeting. The move followed the ISM manufacturing PMI for June, which declined by less than expected, confirming that the situation isn't dire enough for the Fed to 'shock' markets with more easing than is expected.
A typical 25bps rate cut is still fully priced in for the July gathering, but the probability for a larger 50bps reduction has declined to 15%. Assuming no major disappointments in the non-manufacturing PMI tomorrow or in the payrolls report on Friday, that percentage may drift towards zero as the meeting draws closer, helping the dollar to extend its latest rebound.
That said, the bigger picture remains grim. The Fed has a lot more 'firepower' with which to ease than any other major central bank, so the dollar's potential downside during a prolonged global easing cycle would likely be far greater than that of its peers.
EU summit on 'top jobs' continues; Global PMIs and Fedspeak eyed
As for today's highlights, the calendar will be dominated by more PMI releases for June. The UK construction index is due out today, while China's Caixin services survey will follow overnight.
In Europe, negotiations to decide who will get the EU's top jobs – the presidency of the Commission, Council, and Parliament – will resume today. While not so relevant for markets per se, who is chosen (and from which countries) could be crucial in deciding who succeeds Draghi at the helm of the ECB.
In oil markets, sources suggest OPEC has agreed to extend its supply cuts for nine months. The market reaction was muted, with oil prices now likely to take their cue from how the trade talks and the situation with Iran unfold.
Finally, the Fed's Williams (10:35 GMT) and Mester (15:00 GMT) will deliver remarks. Both are voting FOMC members this year, so any signals about the July meeting could be vital.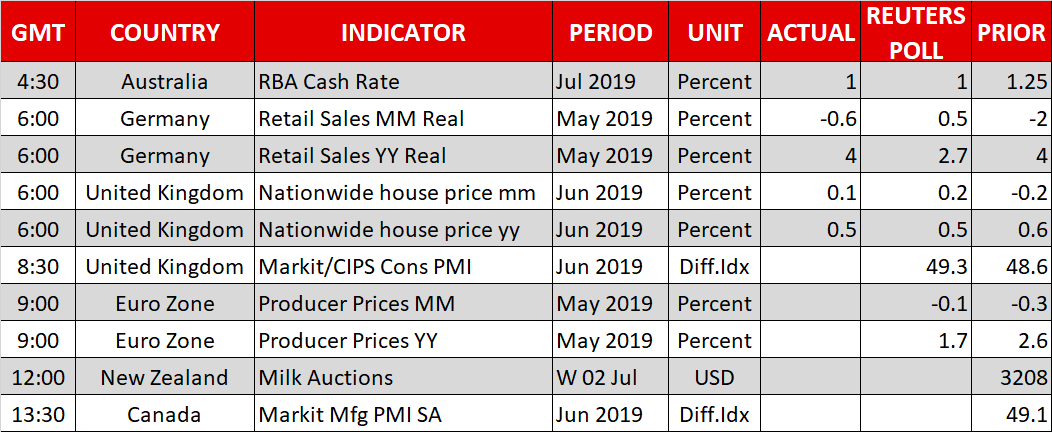
AUD/USD Daily Outlook
Daily Pivots: (S1) 0.6937; (P) 0.6984; (R1) 0.7012; More...
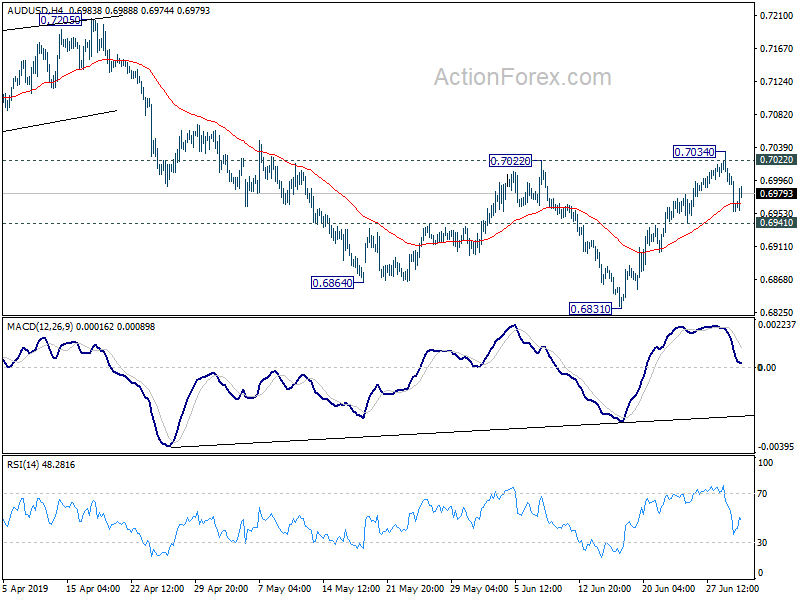
No change in AUD/USD and intraday bias remains neutral. We're still viewing the rebound from 0.6831 as a correction. And, upside should be limited by 0.7022 resistance. On the downside, break of 0.6941 minor support will turn bias back to the downside for retesting 0.6831 low. However, firm break of 0.7022 will indicate near term bullish reversal and turn outlook bullish for 0.7205 resistance next.
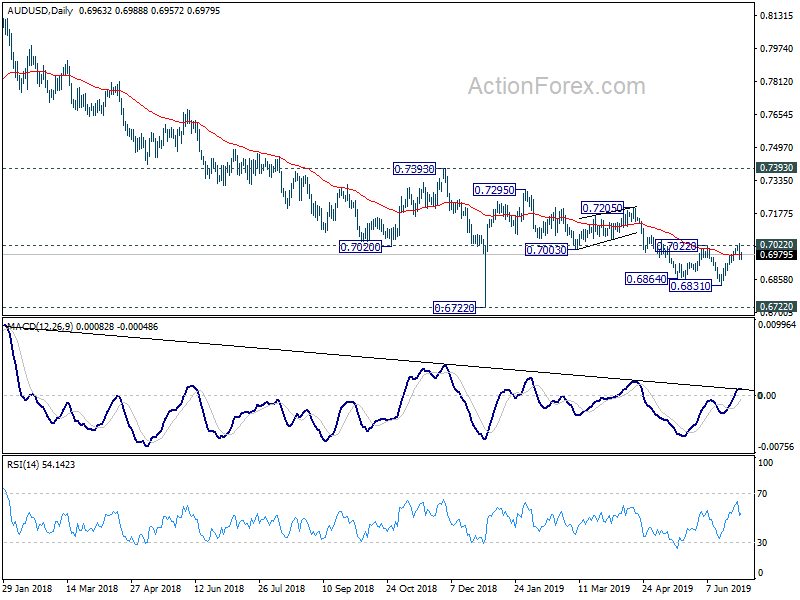
In the bigger picture, with 0.7393 key resistance intact, medium term outlook remains bearish. The decline from 0.8135 (2018 high) is seen as resuming long term down trend from 1.1079 (2011 high). Decisive break of 0.6826 (2016 low) will confirm this bearish view and resume the down trend to 0.6008 (2008 low). However, firm break of 0.7393 will argue that fall from 0.8135 has completed. And corrective pattern from 0.6826 has started the third leg, targeting 0.8135 again.
USD/CAD Daily Outlook
Daily Pivots: (S1) 1.3093; (P) 1.3119; (R1) 1.3116; More...
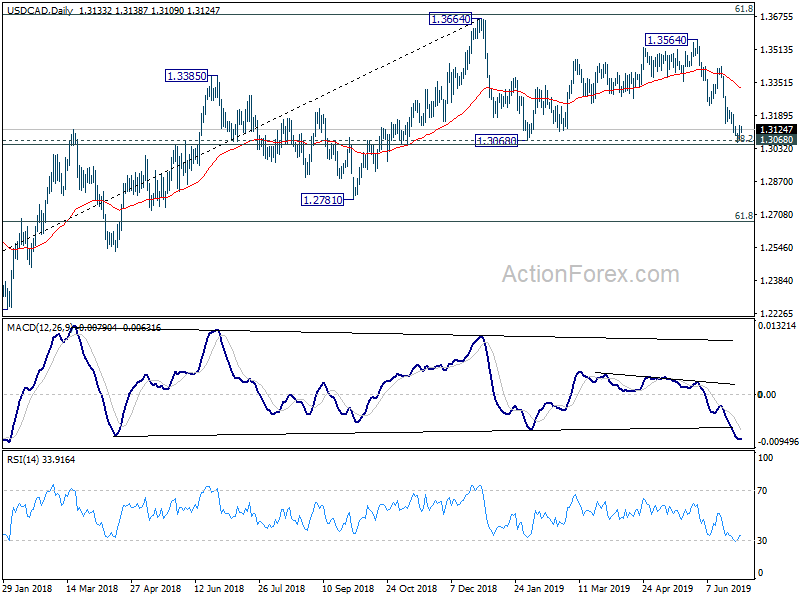
Intraday bias in USD/CAD remains neutral for the moment. On the downside, decisive break of 1.3052/68 cluster support zone will carry larger bearish implication and target 1.2673 fibonacci level next. However, break of 1.3151 will indicate short term bottoming and bring rebound back to 1.3239/3432 resistance zone.
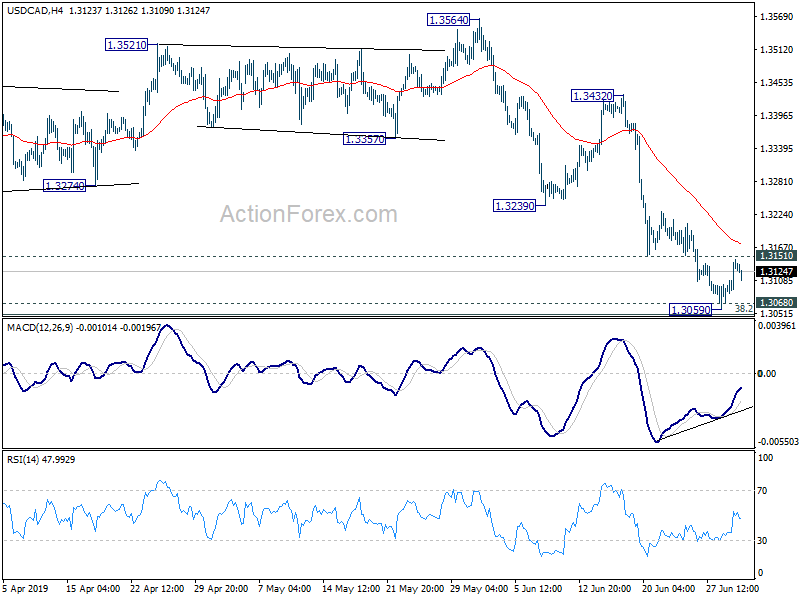
In the bigger picture, medium term outlook stays neutral for now even though the case of bearish reversal is building up. Decisive break of 1.3068 cluster support (38.2% retracement of 1.2061 to 1.3664 at 1.3052) will confirm completion of up trend from 1.2061 (2017 low). Further fall should be seen to 61.8% retracement at 1.2673 next. On the upside, sustained break of 61.8% retracement of 1.4689 (2016 high) to 1.2061 at 1.3685, is needed to confirm resumption of up trend from 1.2061 (2017 low). Otherwise, risk will stay on the downside.
The Analytical Overview Of The Main Currency Pairs
The EUR/USD currency pair
Technical indicators of the currency pair:
Prev Open: 1.13643
Open: 1.12849
% chg. over the last day: -0.64
Day's range: 1.12752 - 1.12919
52 wk range: 1.1111 - 1.2009
Aggressive sales happened on the EUR/USD yesterday. The drop exceeded 80 points. Trading instrument updated the local lows. The euro was under pressure after the publication of weak economic reports from Germany and the eurozone. At the same time, positive reports on business activity in the US manufacturing sector from ISM supported the demand for USD. At the moment, EUR/USD quotes are consolidating. The key range is 1.12750-1.13150. We do not exclude a further decline in the single currency. We recommend to open positions from key levels.
The Economic News Feed for 02.07.2019 is calm.
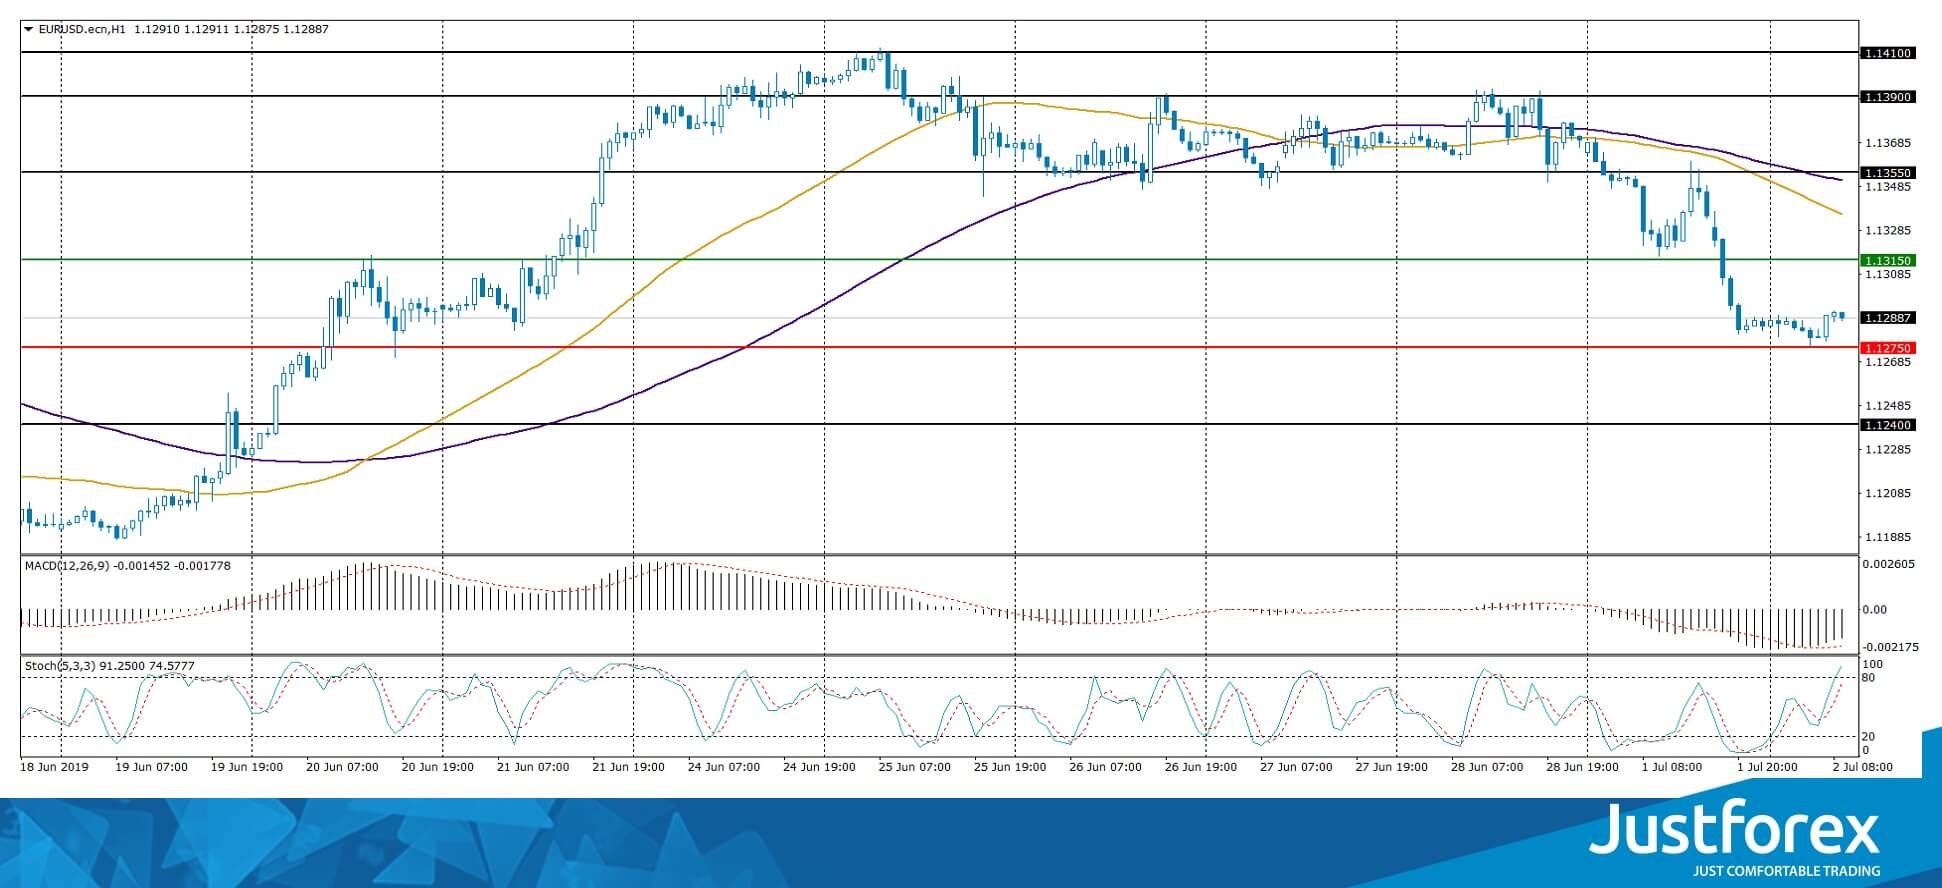
Indicators point to the strength of sellers: the price has fixed below 50 MA and 100 MA.
The MACD histogram is in the negative zone, but above the signal line, which gives a weak signal to sell EUR/USD.
The Stochastic Oscillator is in the neutral zone, the %K line is above the %D line, which indicates bullish moods.
Trading recommendations
Support levels: 1.12750, 1.12400
Resistance levels: 1.13150, 1.13550, 1.13900
If the price consolidates below the local support of 1.12750, the quotes will fall toward 1.12400-1.12200.
Alternatively the quotes could recover towards 1.13400-1.13600.
The GBP/USD currency pair
Technical indicators of the currency pair:
Prev Open: 1.26940
Open: 1.26374
% chg. over the last day: -0.39
Day's range: 1.26259 – 1.26478
52 wk range: 1.2438 – 1.3631
GBP/USD has started to decline. Yesterday, the quotes fell by more than 50 points and updated local minima. The UK has published weak statistics on business activity in the manufacturing sector of the country for June. The trading instrument found support at 1.26300. Mark 1.26650 is already a "mirror" resistance. Sterling has the potential to further decline. We recommend to keep up to date information on Brexit. Positions must be opened from key levels.
At 11:30 (GMT + 3:00) the business activity index in the UK construction sector will be published.
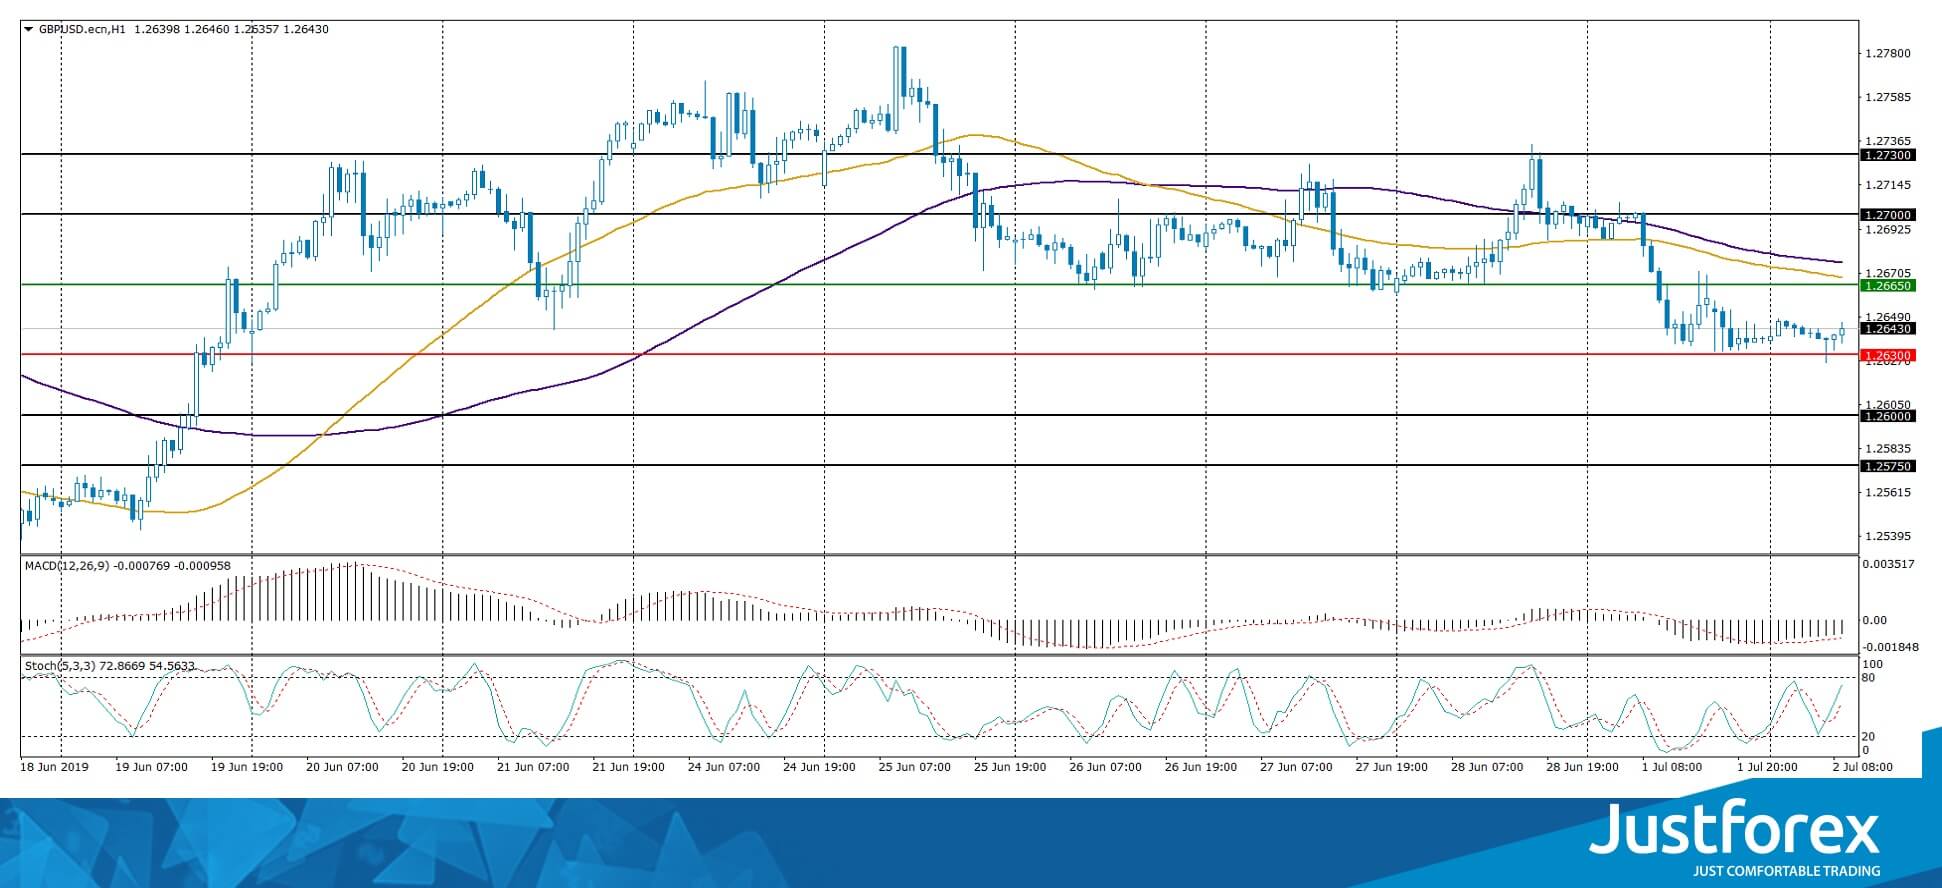
The price has fixed below 50 MA and 100 MA, which indicates the strength of the sellers.
The MACD histogram is in the negative zone but above the signal line, which gives a weak signal to sell GBP/USD.
Stochastic Oscillator is in the neutral zone, the %K line is above the %D line, which indicates a bullish mood.
Trading recommendations
Support levels: 1.26300, 1.26000, 1.25750
Resistance levels: 1.26650, 1.27000, 1.27300
If the price consolidates below 1.26300, the quotes will drop toward 1.26000-1.25750.
Alternatively, the quotes can grow towards 1.27000.
The USD/CAD currency pair
Technical indicators of the currency pair:
Prev Open: 1.30843
Open: 1.31331
% chg. over the last day: +0.34
Day's range: 1.31142 - 1.31386
52 wk range: 1.2727 - 1.3664
The USD/CAD began to recover after a long fall. During yesterday's trading, the growth of the quotes exceeded 50 pips. The trading instrument has updated the local maximums. At the moment, CAD is consolidating. The key support and resistance levels are 1.31000 and 1.31500. The current technical picture signals a further correction of the currency pair. We recommend to open positions from key levels.
The Economic News Feed for 02.07.2019 is calm.
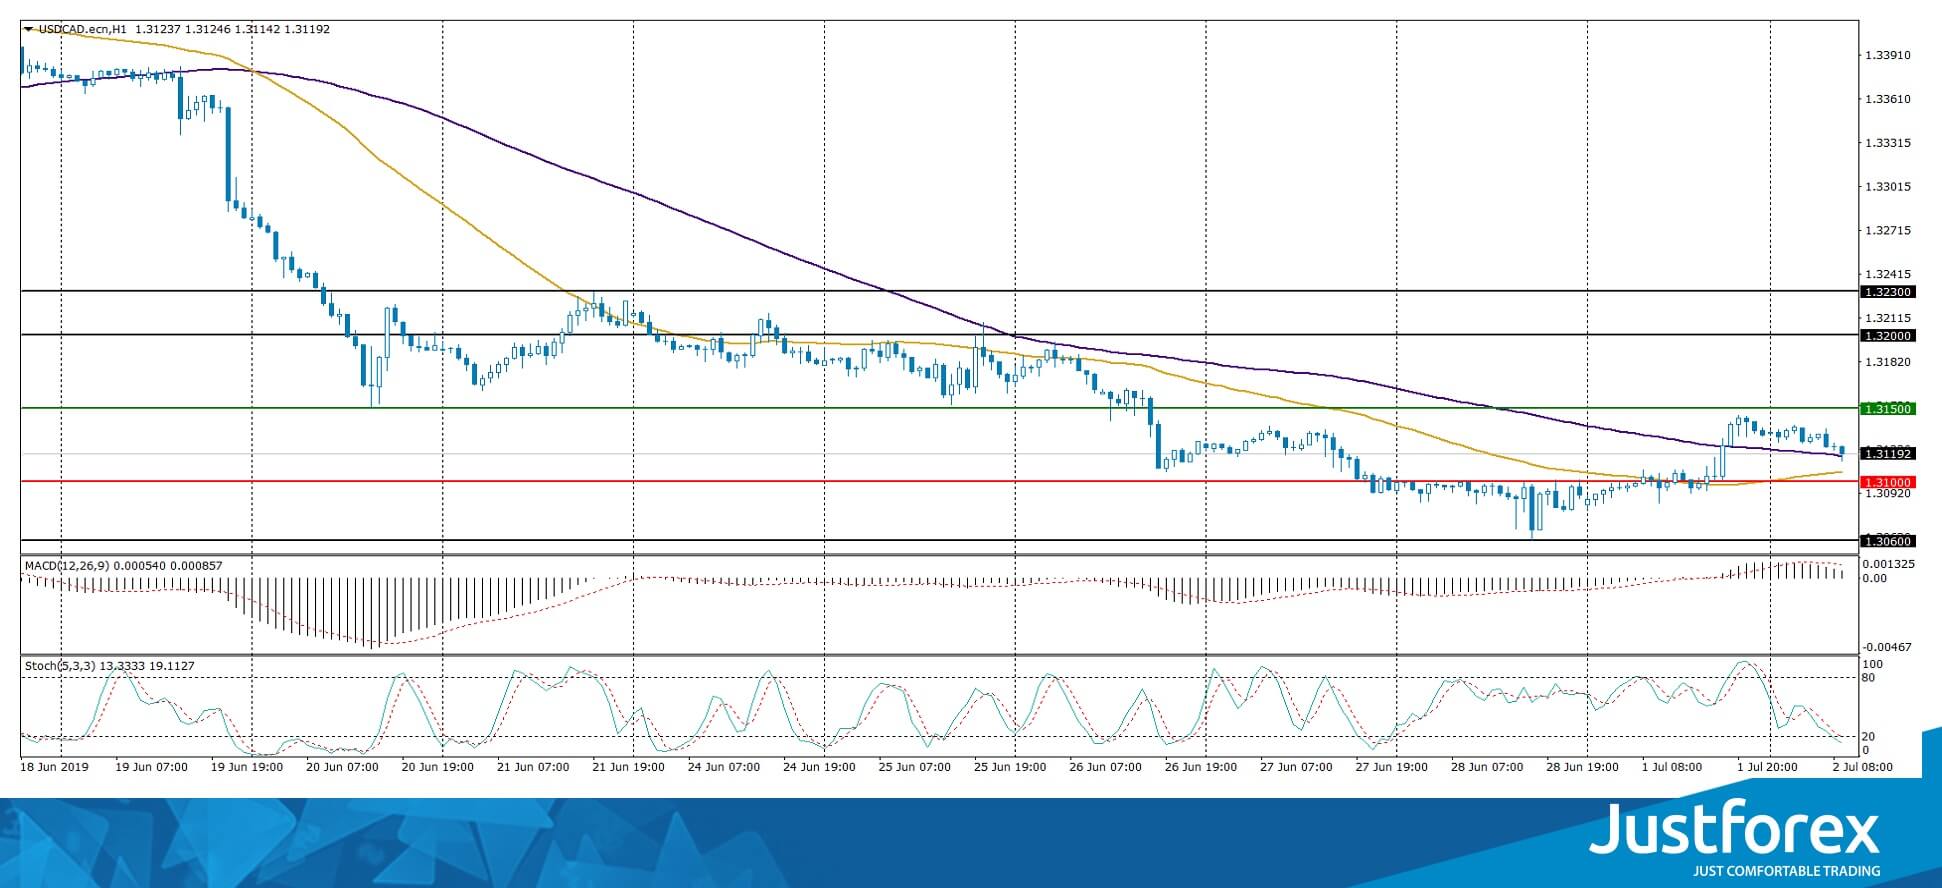
The indicators do not give accurate signals: the price has crossed 100 MA.
The MACD histogram is in the positive zone, but below the signal line, which gives a weak signal to buy USD/CAD.
Stochastic Oscillator is located near the oversold zone, the %K line is below the %D line, which indicates bearish moods.
Trading recommendations
Support levels: 1.31000, 1.30600
Resistance levels: 1.31500, 1.32000, 1.32300
If the price consolidates above the level of 1.31500, the quotes will rise towards 1.32000-1.32300.
Alternatively, the quotes could fall to 1.30700-1.30500.
The USD/JPY currency pair
Technical indicators of the currency pair:
Prev Open: 108.288
Open: 108.427
% chg. over the last day: +0.08
Day's range: 108.274 – 108.475
52 wk range: 104.97 – 114.56
The USD/JPY has stabilized. The trading instrument is in a lateral movement. The key support and resistance levels are 108.100 and 108.500. USD/JPY quotes can grow further further. The demand for safe assets weakened after the conclusion of a temporary truce in the trade conflict between the United States and China. We recommend to pay attention to the dynamics of the yield of US government bonds. Positions must be opened from key levels.
The Economic News Feed for 02.07.2019 is calm.
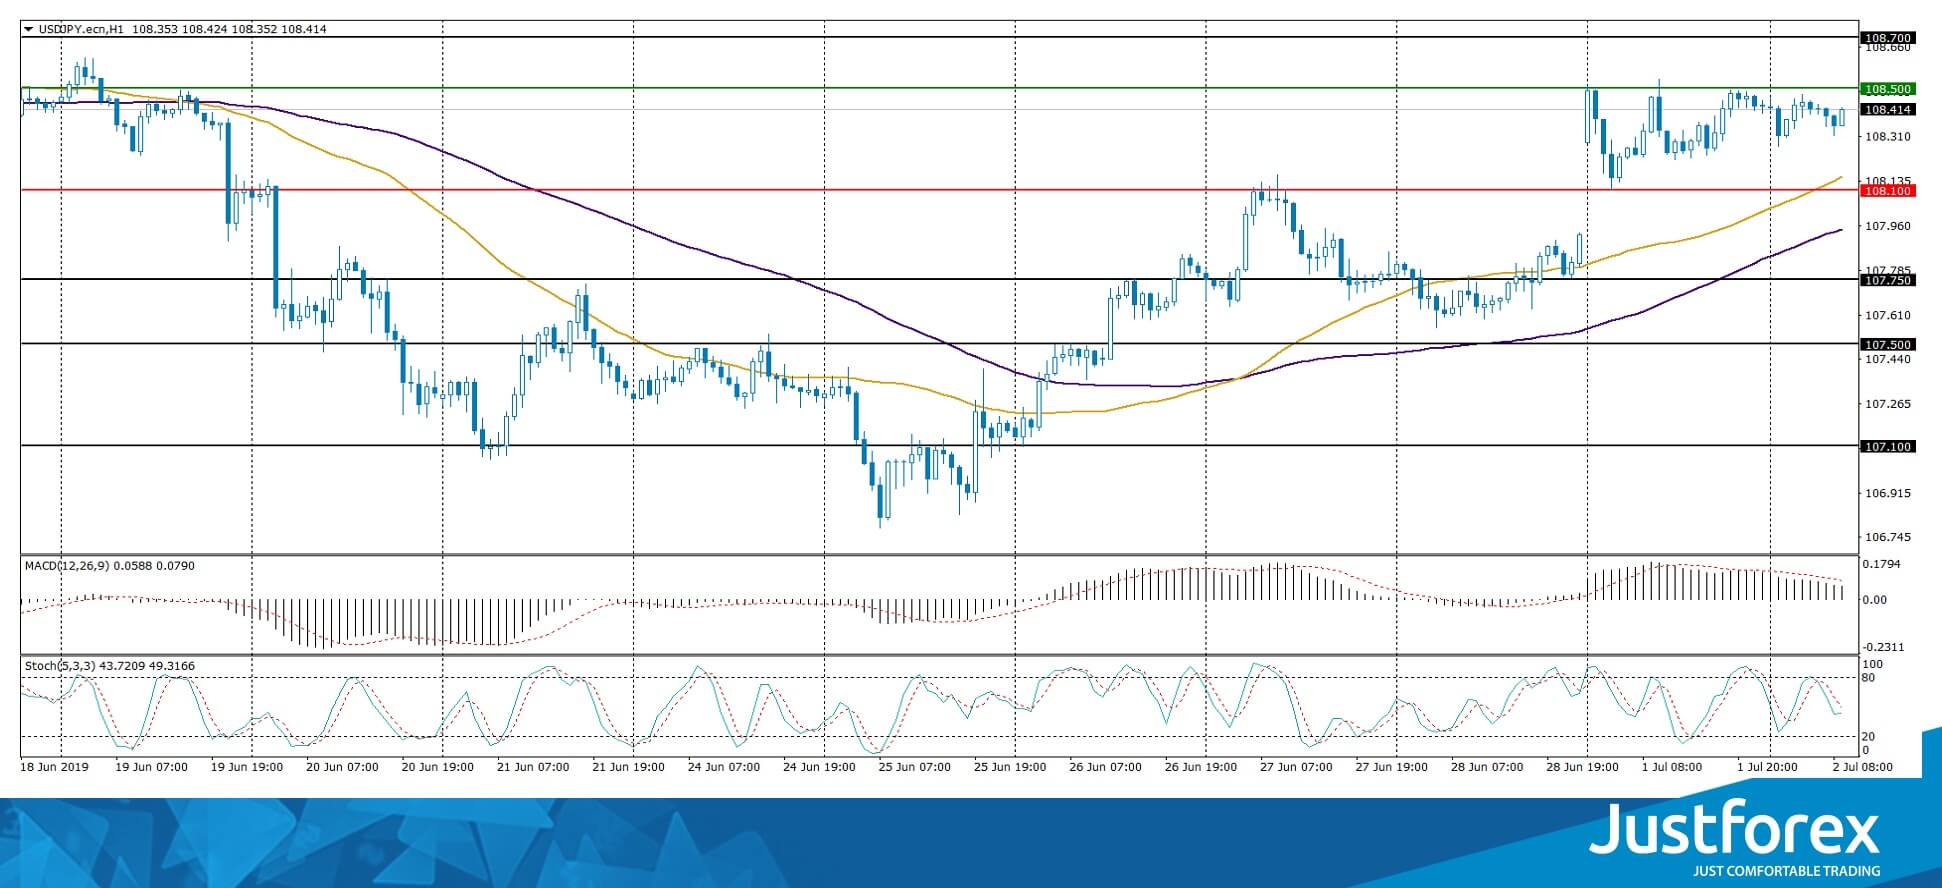
The price fixed above 50 MA and 100 MA which points to the power of the buyers.
The MACD histogram is in the positive zone but below the signal line which gives a weak signal towards buying USD/JPY.
The Stochastic Oscillator is in the neutral zone, the %K line is above the %D line. The indicator points to a bearish mood.
Trading recommendations
Support levels: 108.100, 107.750, 107.500
Resistance levels: 108.500, 108.700, 109.000
If the price fixes above 108.500, expect further growth towards 108.700-109.000.
Alternatively, the quotes can descend towards 107.750-107.500.
USD/JPY Daily Outlook
Daily Pivots: (S1) 108.18; (P) 108.35; (R1) 108.61; More...
No change in USD/JPY's outlook. Intraday bias stays neutral with focus on 108.80 resistance. Considering bullish convergence condition in 4 hour MACD, firm break of 108.80 will confirm short term bottoming at 106.78. In this case, stronger rise should be seen back to 110.67 resistance. On the other hand, rejection by 108.80, followed by break of 107.56 will retain near term bearishness. Intraday bias will be turned back to the downside for 106.78 support instead.
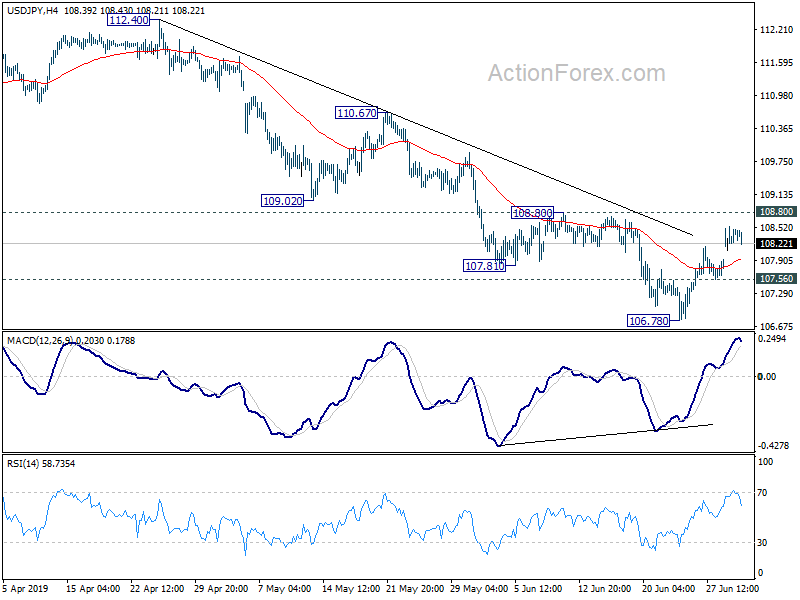
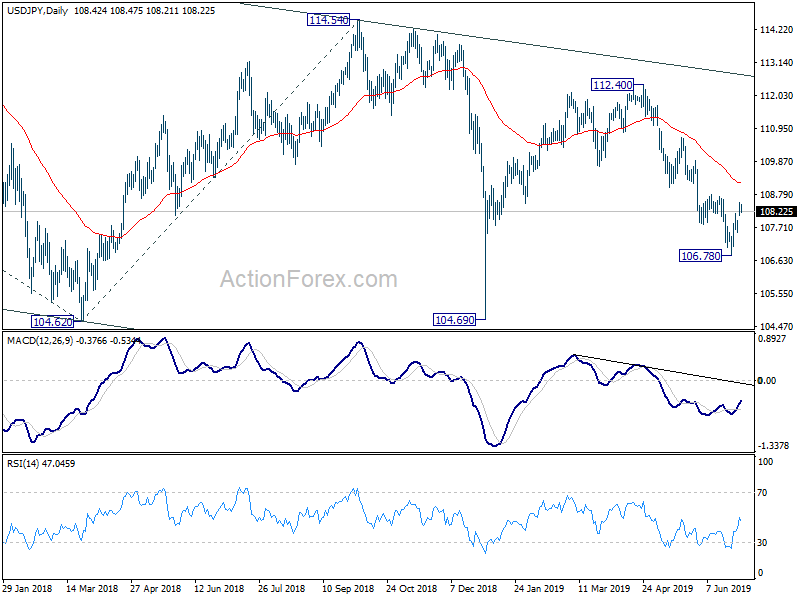
In the bigger picture, decline from 118.65 (Dec 2016) is still in progress, with the pair staying inside long term falling channel. Break of 104.62 will target 100% projection of 118.65 to 104.62 from 114.54 at 100.51. For now, we'd expect strong support above 98.97 (2016 low) to contain downside to bring rebound. In any case, break of 112.40 is needed to the first serious sign of medium term bullishness. Otherwise, further decline will remain in favor in case of rebound.
USD/CHF Daily Outlook
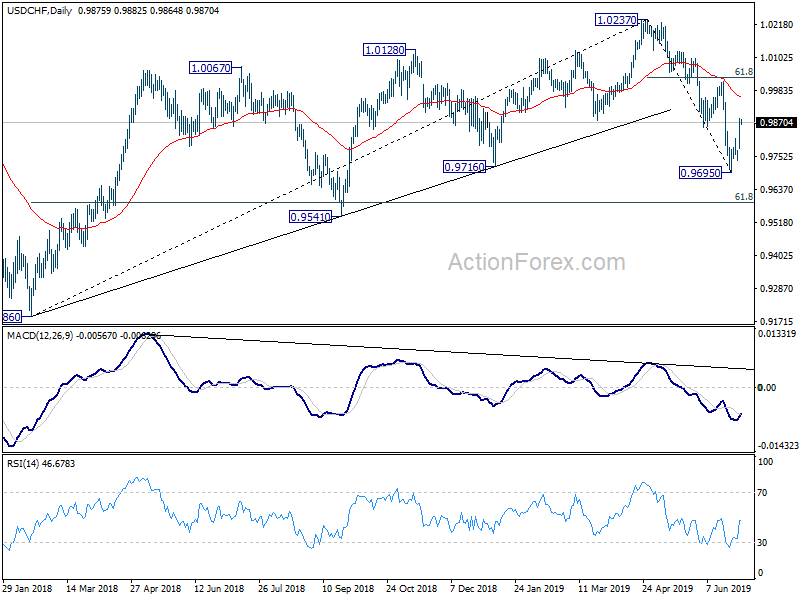
Daily Pivots: (S1) 0.9813; (P) 0.9848; (R1) 0.9914; More...
USD/CHF's break of 0.9854 support turned resistance suggests short term bottoming at 0.9695. Intraday bias is turned back to the upside for 1.0014 resistance. But upside could be limited by 61.8% retracement of 1.0237 to 0.9695 at 1.0030. On the downside, below 0.9809 minor support will turn bias back to the downside for retesting 0.9695 low.
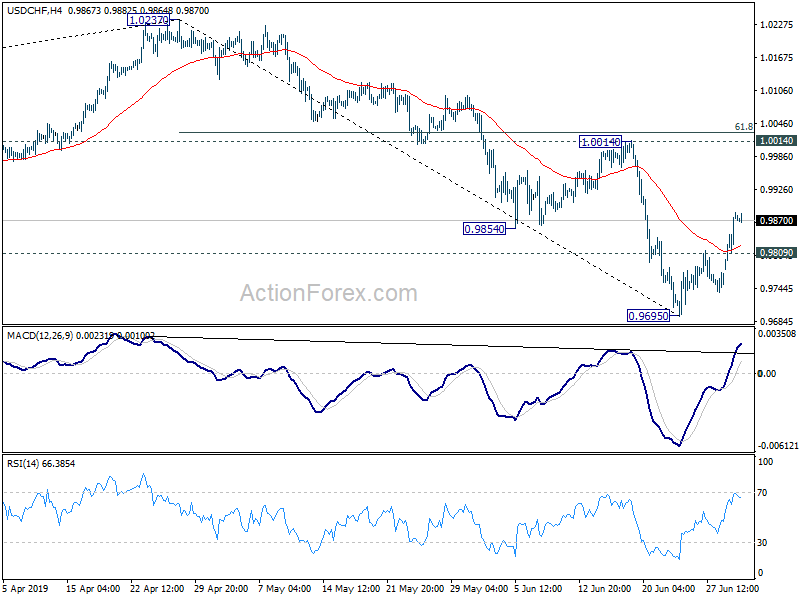
In the bigger picture, current development suggests that up trend from 0.9186 (2018 low) has completed at 1.0237 already. Deeper decline would be seen to 61.8% retracement of 0.9186 to 1.0237 at 0.9587 and below. For now, USD/CHF is seen as in long term range pattern between 0.9186 and 1.0342. Hence, we'd pay attention to bottoming signal below 0.9587. However, sustained break of 1.0014 will revive medium term bullishness and turn focus back to 1.0237 high.