Sample Category Title
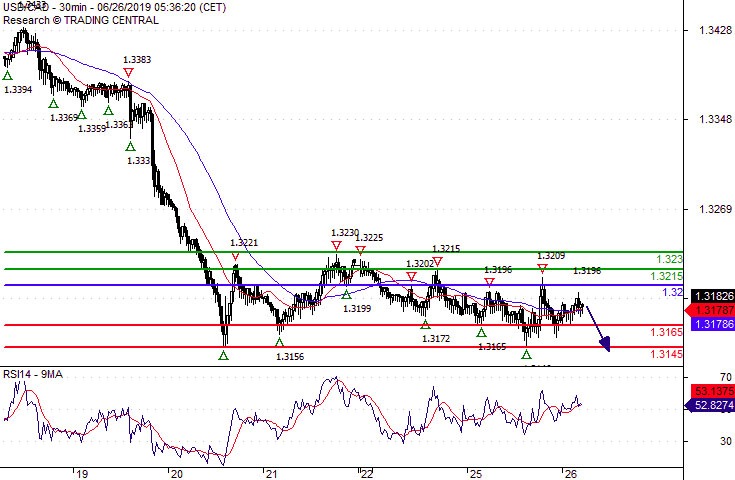
USD/CAD Key Resistance At 1.3200
Pivot (invalidation): 1.3200
Our preference Short positions below 1.3200 with targets at 1.3165 & 1.3145 in extension.
Alternative scenario Above 1.3200 look for further upside with 1.3215 & 1.3230 as targets.
Comment The upward potential is likely to be limited by the resistance at 1.3200
USD/CAD Daily Outlook
Daily Pivots: (S1) 1.3166; (P) 1.3191; (R1) 1.3206; More...
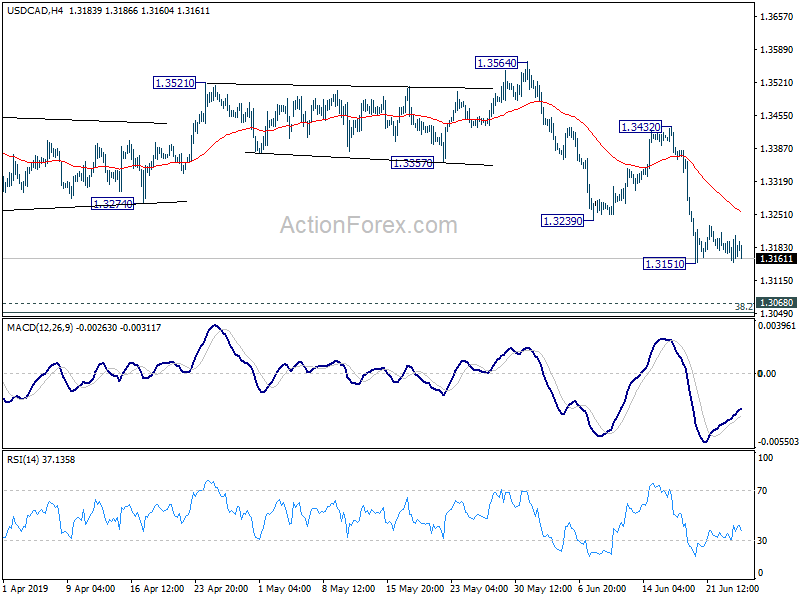
Intraday bias in USD/CAD remains neutral as consolidation from 1.1315 temporary low is in progress. In case of another rise, upside of recovery should be limited well below 1.3432 resistance to bring fall resumption. On the downside, break of 1.3151 will extend the fall from 1.3564 to target 1.3052/68 cluster support.
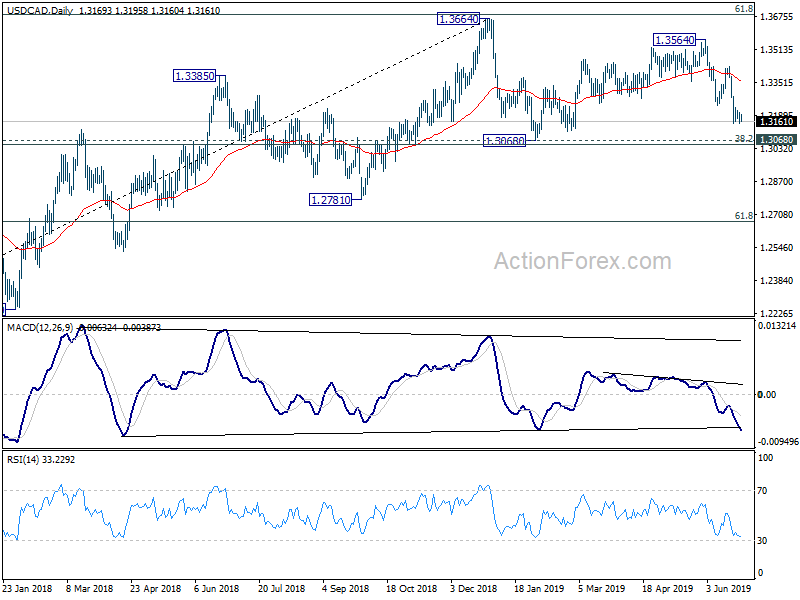
In the bigger picture, medium term outlook stays neutral for now even though the case of bearish reversal is building up. Decisive break of 1.3068 cluster support (38.2% retracement of 1.2061 to 1.3664 at 1.3052) will confirm completion of up trend from 1.2061 (2017 low). Further fall should be seen to 61.8% retracement at 1.2673 next. On the upside, sustained break of 61.8% retracement of 1.4689 (2016 high) to 1.2061 at 1.3685, is needed to confirm resumption of up trend from 1.2061 (2017 low). Otherwise, risk will stay on the downside.
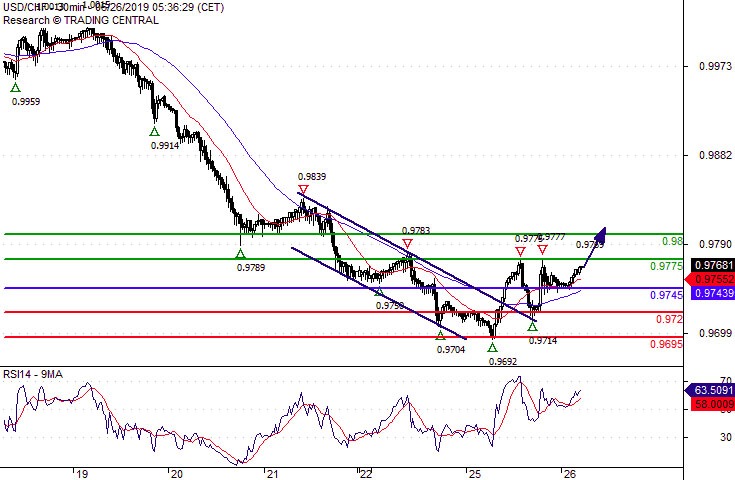
USD/CHF 0.9800 Expected
Pivot (invalidation): 0.9745
Our preference Long positions above 0.9745 with targets at 0.9775 & 0.9800 in extension.
Alternative scenario Below 0.9745 look for further downside with 0.9720 & 0.9695 as targets.
Comment The RSI calls for a new upleg.
AUD/USD Daily Outlook
Daily Pivots: (S1) 0.6942; (P) 0.6961; (R1) 0.6979; More...
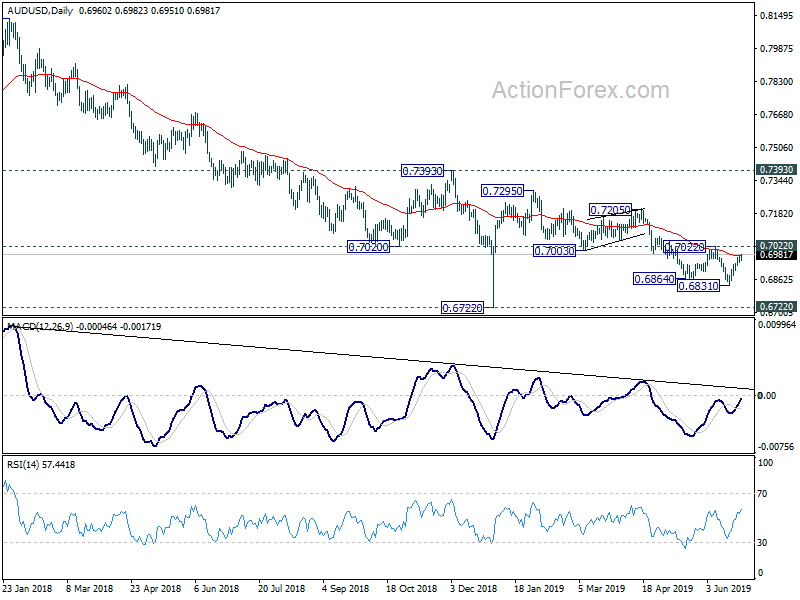
AUD/USD's corrective rebound from 0.6831 is still in progress and might extend higher. But upside should be limited by 0.7022 resistance to bring fall resumption. On the downside, below 0.6903 minor support will turn bias to the downside for retesting 0.6831 low first. Break there will resume the decline from 0.7295 to 0.6722 low next. However, firm break of 0.7022 will indicate near term reversal and turn outlook bullish for 0.7205 resistance instead.
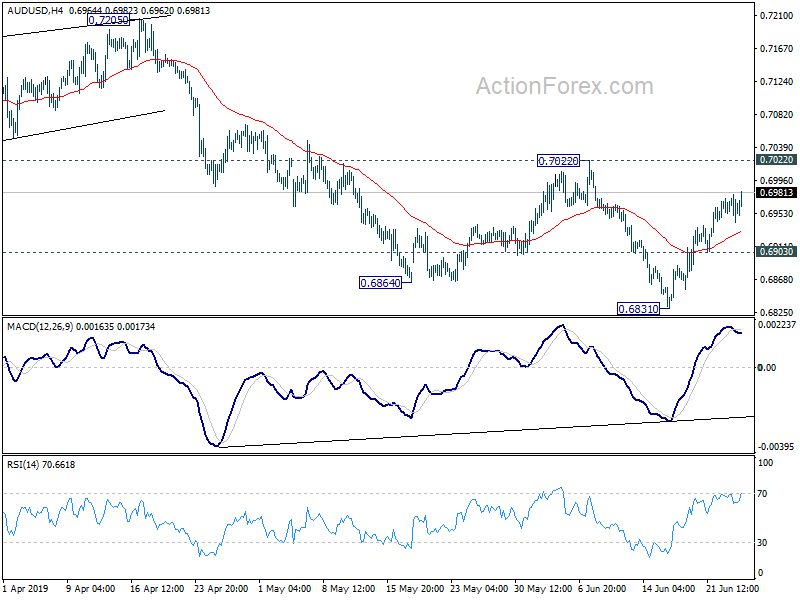
In the bigger picture, with 0.7393 key resistance intact, medium term outlook remains bearish. The decline from 0.8135 (2018 high) is seen as resuming long term down trend from 1.1079 (2011 high). Decisive break of 0.6826 (2016 low) will confirm this bearish view and resume the down trend to 0.6008 (2008 low). However, firm break of 0.7393 will argue that fall from 0.8135 has completed. And corrective pattern from 0.6826 has started the third leg, targeting 0.8135 again.
RBNZ Review – Stand Pat and Stay Cautions
NZDUSD climbed higher after RBNZ left the OCR unchanged at 1.5%, a well-anticipated move. The members maintained a dovish tone, but not more dovish than in the previous meeting. Although the central bank indicated that interest rates might need to be lower, it does not sound like it would come very soon. This appears different from other major central banks which intentionally signaled a easier monetary policy in the near future. That said, the market continues to expect a 80% change of a rate cut in August.
The key reference in the policy statement is “a lower OCR may be needed over time” in the first paragraph. The reference was reiterated in the closing paragraph, adding that the measure is a response to the “downside risks around the employment and inflation outlook”.
The members remained concerned about the global economic uncertainty, noting weakening outlook and intensifying downside risks to trade. The believed global slowdown has been affecting “New Zealand through a range of trade, financial, and confidence channels”.
Domestically, RBNZ acknowledged that growth has “slowed over the past year”. The members cautioned that “softer house prices and subdued business sentiment” have dampened household spending. They noted that “inflation remains slightly below the mid-point of the inflation target” while “employment is broadly at its maximum sustainable level”. Like Australia, New Zealand has been struggling with sluggish wage growth despite low unemployment. This in turns substantiate weak inflation. As noted in the statement, some members suggested that the lack of wage pressure might indicate that there is still “spare capacity in the labour market”. Others noted that “reduced migrant inflows could see wage pressure increase in some sectors”.
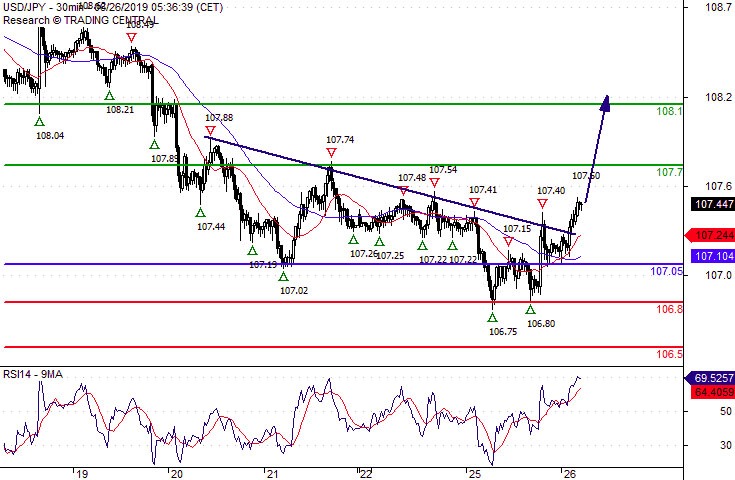
USD/JPY Further Advance
Pivot (invalidation): 107.05
Our preference Long positions above 107.05 with targets at 107.70 & 108.10 in extension.
Alternative scenario Below 107.05 look for further downside with 106.80 & 106.50 as targets.
Comment The RSI is bullish and calls for further advance.
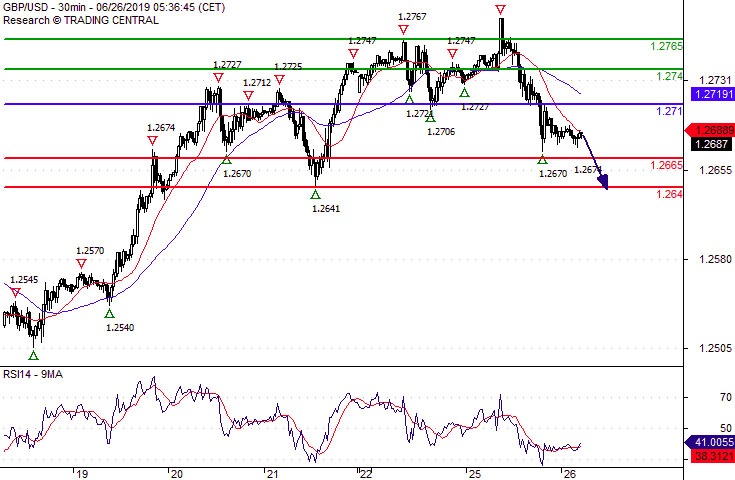
GBP/USD Under Pressure
Pivot (invalidation): 1.2710
Our preference Short positions below 1.2710 with targets at 1.2665 & 1.2640 in extension.
Alternative scenario Above 1.2710 look for further upside with 1.2740 & 1.2765 as targets.
Comment The break below 1.2710 is a negative signal that has opened a path to 1.2665.
USD/JPY Daily Outlook
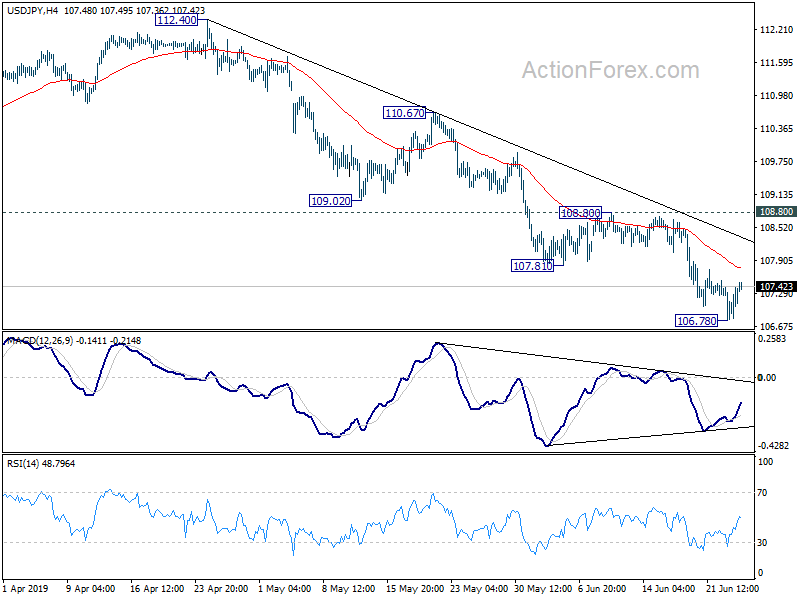
Daily Pivots: (S1) 106.82; (P) 107.12; (R1) 107.45; More...
A temporary low is in place at 106.78 in USD/JPY and intraday bias is turned neutral. Some consolidations would be seen first but upside of recovery should be limited buy 108.80 resistance to bring fall resumption. On the downside, break of 106.78 will extend the decline from 112.40 to retest 104.69 low.
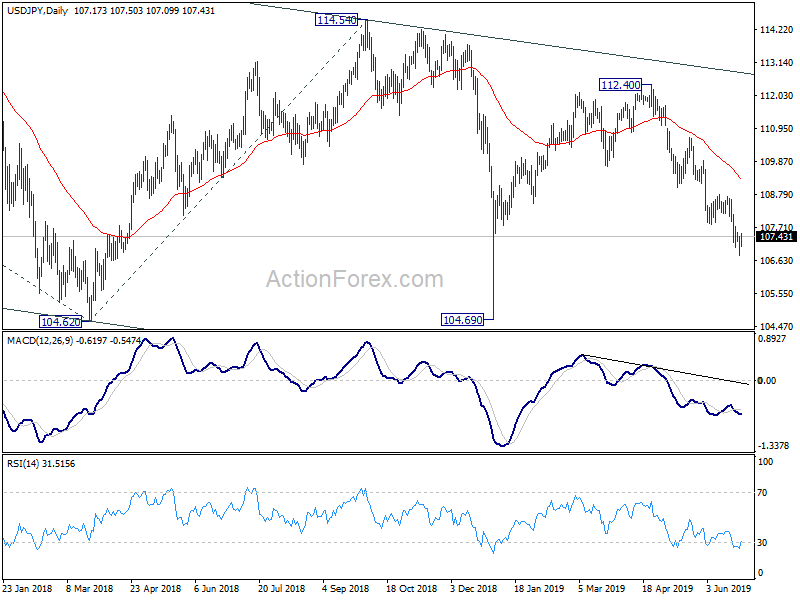
In the bigger picture, decline from 118.65 (Dec 2016) is still in progress, with the pair staying inside long term falling channel. Break of 104.62 will target 100% projection of 118.65 to 104.62 from 114.54 at 100.51. For now, we'd expect strong support above 98.97 (2016 low) to contain downside to bring rebound.
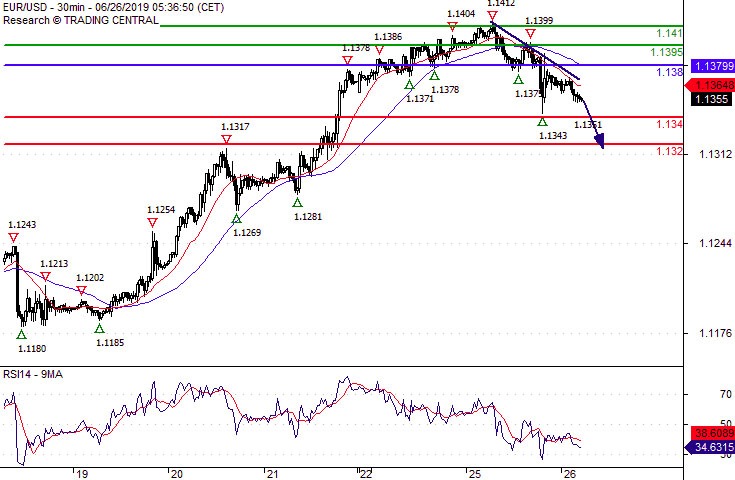
EUR/USD Towards 1.1320
Pivot (invalidation): 1.1380
Our preference Short positions below 1.1380 with targets at 1.1340 & 1.1320 in extension.
Alternative scenario Above 1.1380 look for further upside with 1.1395 & 1.1410 as targets.
Comment The RSI is bearish and calls for further downside.
AUDUSD Tops Moving Averages But Indicators Move Sideways
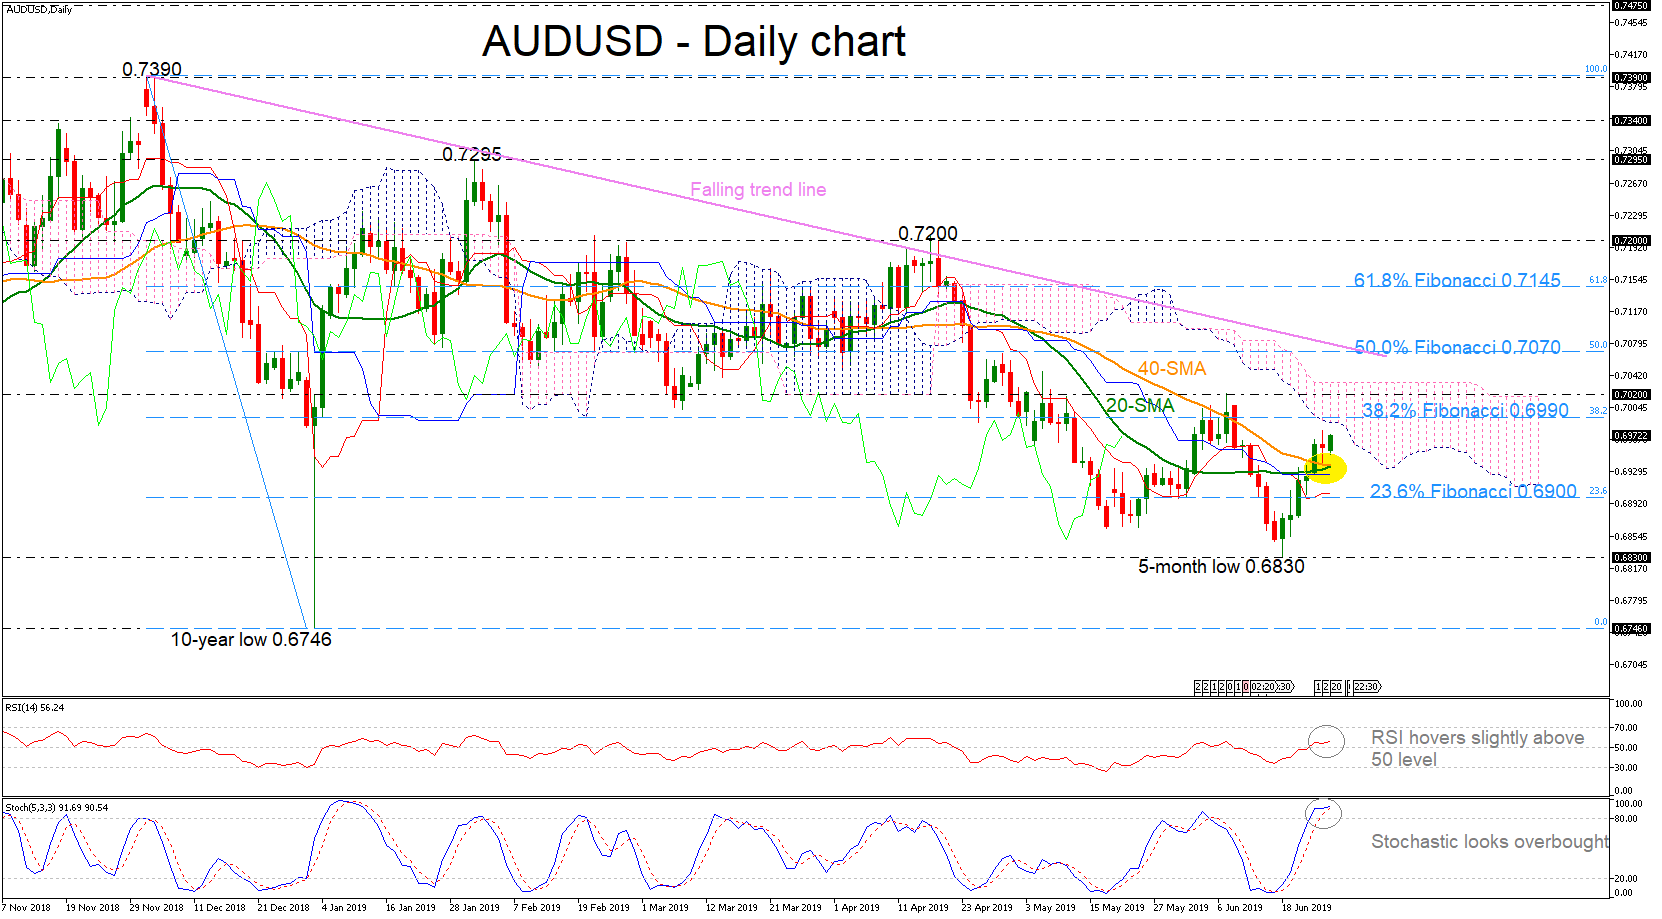
AUDUSD has been extending its gains since the previous week following the strong support on the five-month low near 0.6830. The pair surpassed above the 20- and 40-day simple moving averages (SMAs) which are ready to post a bullish crossover, signaling further upside momentum.
However, the stochastic oscillator seems to be losing momentum in the overbought territory, the RSI is still flattening slightly above the 50 level as well as the red Tenkan-sen and the blue Kijun-sen lines, all signaling a more cautious trading in the short term.
The pair needs to overcome the 38.2% Fibonacci retracement level of the downfall from 0.7390 to 0.6830 near 0.6990 to meet a key barrier around the 0.7020 resistance, taken from the latest high on June 7, near the upper surface of the Ichimoku cloud. The 50.0% Fibonacci mark of 0.7070 could act as resistance too as it overlaps with the falling trend line before a more important battle starts near the 61.8% Fibo of 0.7145.
On the flipside, if the price weakens below the SMAs, support to downside movements could be initially detected around the 23.6% Fibo of 0.6900. Clearing this zone, the next stop could be at the five-month low of 0.6830.
In the short-term picture, the sentiment turned slightly bullish after the price surpassed the 0.6900 number but the technical indicators are moving sideways expressing a possible downside trend again. Traders should wait for a jump above the six-month descending trend line before initiating positive positions.