Sample Category Title
GBP/JPY Daily Outlook
Daily Pivots: (S1) 135.57; (P) 136.21; (R1) 136.61; More...
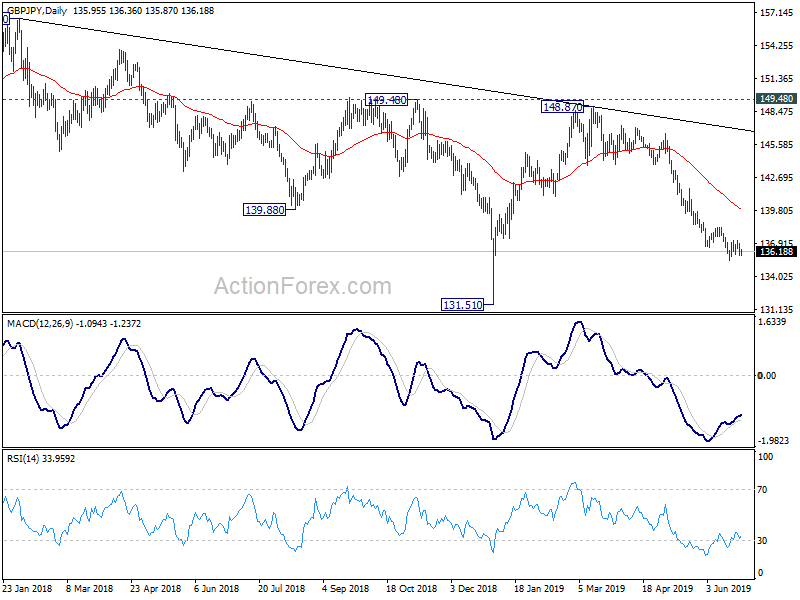
Intraday bias in GBP/JPY remains neutral as consolidation from 135.38 is extending. In case of another rise, upside should be limited by 138.32 resistance to bring fall resumption. On the downside, break of 135.38 will extend recent fall from 148.87 to retest 131.51 low. Though, firm break of 135.38 will confirm short term bottoming and bring stronger rebound to 55 day EMA (now at 139.83).
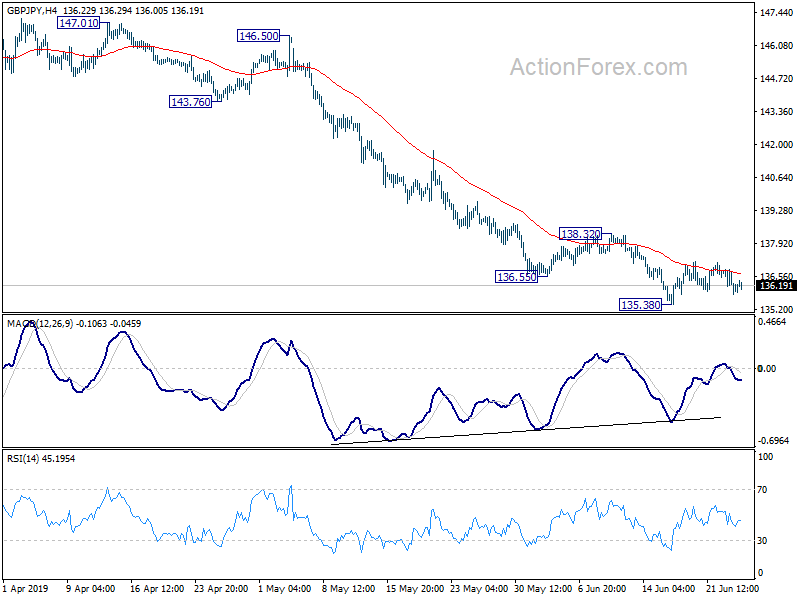
In the bigger picture, current development suggests that GBP/JPY's medium term fall from 156.59 (2018 high) is still in progress. Break of 131.51 will target 122.36 (2016 low). Structure of such decline is corrective looking so far, arguing that it's just the second leg of consolidation from 122.36. Thus, we'd expect strong support from 122.36 to contain downside to bring reversal.
EUR/JPY Daily Outlook
Daily Pivots: (S1) 121.48; (P) 121.97; (R1) 122.31; More....
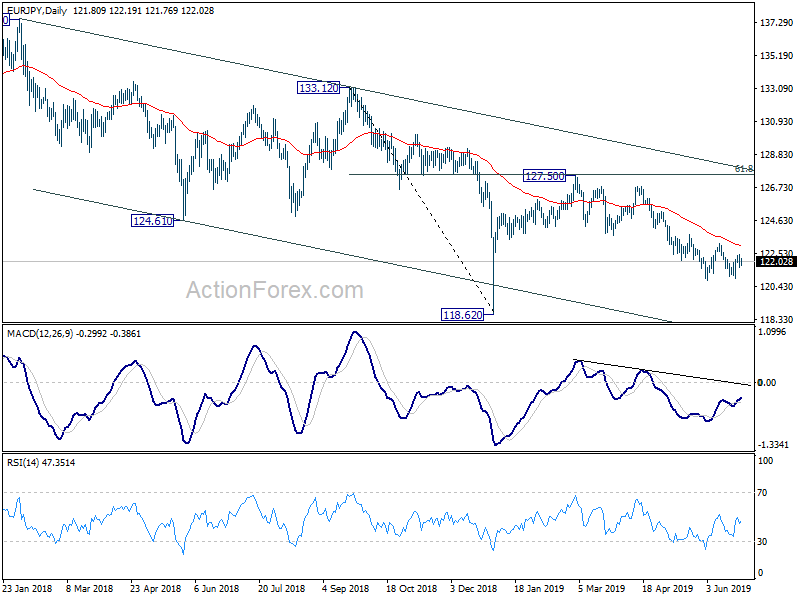
Intraday bias in EUR/JPY remains neutral as consolidation from 120.78 is extending. Further rise cannot be ruled out. But upside should be limited below 123.73 resistance to bring fall resumption eventually. On the downside, firm break of 120.78 will resume the decline from 127.50 and target 118.62 low next.
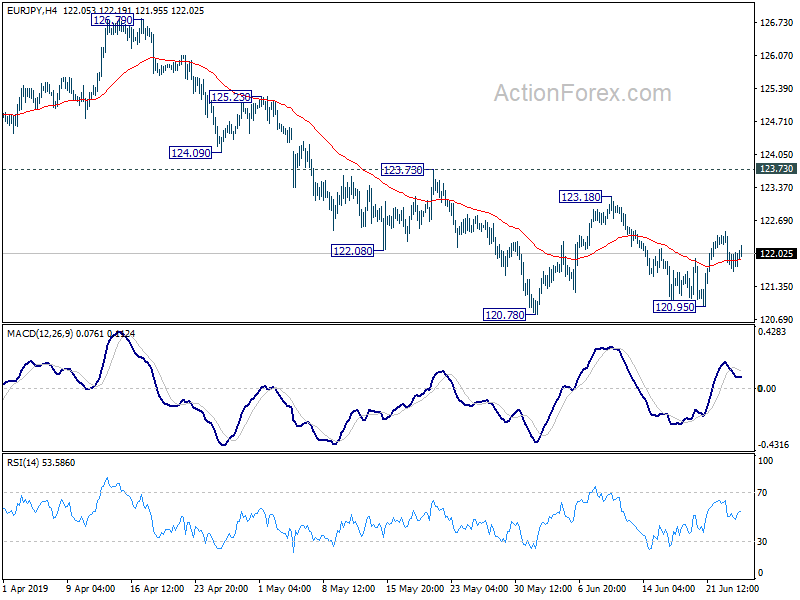
In the bigger picture, down trend from 137.49 is still in progress with the cross staying inside long term falling channel. Break of 118.62 will extend the fall to 109.48 (2016 low). On the upside, break of 127.50 resistance is needed to be the first sign of medium term reversal. Otherwise, outlook will remain bearish in case of strong rebound.
USD Strengthens On Easing Worries About Fed’s Intentions
The USD seems to strengthen somewhat, as Fed officials seem to lower the market's dovish expectations. Fed Chair Powell stressed in a speech yesterday, the Fed's independence from US President Trump, who is asking for extensive rate cuts. However also the Fed Chairman stated that many at FOMC see stronger case for more accommodation. In addition, it should be mentioned that St. Louis Fed President Bullard characterized a possible July cut as more of an “insurance” against a possible slowdown of the US economy. It should be noted, that also Atlanta Fed President Bostic had earlier stated his total agreement with Powell's view. Should the market worry less about a possible rate cut by the Fed we could see the USD getting further support during the day. EUR/USD dropped yesterday breaking the upward trendline incepted since the 19th of June, as well as the 1.1380 (R1) support line (now turned to resistance). As the pair has broken both the upward trendline and the 1.1380 (R1) line, we switch our bullish bias, in favor of a bearish outlook for the pair. Should the pair remain under the selling interest of the market, we could see it breaking the 1.1340 (S1) support line and aim for the 1.1300 (S2) support barrier. Should the pair's long positions be favored by the market, we could see it breaking the 1.1380 (R1) resistance line and aim for the 1.1415 (R2) resistance hurdle.
RBNZ remains on hold and the Kiwi strengthens
RBNZ remained on hold at 1.50%, however in its accompanying statement the bank stated that a lower Official Cash Rate (OCR) might be needed. The bank cited as reasons for a possible future rate cut the downside risks around the employment market's and inflation's outlook. It also stated that there is a weaker global economic outlook and a risk of an ongoing subdued domestic growth. Analysts, tend to note that the RBNZ signaled a stronger easing bias than it did in May, implying that the possibility of rate cut in the August meeting is extensive. Should one compare the Kiwi with other commodity currencies as well as the USD, we could say that the market may have expected the decision to be even more dovish. Hence, the market provided ultimately some support for the Kiwi, implying that the currency may strengthen a bit more in the near term. NZD/USD continuously tested and finally broke the 0.6650 (S1) resistance line (now turned to support). As the upward trendline was only momentarily broken and the pair maintained its upward momentum, we maintain our bullish bias for the pair. Should the bulls maintain control over the pair's direction, we could see the pair breaking the 0.6685 (R1) resistance line aiming for higher grounds. On the flip side, should the bears dictate the pair's direction, we could see it breaking the 0.6650 (S1) support line, the prementioned upward trendline and aim for the 0.6610 (S2) support barrier.
Other economic highlights, today and early tomorrow
Today during the European session, we get Germany's GFK Consumer Sentiment indicator for July and later on from the Czech Republic, CNB's interest rate decision. In the American session, we get the US durable goods orders growth rates for May and later on, the EIA crude oil inventories figure. In tomorrow's Asian session, Japan's retail sales growth rate for May are due out.
NZD/USD H4
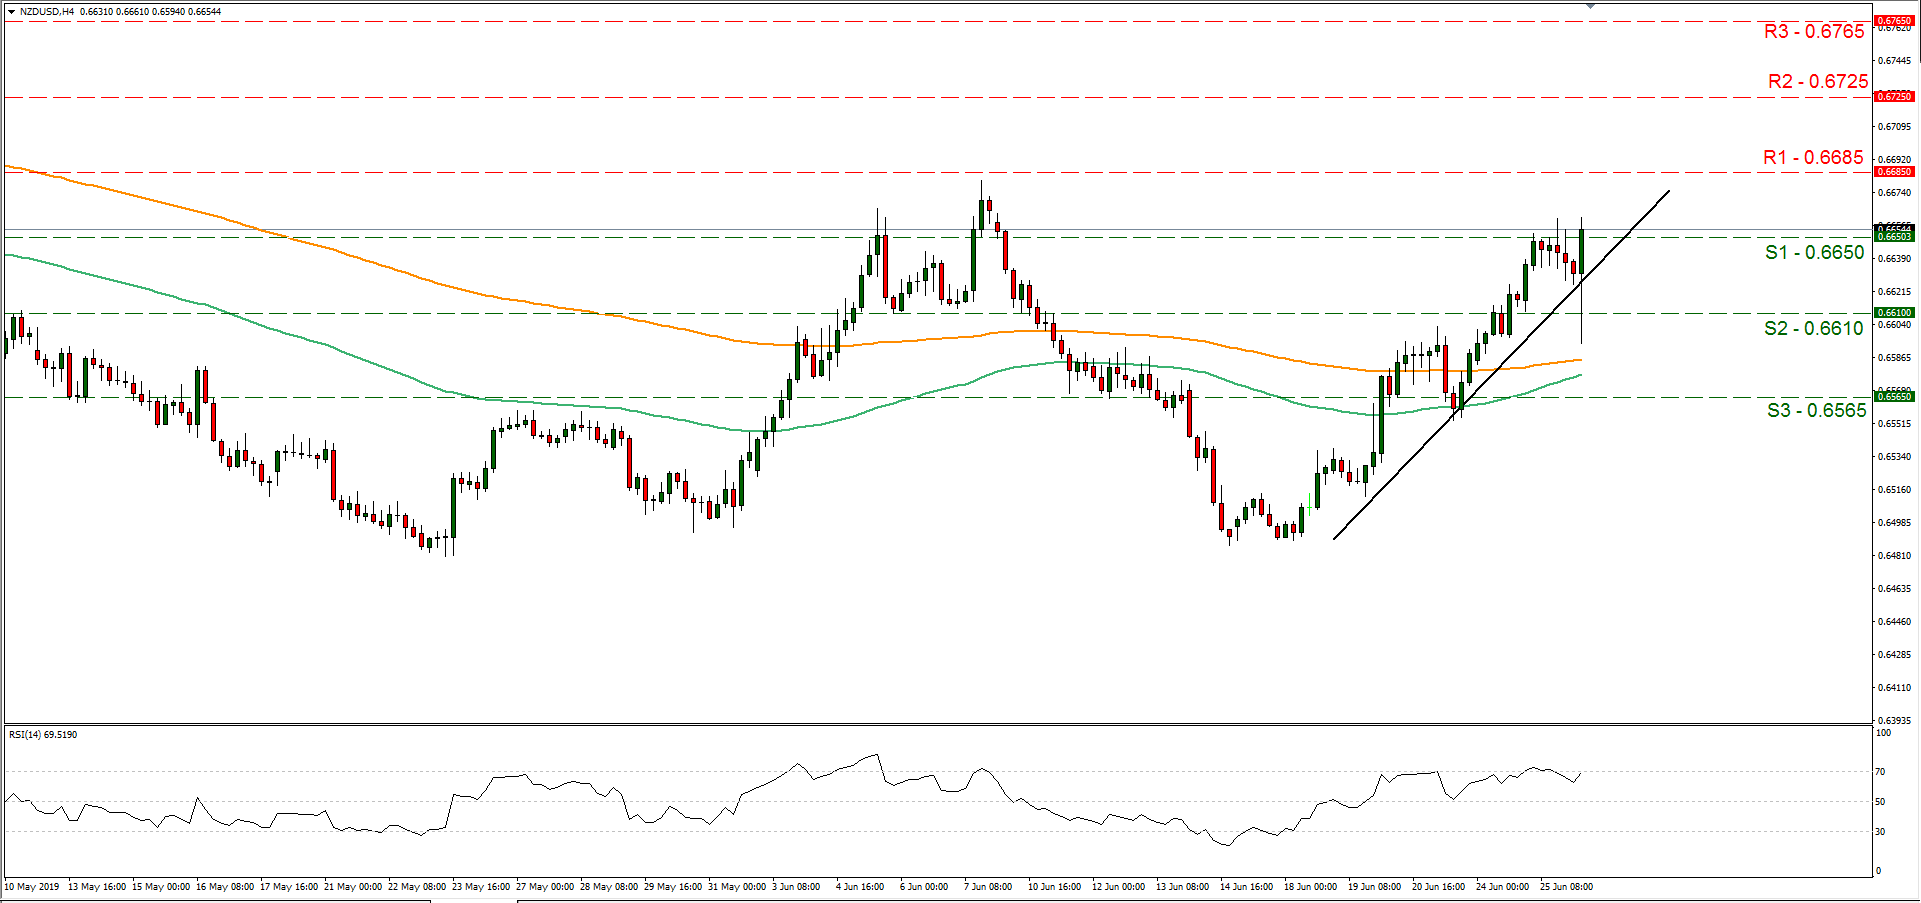
Support: 0.6650 (S1), 0.6610 (S2), 0.6565 (S3)
Resistance: 0.6685 (R1), 0.6725 (R2), 0.6765 (R3)
EUR/USD H4
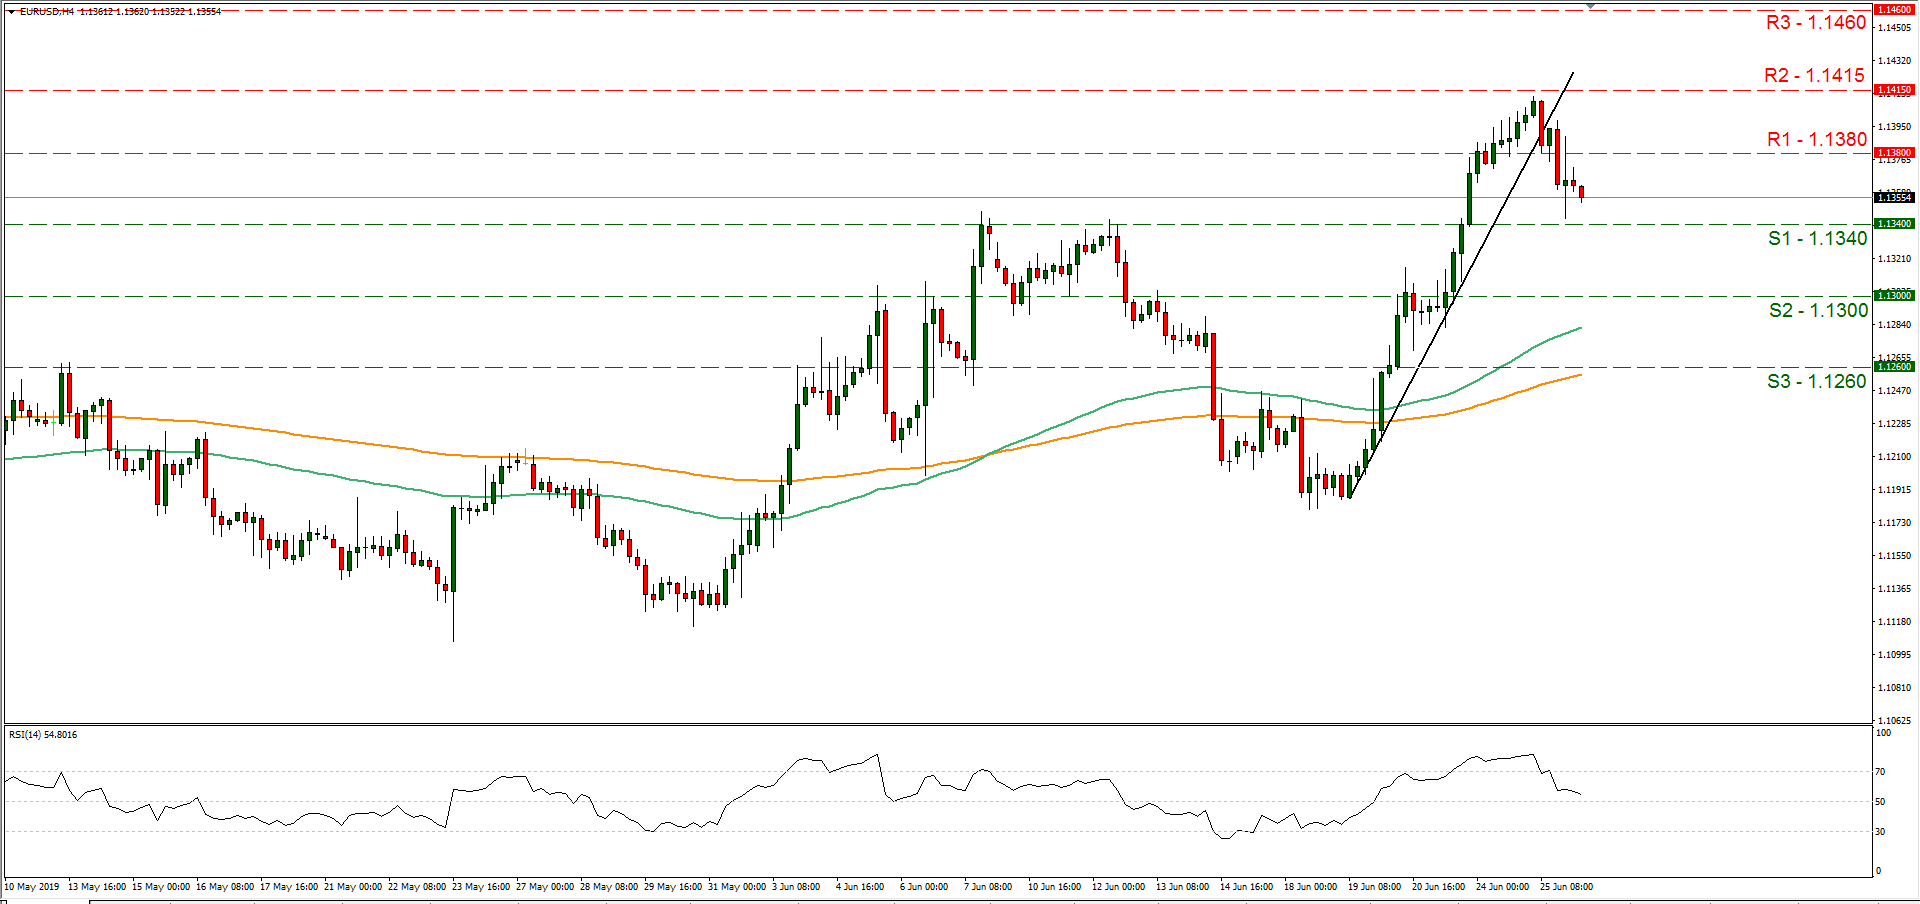
Support: 1.1340 (S1), 1.1300 (S2), 1.1280 (S3)
Resistance: 1.1380 (R1), 1.1415 (R2), 1.1460 (R3)
EUR/GBP Daily Outlook
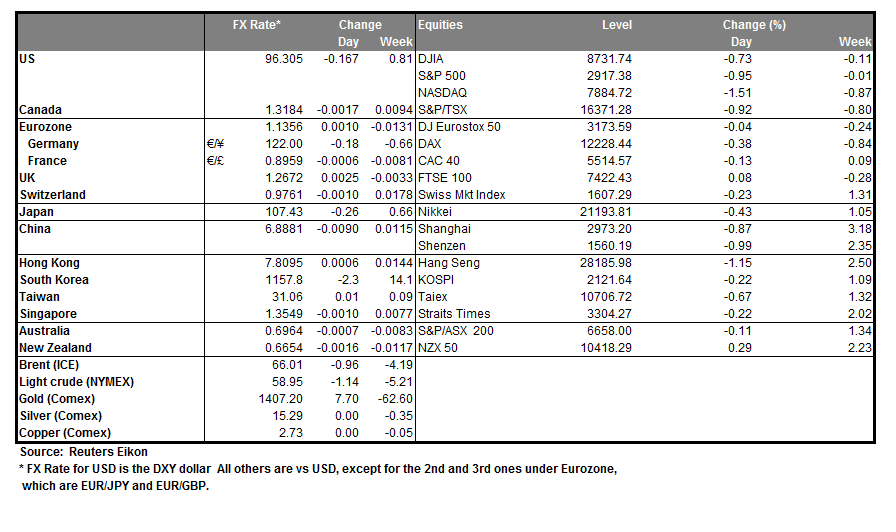
Daily Pivots: (S1) 0.8928; (P) 0.8946; (R1) 0.8977; More...
Intraday bias in EUR/GBP remains neutral at this point. With 0.8871 support intact, further rise is expected. On the upside, break of 0.8974 resistance will resume larger rally to 0.9101 key resistance next. However, considering bearish divergence condition in 4 hour MACD, break of 0.8871 will indicate short term topping. Deeper pull back could be seen to 55 day EMA (now at 0.8799).
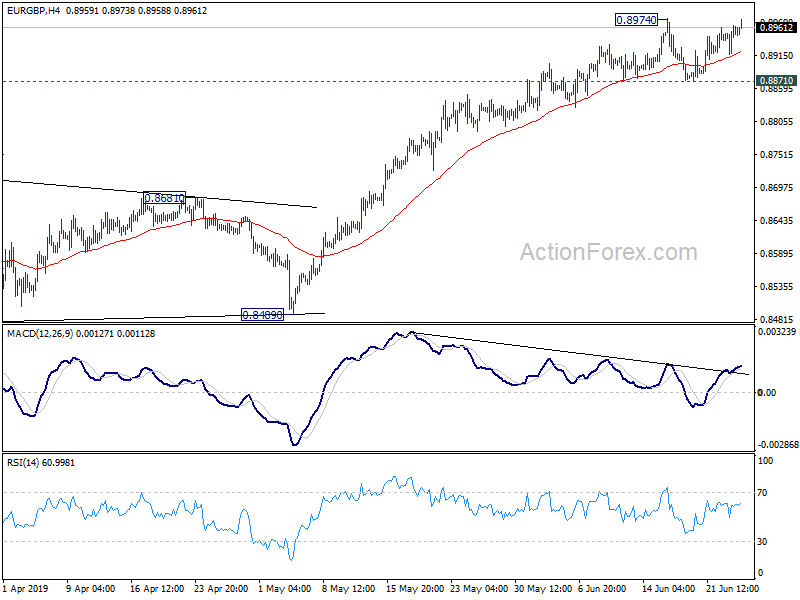
In the bigger picture, medium term decline from 0.9305 (2017 high) is seen as a corrective move. No change in this view. Current development argues that it might have completed with three waves down to 0.8472, just ahead of 38.2% retracement of 0.6935 (2015 low) to 0.9306 at 0.8400, after hitting 55 month EMA (now at 0.8527). Decisive break of 0.9101 resistance will confirm this bullish case. Nevertheless, as EUR/GBP is still staying inside long term falling channel, correction from 0.9305 could still extend to 0.8400 fibonacci level before completion, if upside is rejected by 0.9101.
GBP/USD Outlook: Cable Extends Pullback On Comments From Johnson/Fed, BoE Carney’s Speech In Focus
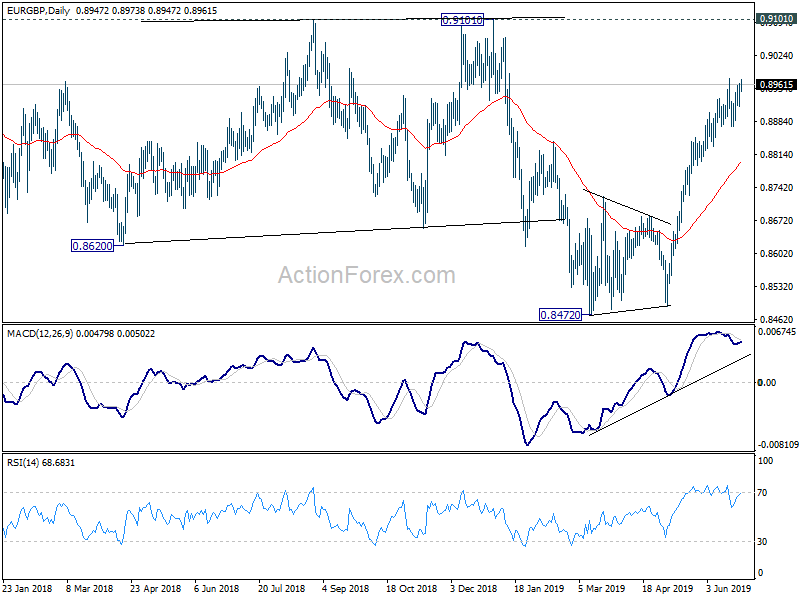
Cable extends pullback on Wednesday after double rejection at key Fibo barrier at 1.2763 (38.2% of 1.3179/1.2505), probing through lower pivots at 1.2677 (Fibo 38.2% of 1.2505/1.2783 upleg/30SMA) and 1.2667 (20SMA).
Fresh bears are inflated by comments from PM candidate Johnson on 31 Oct exit, with or without deal and softer tone from Fed officials regarding rate cut that boosted dollar.
Technical studies also support pullback as daily momentum broke into negative territory and stochastic heads south after reversing from overbought zone.
Close below 1.2677 pivot is needed to confirm reversal and signal further easing towards 1.2611 (Fibo 61.8% of 1.2505/1.2783).
Traders focus on UK inflation report and speech from BoE Governor Carney that would provide fresh signals.
Res: 1.2696, 1.2708, 1.2763, 1.2783
Sup: 1.2653, 1.2611, 1.2571, 1.2542
EUR/AUD Daily Outlook
Daily Pivots: (S1) 1.6291; (P) 1.6348; (R1) 1.6387; More...
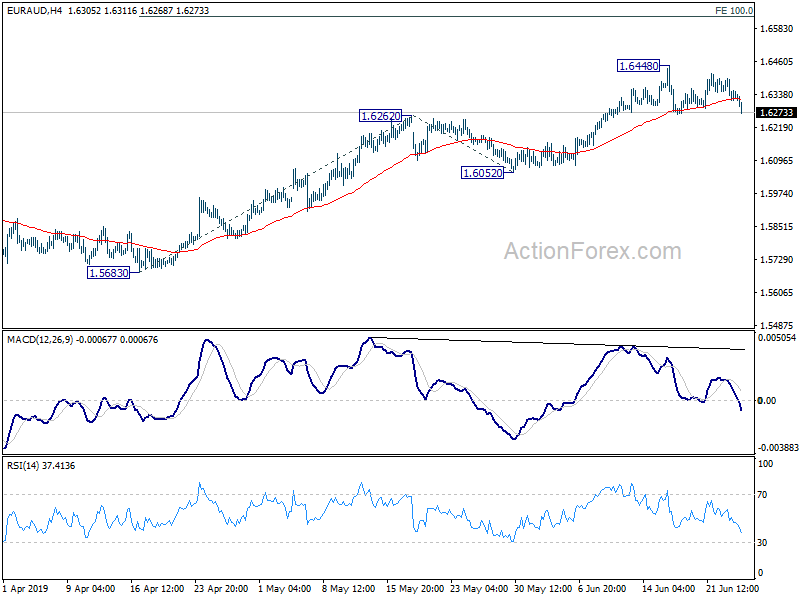
EUR/AUD's is staying in consolidation from 1.6448 and intraday bias remains neutral at this point. Deeper pull back could be seen but downside should be contained above 1.6052 support to bring rise resumption. On the upside, break of 1.6448 will resume the rally from 1.5683 and target 100% projection of 1.5683 to 1.6262 from 1.6052 at 1.6631 next.
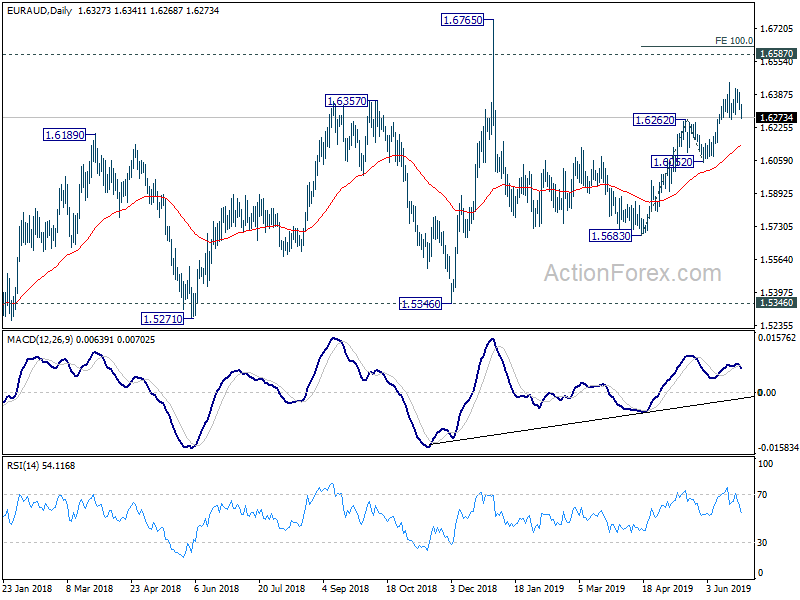
In the bigger picture, as long as 1.5346 support holds, outlook will still remain bullish. Up trend from 1.1602 (2012 low) is expected to resume sooner or later. Break of 1.6765 will target 61.8% retracement of 2.1127 (2008 high) to 1.1602 at 1.7488 next. However, firm break of 1.5346 key support will indicate trend reversal and turn outlook bearish.
EUR/CHF Daily Outlook
Daily Pivots: (S1) 1.1059; (P) 1.1092; (R1) 1.1121; More...
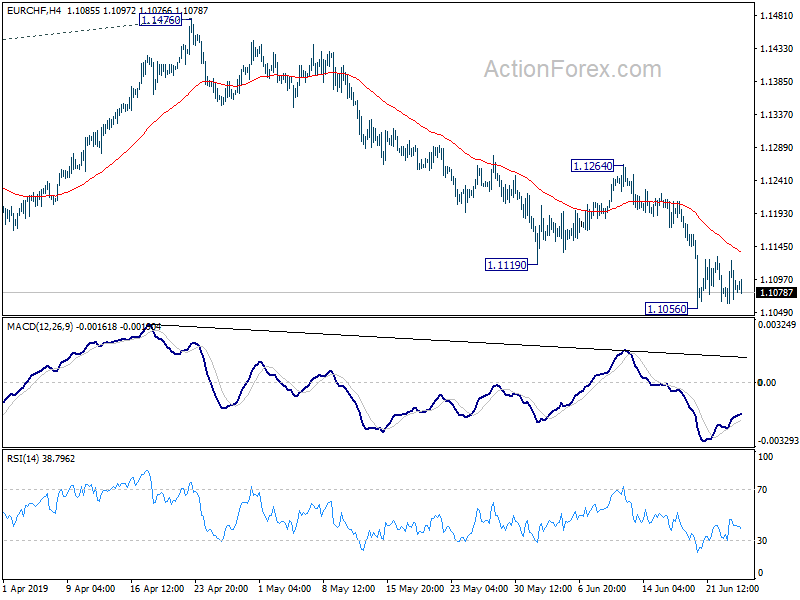
EUR/CHF is staying in consolidation from 1.1056 temporary low and intraday bias remains neutral for the moment. In case of another recovery, upside should be limited below 1.1264 resistance to bring further decline. On the downside, break of 1.1056 will resume the larger down trend for 61.8% projection of 1.2004 to 1.1173 from 1.1476 at 1.0962 next.
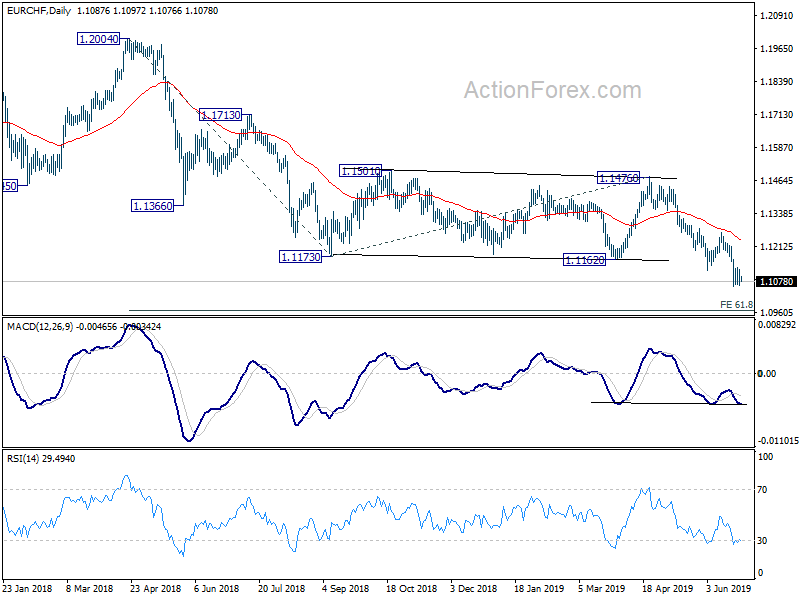
In the bigger picture, current development firstly suggests that down trend from 1.2004 is still in progress. More importantly, it's likely a long term down trend itself, rather than a correction. Outlook will remain bearish as long as 1.1476 resistance holds. EUR/CHF could target 1.0629 support and below.
The Analytical Overview Of The Main Currency Pairs
The EUR/USD currency pair
Technical indicators of the currency pair:
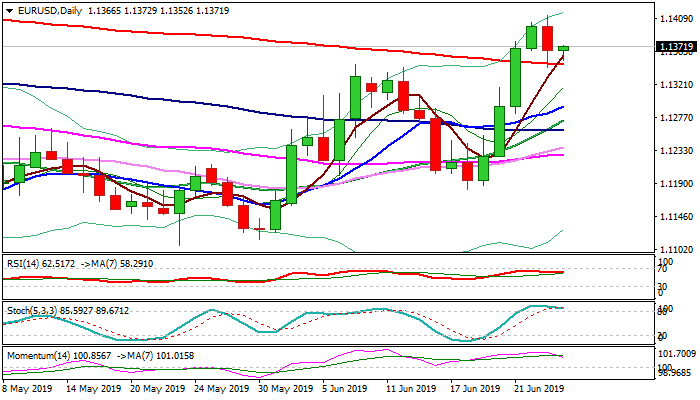
Prev Open: 1.13982
Open: 1.13665
% chg. over the last day: -0.26
Day's range: 1.13526 – 1.13723
52 wk range: 1.1111 – 1.2009
Yesterday, the USD recovered some of its losses against the other world currencies. This movement was largely caused by technical factors. Investors began to partially fix positions. The EUR/USD currency pair has updated local minima. At the moment, the trading instrument is consolidating in the range of 1.13400-1.13750. We do not exclude further correction of EUR/USD quotes. Fed Chairman Jerome Powell stressed the independence of the Central Bank from US President Donald Trump, who insists on lowering the rates. Currently, more than 75% of financial market participants expect the Fed to reduce the range of key interest rates by 25 basis points to 2.00% -2.25% at a meeting in July. Positions must be opened from key levels.
The Economic News Feed for 26.06.2019:
Durable Goods Reports (EU) – 00:00 (GMT+3:00);
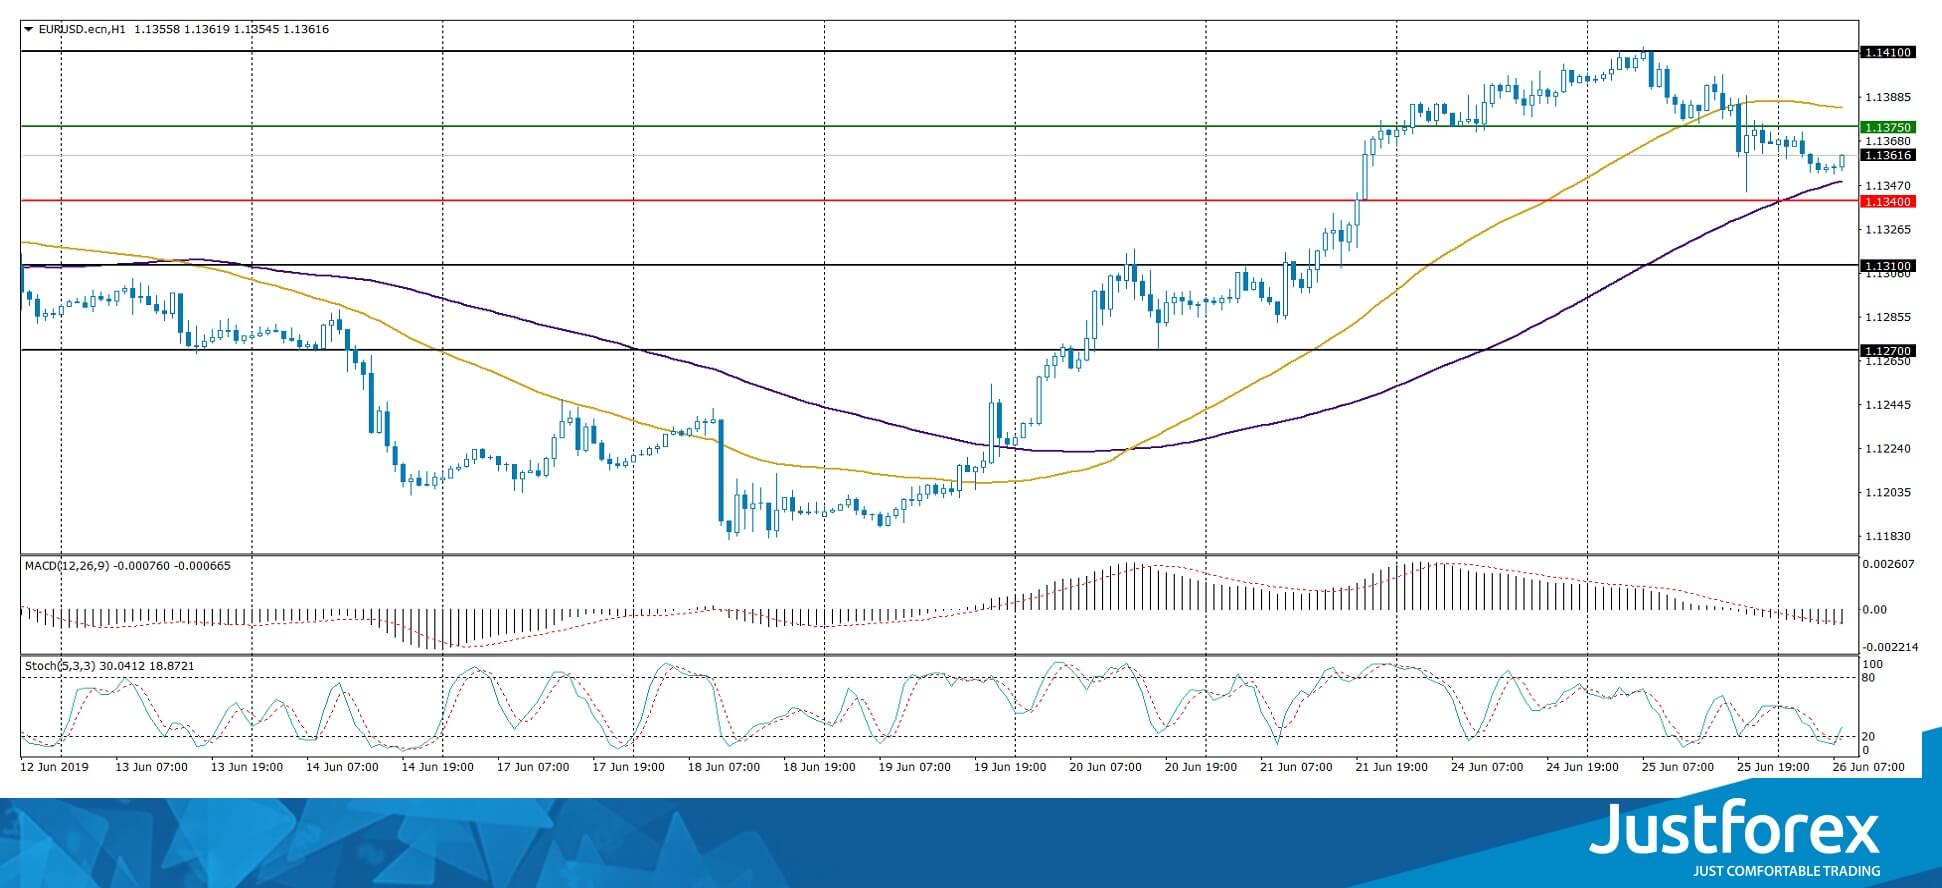
The indicators do not provide precise signals, the price fixed between 50 MA and 100 MA.
The MACD histogram is in the negative zone and keeps lowering which points towards a further correction.
The Stochastic Oscillator is in the oversold zone, the %K line is crossing the %D line. There are no signals at the moment.
Trading recommendations
Support levels: 1.13400, 1.13100, 1.12700
Resistance levels: 1.13750, 1.14100, 1.14500
If the price fixes below 1.13400, expect further correction towards 1.13100-1.12800.
Alternatively, the quotes can grow towards 1.14100-1.14400.
The GBP/USD currency pair
Technical indicators of the currency pair:
Prev Open: 1.27142
Open: 1.26861
% chg. over the last day: -0.39
Day's range: 1.26655 – 1.26938
52 wk range: 1.2438 – 1.3631
The GBP/USD currency pair has moved to decline after a long rally. GBP set new local minimums. At the moment, the GBP/USD quotes are consolidating near the demand zone of 1.26400-1.26650. 1.27150 acts as a “mirror” resistance. The trading instrument has the potential for further correction. Today we recommend to pay attention to economic releases from the USA. Positions must be opened from key levels.
The Economic News Feed for 26.06.2019 is calm.
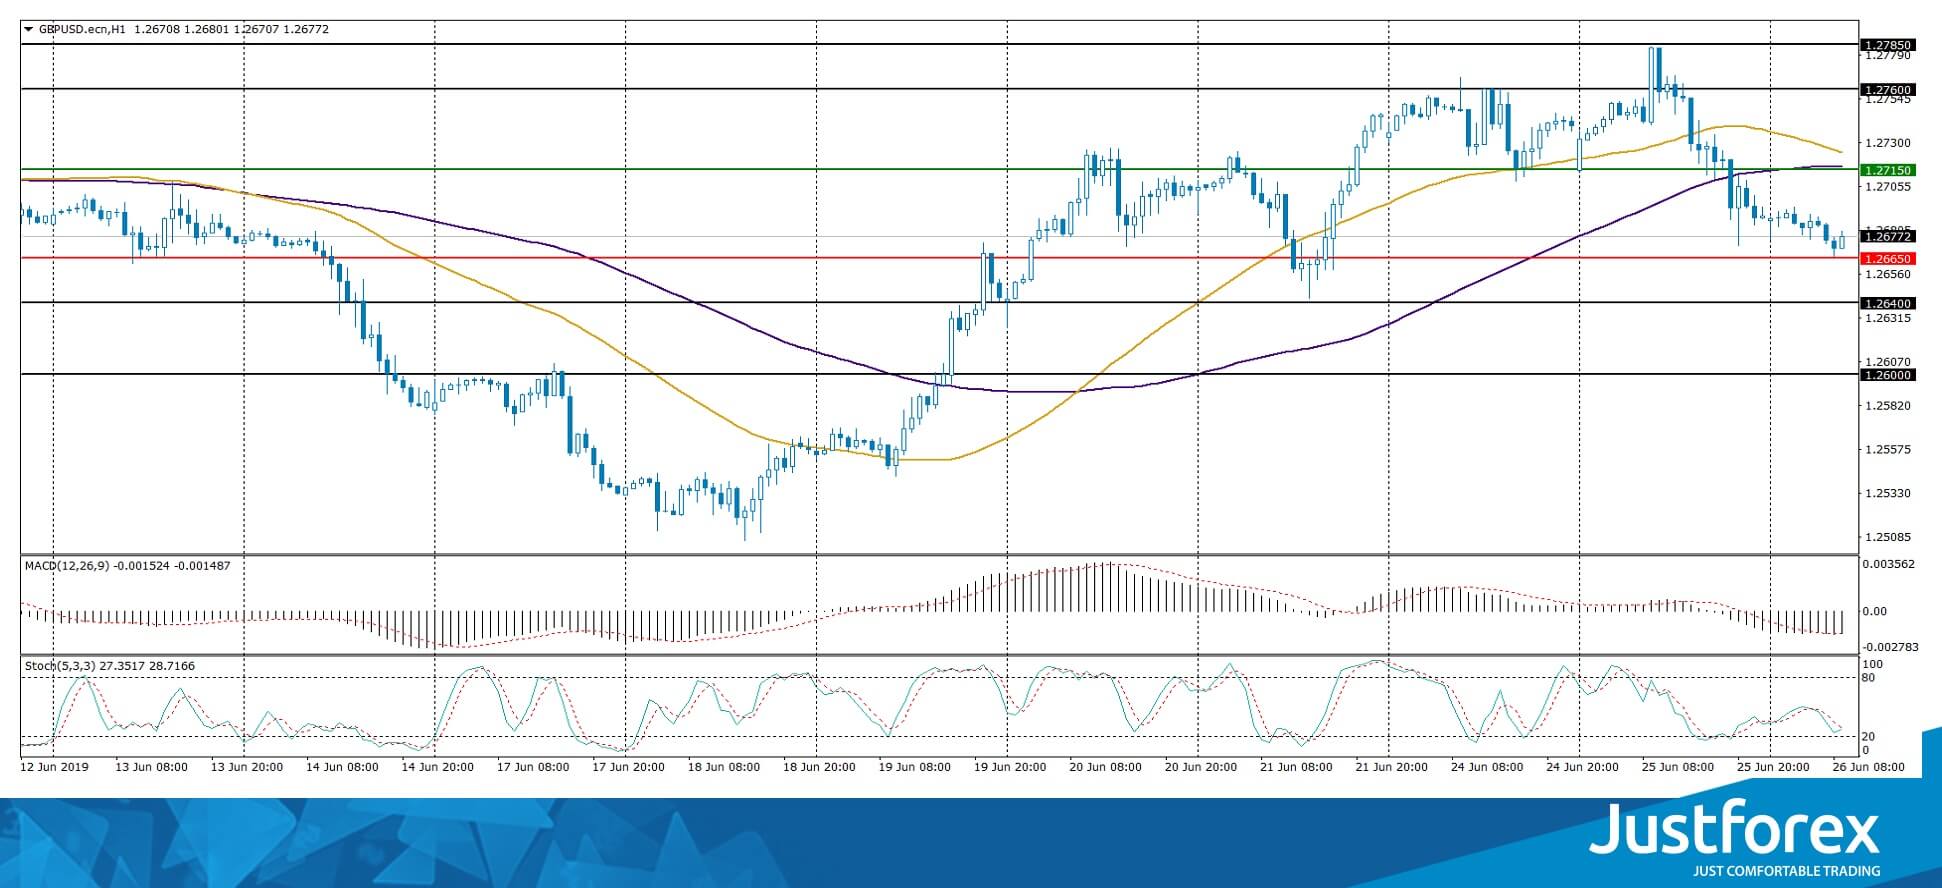
The price fixed below 100 MA which points towards the power of the sellers.
The MACD histogram is in the negative zone and keeps lowering which points towards a further correction of GBP/USD.
The Stochastic Oscillator is in the neutral zone, the %K line is crossing the %D line. There are no signals at the moment.
Trading recommendations
Support levels: 1.26650, 1.26400, 1.26000
Resistance levels: 1.27150, 1.27600, 1.27850
If the price fixes below 1.26650, expect further correction towards 1.26300-1.26000.
Alternatively, the quotes can grow towards 1.27400-1.27600.
The USD/CAD currency pair
Technical indicators of the currency pair:
Prev Open: 1.31794
Open: 1.31687
% chg. over the last day: -0.05
Day's range: 1.31647 – 1.31952
52 wk range: 1.2727 – 1.3664
The USD/CAD remains in a long flat. There is no defined trend. At the moment, the following local levels of support and resistance can be distinguished at 1.31600 and 1.32000, respectively. Technical correction is possible soon. You should pay attention to economic releases from the US, as well as the dynamics of oil prices. Positions must be opened from key levels.
The Economic News Feed for 26.06.2019 is calm.
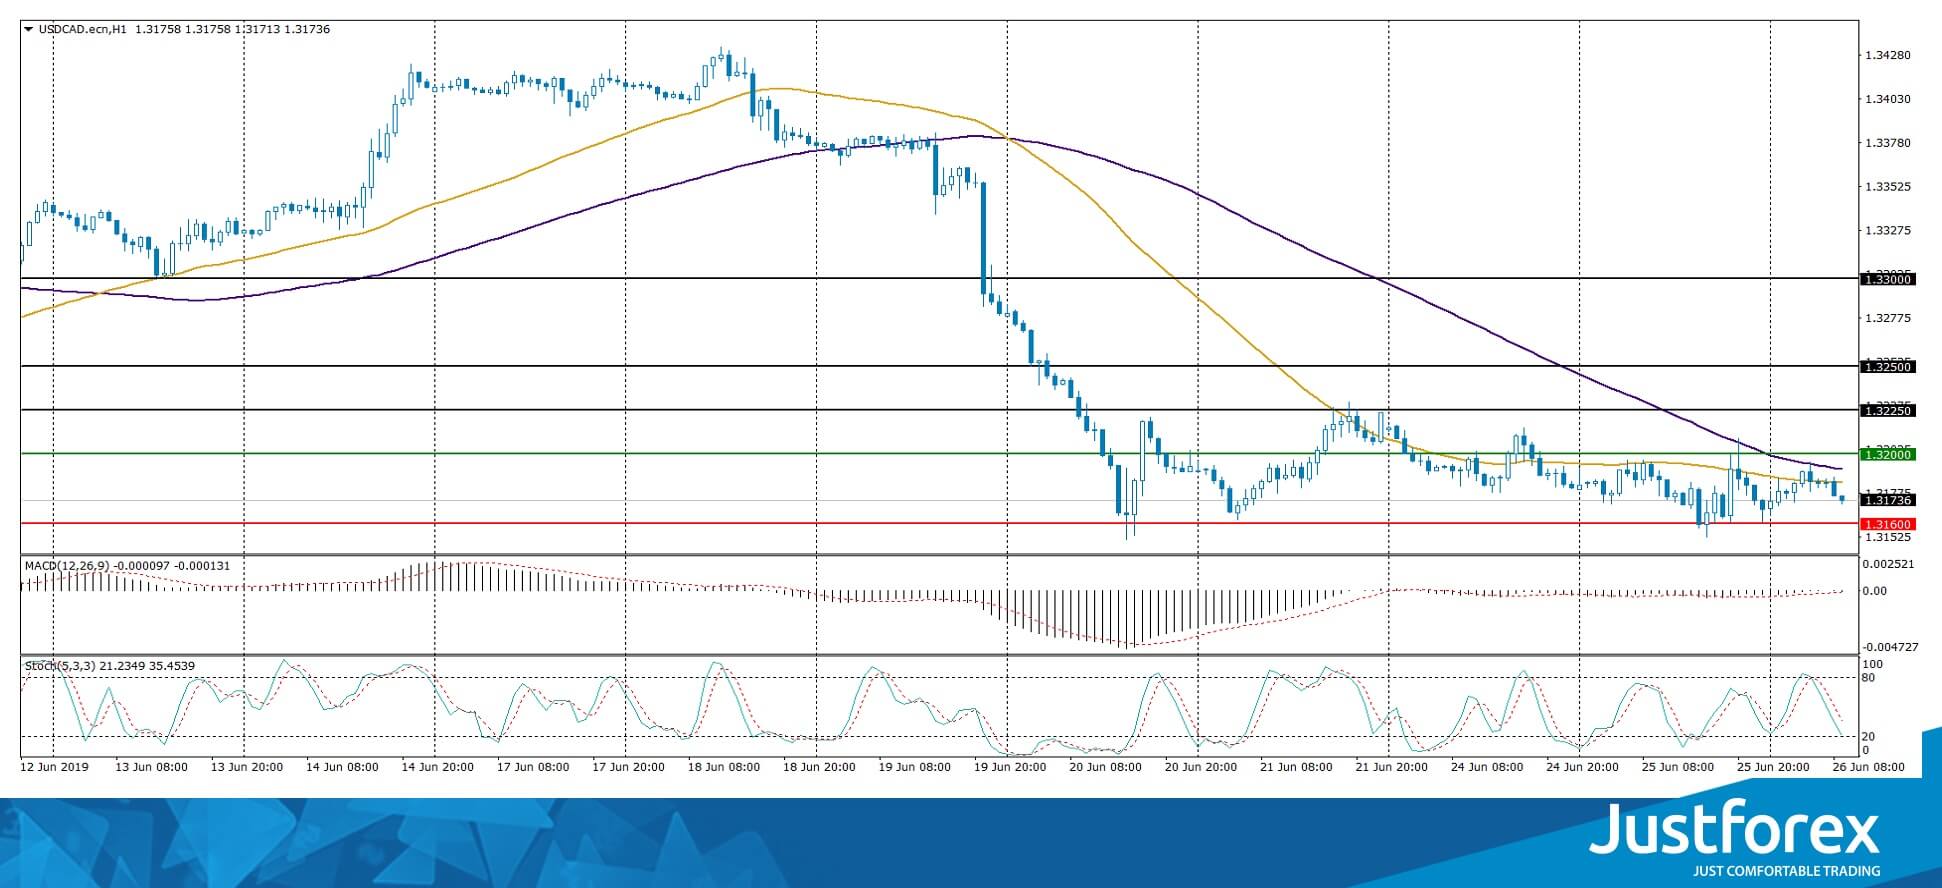
The indicators do not provide precise signals, the price has crossed 50 MA and 100 MA.
The MACD histogram is close to 0. There are no signals.
The Stochastic Oscillator is in the neutral zone, the %K line is below the %D line. There are no signals.
Trading recommendations
Support levels: 1.31600, 1.31300, 1.31000
Resistance levels: 1.32000, 1.32250, 1.32500
If the price fixes below 1.31600, expect further descend towards 1.31300-1.31000.
Alternatively, the quotes can correct towards 1.32400-1.32600.
The USD/JPY currency pair
Technical indicators of the currency pair:
Prev Open: 107.289
Open: 107.170
% chg. over the last day: -0.07
Day's range: 107.098 – 107.502
52 wk range: 104.97 – 114.56
USD/JPY currency pair retreated from monthly lows. At the moment, the technical picture is ambiguous. The quotes are consolidating near the local resistance of 107.500. Mark 107.100 is a key support. The trading tool has the potential for further recovery. We recommend to pay attention to the dynamics of US government bonds. Positions must be opened from key levels.
The Economic News Feed for 26.06.2019 is calm.
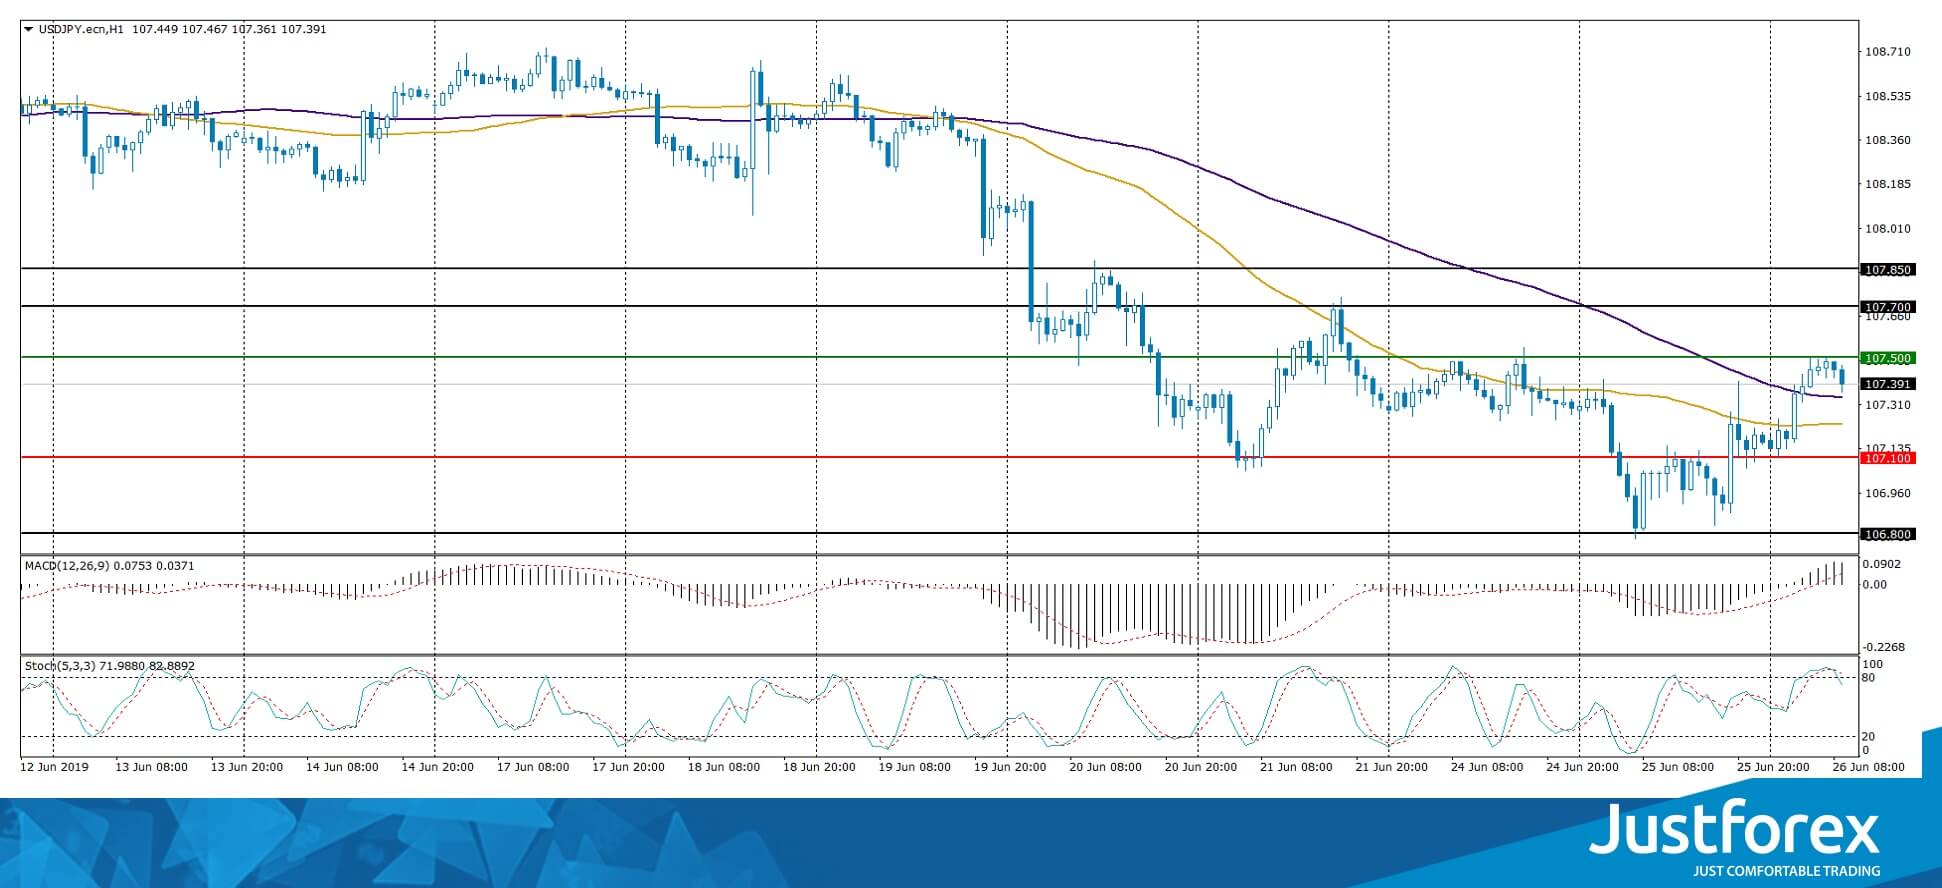
The price fixed below 50 MA and 200 MA which points to the power of the sellers.
The MACD histogram is in the negative zone and below the signal line which gives a strong signal to sell USD/JPY.
The Stochastic Oscillator is in the neutral zone, the %K line is above the %D line which points to the bullish mood.
Trading recommendations
Support levels: 106.800, 106.500
Resistance levels: 107.100, 107.400, 107.700
If the price fixes below 106.800, expect further descend towards 106.500-106.300.
Alternatively, the quotes can grow towards 107.400-107.600.
EUR/USD Outlook: Bearish Engulfing On Tuesday But 200SMA Holds Pullback For Now
The Euro is standing at the back foot in early Wednesday's trading, following Tuesday's close in red, which formed bearish outside day.
Four-day rally repeatedly failed at 1.1400 barrier, as massive weekly cloud weighs heavily (cloud base lays at 1.1436) and subsequent easing was triggered by lowered tone from Fed, which reduced expectations for aggressive rate cut, saying that 0.5% cut would be overdone.
Falling 200SMA (1.1347) contained Tuesday's pullback, preventing deeper correction for now, however, daily techs show momentum heading south and stochastic about to reverse from overbought territory.
Fresh bears need clear break below 200SMA to regain control and extend pullback towards next pivot at 1.1324 (Fibo 38.2% of 1.1181/1.1412 upleg).
Conversely, bulls will remain in play while 200SMA holds, with extended consolidation expected to precede renewed attempts through psychological 1.1400 barrier.
Res: 1.1393, 1.1404, 1.1412, 1.1436
Sup: 1.1347, 1.1324, 1.1296, 1.1279
Forex Technical Analysis: EUR/USD, USD/JPY, GBP/USD
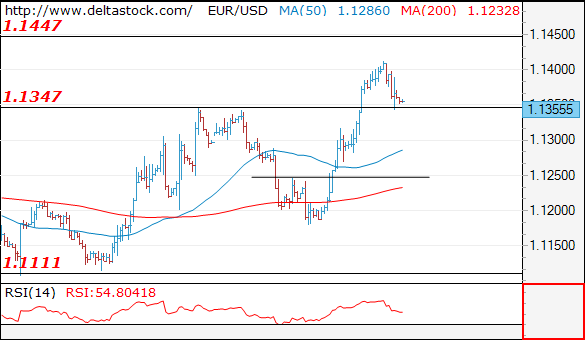
EUR/USD
Current level - 1.1355
The upmove since 1.1180 low is over with yesterday's peak at 1.1410 and the pair is currently testing 1.1350 static support. My outlook here is neutral
| Resistance | Support | ||
| intraday | intraweek | intraday | intraweek |
| 1.1450 | 1.1570 | 1.1350 | 1.1110 |
| 1.1570 | 1.1820 | 1.1250 | 1.1010 |
USD/JPY
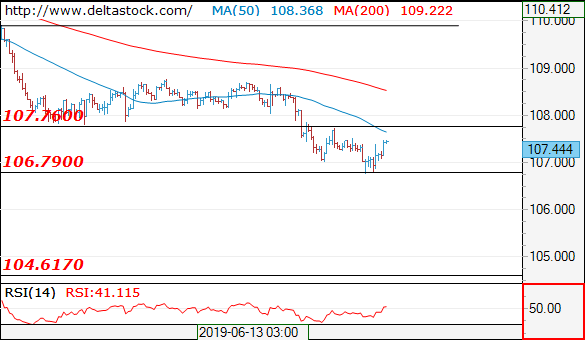
Current level - 107.44
The corrective pattern continues to unfold and only a break through 106.70 boundary will unleash a slide towards 104.60 zone.Key static resistance lies at 107.70.
| Resistance | Support | ||
| intraday | intraweek | intraday | intraweek |
| 107.20 | 109.90 | 106.70 | 106.70 |
| 108.70 | 112.40 | 106.70 | 104.50 |
GBP/USD
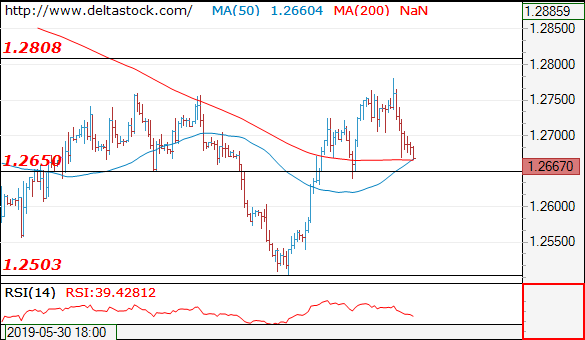
Current level - 1.2667
A reversal has been confirmed at 1.2780 and the bias is negative, for a dip to 1.2600 area. Initial resistance lies at 1.2705.
| Resistance | Support | ||
| intraday | intraweek | intraday | intraweek |
| 1.2705 | 1.2890 | 1.2650 | 1.2503 |
| 1.2810 | 1.3170 | 1.2600 | 1.2420 |