

Sample Category Title
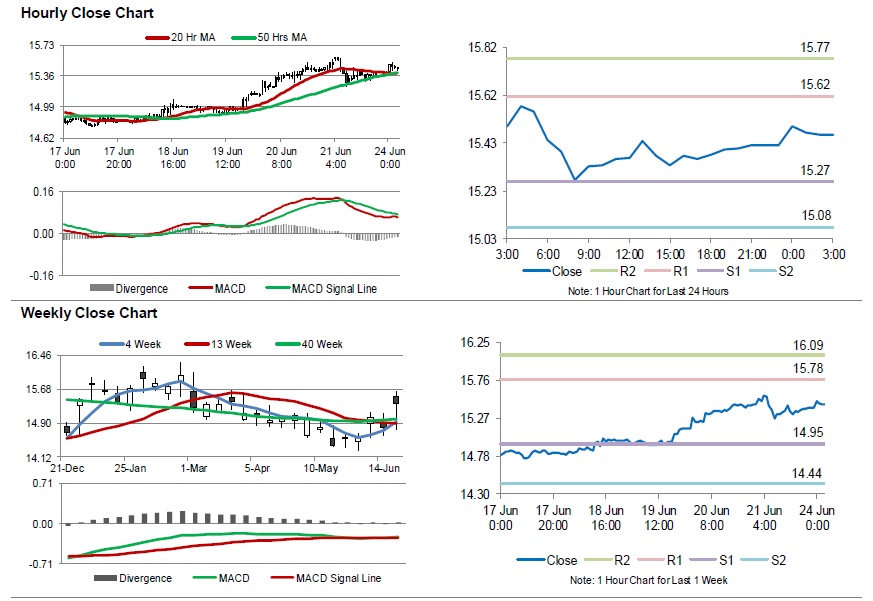
Silver: White Metal Reverses Its Losses In The Morning Session
For the 24 hours to 23:00 GMT, Silver declined 0.23% against the USD and closed at USD15.41 per ounce on Friday, tracking gains in gold prices.
In the Asian session, at GMT0300, the pair is trading at 15.46, with silver trading 0.36% higher against the USD from Friday’s close.
The pair is expected to find support at 15.27, and a fall through could take it to the next support level of 15.08. The pair is expected to find its first resistance at 15.62, and a rise through could take it to the next resistance level of 15.77.
The white metal is trading above its 20 Hr and 50 Hr moving averages.
Crude Oil: Oil Trading Extends Its Gains In The Asian Session
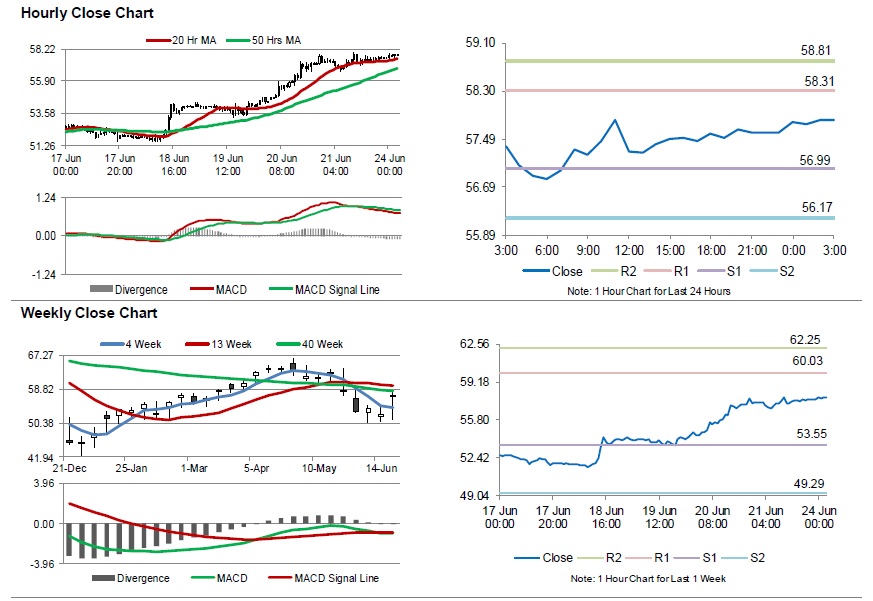
For the 24 hours to 23:00 GMT, Crude Oil rose 0.59% against the USD and closed at USD57.65 per barrel on Friday, amid possible interruption in global crude supplies due to ongoing Middle East tensions.
Meanwhile, fresh figures from Baker Hughes disclosed that the number of active oil rigs rose by 1 to 789 in the week ended 21 June 2019.
In the Asian session, at GMT0300, the pair is trading at 57.82, with oil trading 0.29% higher against the USD from Friday’s close.
The pair is expected to find support at 56.99, and a fall through could take it to the next support level of 56.17. The pair is expected to find its first resistance at 58.31, and a rise through could take it to the next resistance level of 58.81.
Crude oil is trading above its 20 Hr and 50 Hr moving averages.
RBNZ to stand pat this week, NZDUSD & NZDJPY stay near term bearish
RBNZ rate decision is a major focus of the week. After lowering the policy rate by -25 bps to 1.50% in May, the central bank would likely remain on hold this month. Domestic economic developments came in largely consistent with policymakers' projections. Q1 GDP growth beat RBNZ's expectations, but breakdowns were mixed. Forward-looking indicators signaled that risks to growth are skewed to the downside.
Global economic outlook remains uncertain and major central banks have recently shifted their stance on the dovish side. It is unlikely that G20 summit this week would resolve US-China trade war. At best, both sides would agree to resume negotiations. All these should lead the RBNZ to adopt a cautious tone this month, while opening the door for reducing interest rates again later this year.
Here are some previews:
- RBNZ Preview – Maintaining Cautious Tone to Pave Way for Further Cuts
- RBNZ Keen to Stay Ahead of Global Slowdown
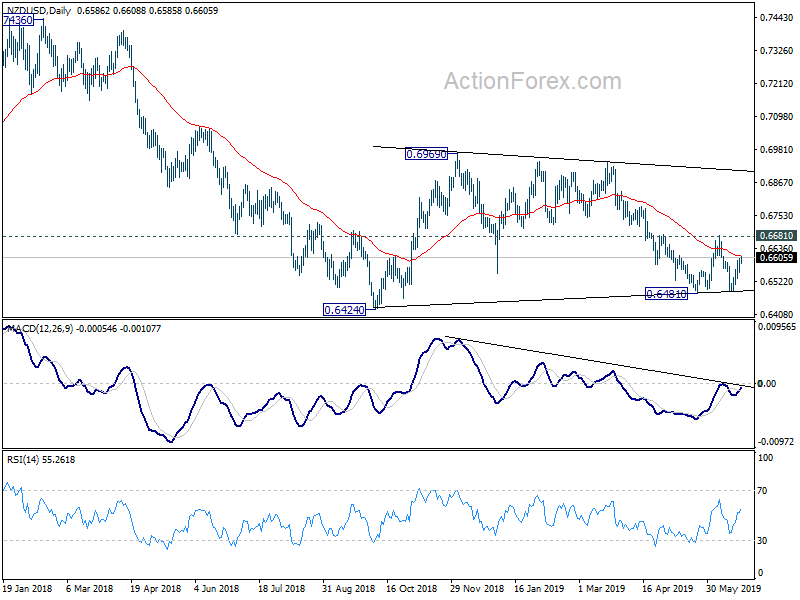
NZD/USD recovered ahead of 0.6481 support last week mainly due to Dollar's weakness. Upside of recovery is so far limited below 0.6681 resistance. Thus, near term outlook stays bearish for another decline through 0.6481 to 0.64245 low. Break will resume larger medium term down trend. Though, on the upside, break of 0.6681 will suggests that consolidation pattern from 0.6424 has started the third leg. Rise from 0.6481 could extend towards 0.6969 resistance before completing such consolidation.
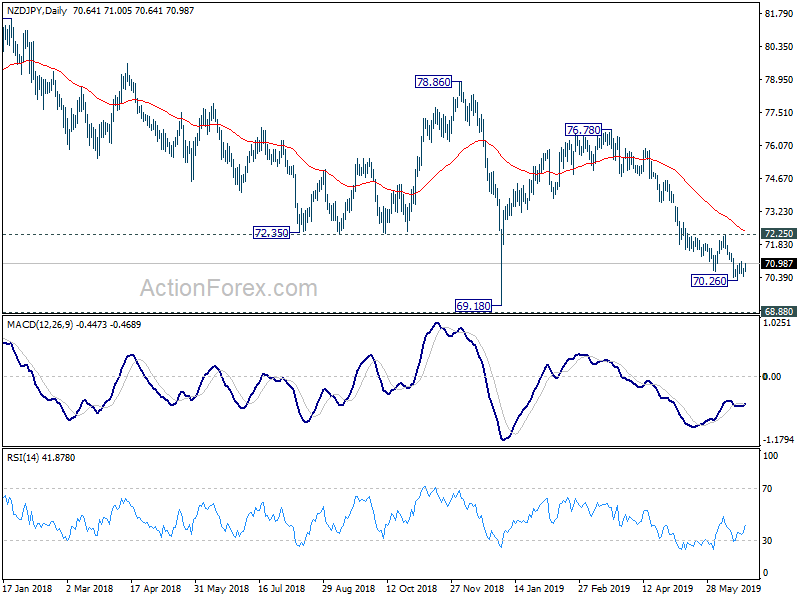
NZD/JPY turned sideway after hitting 70.26. Some consolidations might be seen in near term. But outlook remains bearish as long as 72.25 resistance holds. Current fall from 67.78 is expected to resume sooner or later to retest 69.18 low. Though, break of 72.25 will confirm short term bottoming and bring stronger rebound.
RBA Lowe: It legitimate to ask how effective further monetary easing would be
Australian Dollar is said to be lifted by RBA Governor Philip Lowe's question on effectiveness of further rate cuts. Lowe said in a panel discussion in Canberra today that "it's a legitimate question to ask how effective further monetary easing would be".
Lowe explained that exchange rate is an "important channel" through which easing stimulates growth. And other transmission mechanisms "are weaker at the moment." However, he added "we trade with one another, we don't trade with Mars, so if everyone's easing, the effect that we get from exchange-rate depreciation via the transmission mechanism isn't there."
Meanwhile, it's possible to ease more than other major central banks. But Lowe warned this was "quite a dangerous path to go down." Instead, he urged the country to switch focus to fiscal policy and structural reforms. Also, "governments here and around the world should have their top drawers full with ideas."
Lowe also said he didn't understand why investors were pushing stocks higher while expecting central banks to cut interest rates. He said "there are investors who think the outlook is sufficiently weak that they expect central banks right around the world to cut interest rates but they are not worried about corporate profits or credit risk."
Currently, markets are expecting RBA to cut interest rates by -50bps from 1.25% by year end. The next move could come as early as in August. To us, we also don't understand why Lowe's comments could shoot up the Aussie. He didn't indicate less need to loosen up monetary policies. Rather, he's simply suggesting that cutting interests are not enough to lift inflation back to target.
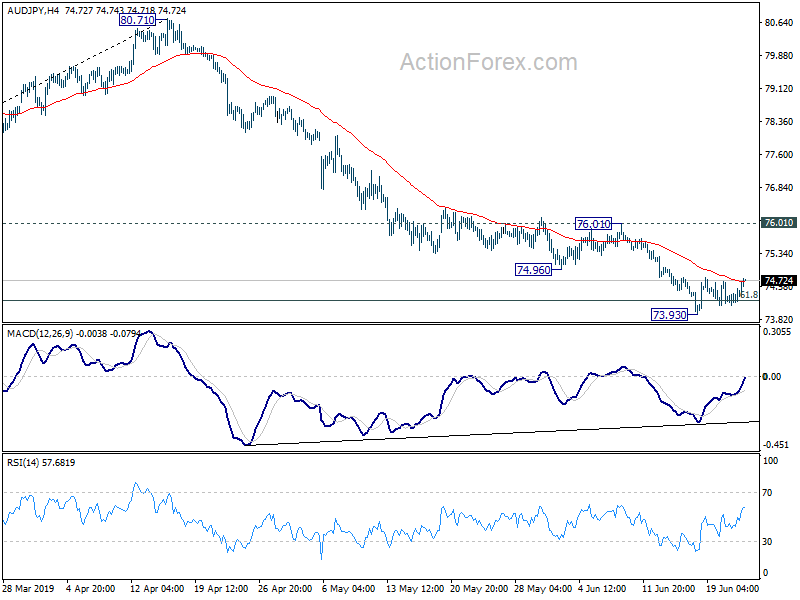
AUD/JPY is consolidating above 73.93 temporary low for the moment. Further recovery might be seen. But outlook remains bearish as long as 76.01 resistance holds. Fall from 80.71 is expected to resume sooner or later to 70.27 low.
China urges US to compromise and make concessions in trade talks
At a news briefing regarding G20 summit, Chinese Vice Commerce Minister Wang Shouwen said talks are underway between China and US teams regarding trade negotiations. He gave no details on the highly anticipated meeting between Xi and Trump ahead. Though, he reiterated China's stance on mutual respect and urged US to make concessions for compromises.
Wang said, "mutual respect means each side must respect the other's sovereignty", apparently referring US demand for China to implement the trade agreement with domestic laws. Wang also said "equality and mutual benefit means the consultations have to happen on an equal basis, the agreement to be reached has to be beneficial for both sides... Meeting each other half way means both sides have to compromise and make concessions, not just one side."
Wang also noted Xi has asked Trump to treat Chinese companies fairly during last week's telephone conversation. He added "we hope that the U.S. can remove certain unilateral measures inappropriately taken against Chinese companies, in the spirit of free trade and the World Trade Organization."
Risk Rally Continues After Friday’s Pause
It started slowly
After a slow, almost shaky start to trading at the beginning of the week, investors once more embraced risk and took equity indices higher along with risk-beta currencies.
US indices rose between 0.31% and 0.46% while China shares outperformed with a jump of 0.6%, though so far have failed to recoup all of Friday's losses. Hong Kong shares rose 0.13% following peaceful anti-extradition bill protests at the weekend.
RBA's Lowe sees economy benefiting from investment
While admitting the risks to the global economy are tilted to the downside, and the Australian economy has slowed, RBA Governor Philip Lowe implied that Australia would face more rate cuts but acknowledged that it was a legitimate question to ask how effective a global monetary easing cycle would be. He commented that the effect on exchange rates would be offset if everyone is following the same easing path.
He suggested that the Australian economy could benefit from more infrastructure spending, with lower rates elsewhere enabling the government to borrow at relatively cheap levels and boost infrastructure investment, that would benefit the local economy.
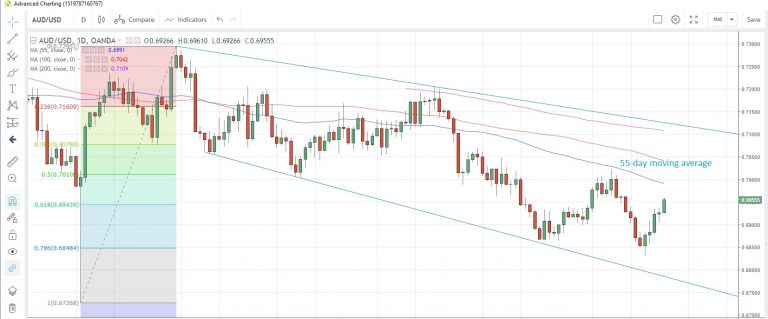
The Australian dollar climbed for a fifth consecutive day versus the US dollar, rising 0.4% to 0.6955 while it climbed 0.47% to 74.69 versus the Japanese yen. AUD/USD is nearing the 55-day moving average at 0.6991, which has capped prices since April 23.
AUD/USD Daily Chart
Oil pushes higher on sanctions
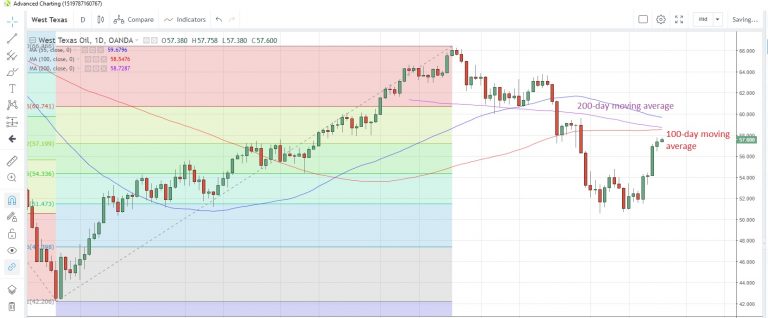
Crude oil prices continued to climb at the start of the week as additional US sanctions against Iran are due to be imposed today. West Texas Intermediate (WTI) rose the most in 16 months last week, reaching new highs for the month of Friday before easing back. The uptrend has continued today with prices rising 0.3% to $57.55.
The convergence of the 100-day and 200-day moving averages at $58.55 and $58.73 could act as the next resistance point.
WTI Daily Chart
German sentiment surveys on tap
It's a relatively quiet data calendar to kick off the week, with the German IFO surveys the highlight in Europe. The expectations index is seen slipping to 94.5 in June from 95.3 last month and both the business climate and current assessment indices are expected to show a slight deterioration from May.
The US session features the Chicago Activity index for May (another negative reading for the fifth straight month seen) while the Dallas Fed business index for June is expected to rebound to +4.8 from -5.3 in May.
Market Morning Briefing: Euro-Yen Has Bounced Well From 121
STOCKS
Asians are trading lower on increasing concerns/uncertainty over the US-Iran conflict. On the one hand, the US has said that it is ready to negotiate and not looking for any war. On the other hand, the US is ready to announce additional sanctions on Iran today. Indices like the Dow, DAX, Nikkei and Shanghai can see intermediate dips before their overall uptrend resumes. Sensex and Nifty, though are retaining their sideways range, looks vulnerable to break their range on the downside and fall in the coming days.
Dow (26719.13, -34.04, -0.13%) has come-off from it intermediate resistance at 26900. The outlook is bullish. But, a dip to test the supports at 26630 and 26580 is likely first before we see the uptrend resuming towards 27200 and 27500.
DAX (12339.92, -15.47, -0.13%) is not gaining strength to breach 12400 decisively. However, while above the support at 12300-12285 support zone, the outlook is bullish for it to breach 12400 and rise to 12600 and 12800 in the coming weeks.
Nikkei (21255.20, -3.44, -0.02%) has come-off sharply on Friday. Immediate supports are at 21250 and 21190. While above 21190, the bullish outlook for a rise to 21750 will remain intact. A break below 21190 will negate the bullish view and drag the Nikkei lower to 21000.
Shanghai (3003.81, +1.83, +0.06%) has decisively broken its 2835-2950 range on the upside last week as expected. A strong break above the immediate resistance at 3020 will pave way for 3050 and 3100. While 3020 holds, an intermediate dip to 2950 is possible before we see 3050-3100 on the upside.
The resistance near 39750 on the Sensex (39194.49, -407.14, -1.03%) and 11850 on the Nifty (11724.10, -107.65, -0.91%) has been holding very well. Sensex can fall to 38500 - the lower end of its 38500-39750 range. Nifty can test 11600 - the lower end of its 11600-11900 range. The bias is bearish for the indices to break their range on the downside and fall to 38000 (Sensex) and 11500-11450 (Nifty)
COMMODITIES
Overall commodities look bullish towards immediate resistances. We could see some rise in the near term before the commodities face rejection from respective resistances.
Gold (1410.20) is trading above 1400 again testing immediate resistance near 1410. Failure to fall from here immediately would indicate further bullishness towards 1425-1450 in the near term.
Silver (15.38) however is trading below immediate resistance near 15.60/65 as seen on the 3-day candles. While the resistance holds, silver could trade within 14.70 and 15.60/65 in the near term.
Copper (2.7045) could test resistance near 2.75/80 from where a rejection is possible in the medium term. On the downside 2.60 continues to remain as strong weekly support which is not likely to break. A small rejection from 2.80 is possible for the near term followed by resumption of upside rally in the longer run.
Crude prices rose sharply last week on US-Iran tensions and a drop in US Crude stockpiles. But after word came in that Trump has cancelled attacks on Iran and that some hope of positive talks between US and Chine in the G-20 summit this weekend could keep Crude prices stable.
WTI (57.78) has resistance on the daily candles near 60 which is likely to hold in the near term. A rise in Nymex WTI if seen could be short lived.
Brent (65.37) has immediate resistance near 67 while above 64 and could see a dip from there. Note that 67-69 is an important resistance zone and is likely to hold and push back Crude prices towards 64 or lower in the medium term.
FOREX
Dollar Index (96.11) is trading above support at 95.78 and while that holds, the index could attempt to rise towards earlier support turned resistance near 96.50. A break below 95.78 would turn bearish for the medium term towards 95 or even lower.
Euro (1.1383) has given bullish signal breaking above 1.1350. While the pair trades higher, it could target 1.14-1.15 in the near term.
Dollar-Yen (107.35) is trading above support at 107 and could trade within 107-108 region for now. A weaker Dollar Index could drag down Dollar-Yen towards 106 on the downside which is a crucial long term support. For now we may expect 107 to hold.
Euro-Yen (122.20) has bounced well from 121. Note that 122.50 is an immediate resistance which if holds could push back Euro-Yen towards 121. A break above 122.50 would take the pair higher towards 123-124 in the longer run.
Aussie (0.6955) is also trading below immediate resistance on the daily candles and could face a short rejection before moving higher towards 0.70.
Pound (1.2752) looks bullish towards 1.28-1.29 while above 1.2750.
USDINR (69.56) has room to test 69.25 on the downside and has resistance near 69.75 and higher at 69.90. Overall the pair is expected to trade within 69.75-69.25 in the near term.
INTEREST RATES
The US 30Yr (2.59%) and 10Yr (2.05%) yields have risen on Friday while the 5Yr (1.79%) and 2Yr (1.77%) remained stable. The 30Yr has resistance in the 2.60%-2.62% region which can cap the upside and pull it lower again towards 2.50% and 2.45% in the coming days. Similarly the 10Yr has resistance at 2.10% and can remain pressured on the downside to test 2.0% and even lower levels.
The German yields have been inching lower along with their trend line supports. The 30Yr (0.29%), 10Yr (-0.29%), 5Yr (-0.63%) and 2Yr (-0.75%) have fallen on Friday. The 30Yr can inch lower to 0.25% while it remains below 0.30%.
The 10Yr GoI (6.9945%) can consolidate in a broad sideways range between 6.90% and 7.10% within its overall downtrend. The bias will continue to remain negative for the 10Yr GOI to break 6.90% and fall to 6.80%-6.75% in the coming days.
GBP/USD And USD/CAD: US Dollar Could Slide Further
GBP/USD started a fresh increase and traded above the 1.2700 resistance area. Conversely, USD/CAD declined heavily and broke the 1.3200 support area to enter a bearish zone.
Important Takeaways for GBP/USD and USD/CAD
- The British Pound started a solid upward move once it broke the 1.2600 resistance.
- There is a key bullish trend line forming with support near 1.2705 on the hourly chart of GBP/USD.
- USD/CAD started a major drop after it broke the key 1.3300 support area.
- The pair is facing a solid resistance near 1.3225 and a bearish trend line with resistance near 1.3240 on the hourly chart.
GBP/USD Technical Analysis
The British Pound found support near 1.2500 and 1.2510 against the US Dollar, and recently started a fresh increase this past week. The GBP/USD pair broke the 1.2550 and 1.2600 resistance levels to move into a positive zone.
The recent upward move was positive since there was a close above the 1.2650 level and the 50 hourly simple moving average. The pair even broke the 1.2700 level and recently traded close to the 1.2750 level on FXOpen.
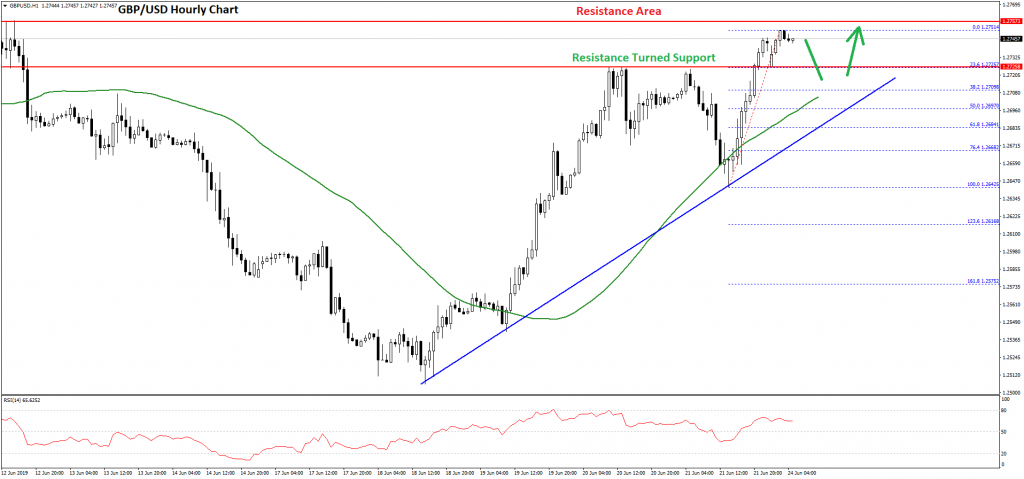
A swing high was formed at 1.2751 and the pair is currently consolidating gains. An initial support is near the 1.2725 level and the 23.6% Fib retracement level of the last wave from the 1.2642 low to 1.2751 high.
On the downside, there is a strong support formed near the 1.2700 level. There is also a key bullish trend line forming with support near 1.2705 on the hourly chart of GBP/USD.
The 50% Fib retracement level of the last wave from the 1.2642 low to 1.2751 high is near the 1.2697 level along with the 50 hourly SMA to provide support if the pair slides below 1.2725.
On the upside, an initial resistance is at 1.2750, above which the British Pound could continue to rise towards the 1.2800 resistance area in the coming sessions.
USD/CAD Technical Analysis
The US Dollar faced a strong resistance near the 1.3440 level against the Canadian Dollar. The USD/CAD pair started a major decline and broke the 1.3400 and 1.3360 support levels.
The decline gained pace after the broke the 1.3300 support levels and the 50 hourly simple moving average. It even broke the 1.3240 and 1.3200 support levels. A swing low was formed near 1.3150 and the price recently corrected higher.
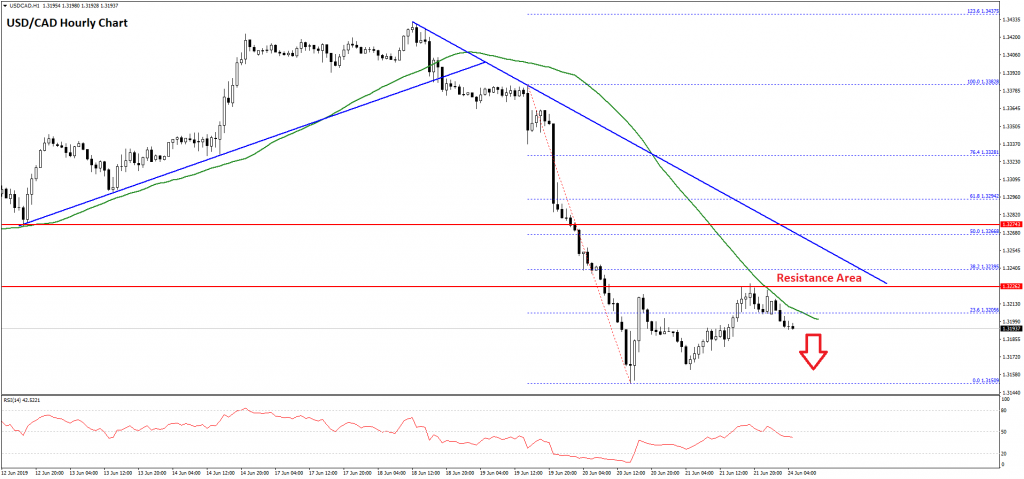
It recovered above the 1.3200 level and the 23.6% Fib retracement level of the last decline from the 1.3382 high to 1.3150 low.
However, the pair is currently struggling to clear the 1.3225 level and the 50 hourly simple moving average. Moreover, there is a bearish trend line forming with resistance near 1.3240 on the hourly chart.
The 38.2% Fib retracement level of the last decline from the 1.3382 high to 1.3150 low is close to the trend line resistance. Therefore, if the pair corrects higher, there are chances of it facing a lot of hurdles near the 1.3225 and 1.3240 levels.
If there is a break and close above 1.3240, the pair could start a decent upward move. The next key resistances are near 1.3280 and 1.3300.
On the downside, an initial support is near the 1.3180 level, below which the USD/CAD pair is likely to revisit the 1.3150 support level in the coming sessions. Below 1.3150, it might test 1.3120.
Daily Markets Broadcast
Wall Street consolidates near record highs
US indices gave back early gains to finish in the red on Friday as Middle east tensions caused a pause in the recent rally. Oil continues its move higher as more US sanctions against Iran are due to be imposed today.
US30USD Daily Chart
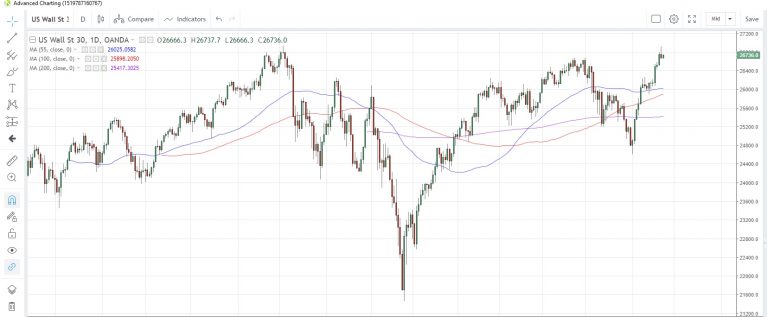
The US30 index snapped a four-day rising streak on Friday, but not before touching the highest since October 3
The index stalled ahead of the 26,940 high struck back in October last year, but has started this week positively and could launch another test of that high this week
The Chicago Fed activity index is expected to show a slight improvement to -0.37 in May from -0.45 the previous month, but would still be below zero for a fifth month in a row.
DE30EUR Daily Chart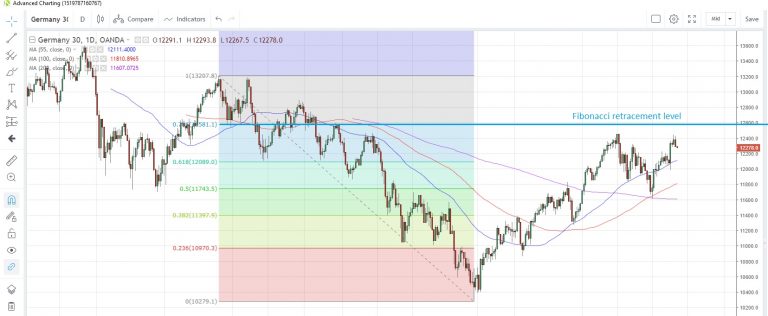
The Germany30 fell on Friday despite better-than-expected flash PMI readings for the major European economies in June
The May high of 12,452 is currently capping prices, while the 78.6% Fibonacci retracement of the May-December drop last year is at 12,581
Germany's IFO expectations index is seen slipping to 94.5 in June from 95.3 last month. The business climate index and current assessment index are both also expected to show a mild deterioration.
CN50USD Daily Chart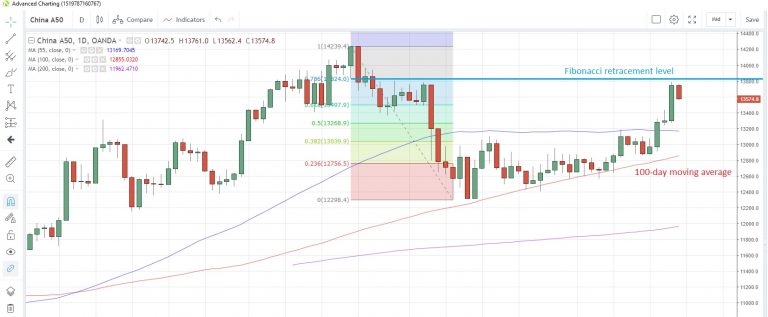
The China50 index brought a four-day raising streak to a halt on Friday, echoing the moves on Wall Street
The index has stalled below the 78.6% Fibonacci retracement level of the April-May drop at 13,824. The 100-day moving average at 12,855 could act as support
US White House Adviser Navarro has alleged that China is devaluing its currency to offset the US trade tariffs. NOTE: the offshore yuan rose 0.9% versus the US dollar last week.
EUR/USD Signaling Bullish Continuation Above 1.1350
Key Highlights
- The Euro gained momentum and broke the 1.1350 resistance against the US Dollar.
- EUR/USD is showing positive signs and it could rise above 1.1400 in the near term.
- The US Manufacturing PMI in June 2019 (Prelim) declined from 50.5 to 50.1.
- The German IFO Business Climate Index in June 2019 might slide from 97.9 to 97.3.
EURUSD Technical Analysis
After dovish signals from the Fed, the Euro stared a strong upward move above 1.1300 against the US Dollar. EUR/USD gained momentum above 1.1320 and it could continue to rise in the near term.
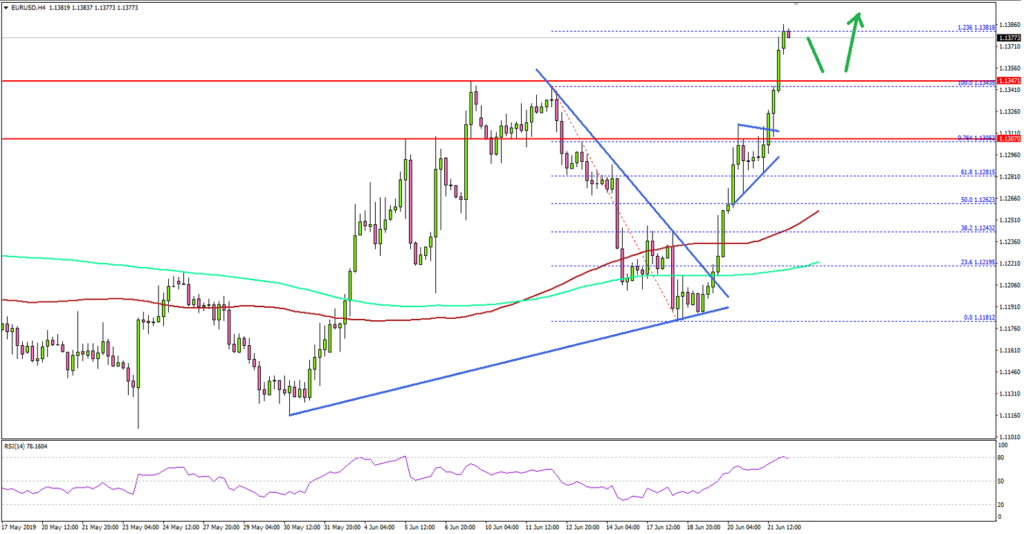
Looking at the 4-hours chart, the pair settled nicely above 1.1320 and the 100 simple moving average (red, 4-hours) to move into a positive zone.
The pair even surpassed the last swing high near 1.1347 and broke the 1.1350 resistance. It traded close to the 1.236 Fib extension level of the last side from the 1.1343 high to 1.1181 low.
The current price action is positive, suggesting more gains in EUR/USD above the 1.1400 and 1.1420 resistance levels. Conversely, if there is a downside correction, the previous resistances near 1.1340 and 1.1320 are likely to act as supports.
The main support is near the 1.1250 and the 100 simple moving average (red, 4-hours), below which the pair could turn bearish in the short term.
Fundamentally, the US Manufacturing PMI report for June 2019 (Prelim) was released by the Markit Economics. The market was looking for a minor decline in the PMI from 50.5 to 50.4.
The actual result was lower than the market forecast, as the US Manufacturing PMI declined from 50.5 to 50.1. Besides, the Services Purchasing Managers Index (PMI) also declined from 50.9 to 50.7.
The report added:
Manufacturers indicated only a fractional rise in production volumes in June, with the pace of expansion the slowest since the current phase of recovery began in mid-2016. Service providers also experienced the weakest business activity performance for around three years.
Overall, the US Dollar is clearly under a lot of pressure and pairs such as EUR/USD, GBP/USD and AUD/USD are likely to continue higher.
Economic Releases to Watch Today
- German IFO Business Climate Index June 2019 – Forecast 97.3, versus 97.9 previous.
- German IFO Current Assessment Index June 2019 – Forecast 100.0, versus 100.6 previous.
- Chicago Fed National Activity Index June 2019 – Forecast -0.37, versus -0.45 previous.