Sample Category Title
The US Currency IS Still Under Preesure
The US dollar has reached a low for three months against the basket of major currencies after the Fed meeting. The US currency is still under pressure since the regulator may reduce the key interest rate in the near future. The US dollar index #DX closed in the negative zone (-0.59%) yesterday.
Yesterday, the Bank of England left a key interest rate unchanged at 0.75%, as investors forecasted. At the same time, the regulator lowered the UK economic growth forecast to zero in the second quarter of 2019 and pointed out the risks associated with growing fears of no-deal Brexit. Also, a rather weak report on retail sales in the UK for May was published.
Mixed economic data from the US were published yesterday. Philadelphia Fed manufacturing index increased by only 0.3% in June, while experts expected growth by 10.6. However, initial jobless claims counted to 216K instead of 220K. Today we expect a report on existing home sales in the US, as well as a number of indicators on economic activity in the Eurozone.
The "black gold" prices are rising. At the moment, futures for the WTI crude oil are testing the mark of $57.25 per barrel.
Market Indicators
- Yesterday, the bullish sentiment was observed in the US stock market: #SPY (+0.96%), #DIA (+0.95%), #QQQ (+0.93%).
- The 10-year US government bonds yield has become stable after a significant collapse the day before. Currently, the indicator is at the level of 2.02-2.03%.
The news feed on 2019.06.21:
- Statistics on economic activity in Germany and the Eurozone at 10:30 (GMT+3:00) and 11:00 (GMT+3:00);
- Core retail sales in Canada at 15:30 (GMT+3:00);
- Existing home sales in the US at 17:00 (GMT+3:00).
The Analytical Overview Of The Main Currency Pairs
The EUR/USD currency pair
Technical indicators of the currency pair:
Prev Open: 1.12260
Open: 1.12942
% chg. over the last day: +0.61
Day's range: 1.12872 – 1.13091
52 wk range: 1.1111 – 1.2009
EUR/USD stabilized after rapid growth. Right now the trending instrument is consolidating. The local support and resistance levels are 1.12700-1.13100. USD remains under pressure due to the dowish Fed policy. The regulator is willing to lower the rates at the next few meetings. Review several releases from the EU and the US and open positions from the key levels.
The Economic News Feed for 21.06.2019:
Business Activity Report (EU) – 10:30 (GMT+3:00);
Secondary Real Estate Sales (EU) – 17:00 (GMT+3:00);
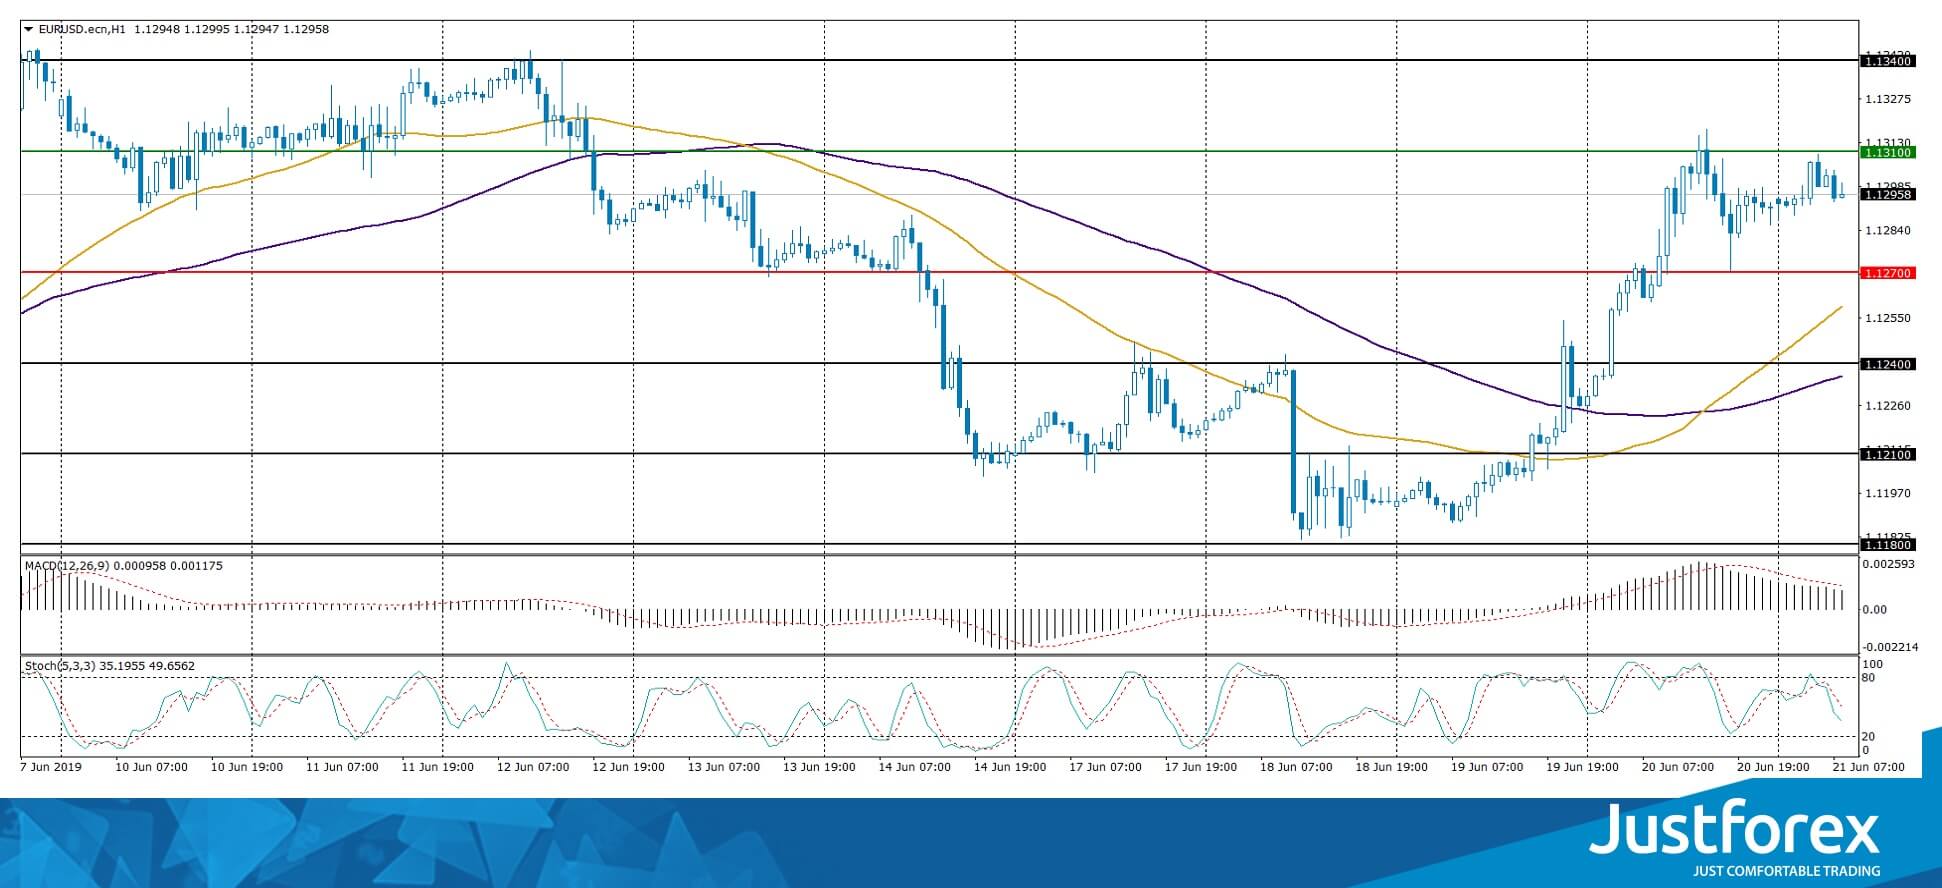
The price fixed above 50 MA and 100 MA which points to the power of the buyers.
The MACD histogram is in the positive zone but below a signal line which gives a weak signal to buy EUR/USD.
The Stochastic Oscillator is in the neutral zone, the %K line is below the %D line which points towards correctino of EUR/USD.
Trading recommendations
Support levels: 1.12700, 1.12400, 1.12100
Resistance levels: 1.13100, 1.13400
If the price fixes above 1.13100, expect further growth towards 1.13400-1.13600.
Alternatively, the quotes can fall towards 1.12500-1.12300.
The GBP/USD currency pair
Technical indicators of the currency pair:
Prev Open: 1.26408
Open: 1.27033
% chg. over the last day: +0.53
Day's range: 1.26903 – 1.27247
52 wk range: 1.2438 – 1.3631
GBP/USD is moving sideways. There is no defined trend. GBP is testing the key support and resistance levels are 1.26750-1.27250. The Bank of England kept the monetary policy at the same level. The regulator has worsened the economy growth forecasts for the country. The Central Bank is also worried about the high-stress environment in the world trade and the Brexit ambiguousness. Keep an eye on the US economic reports and open positions from the key levles.
The Economic News Feed for 21.06.2019 is calm.
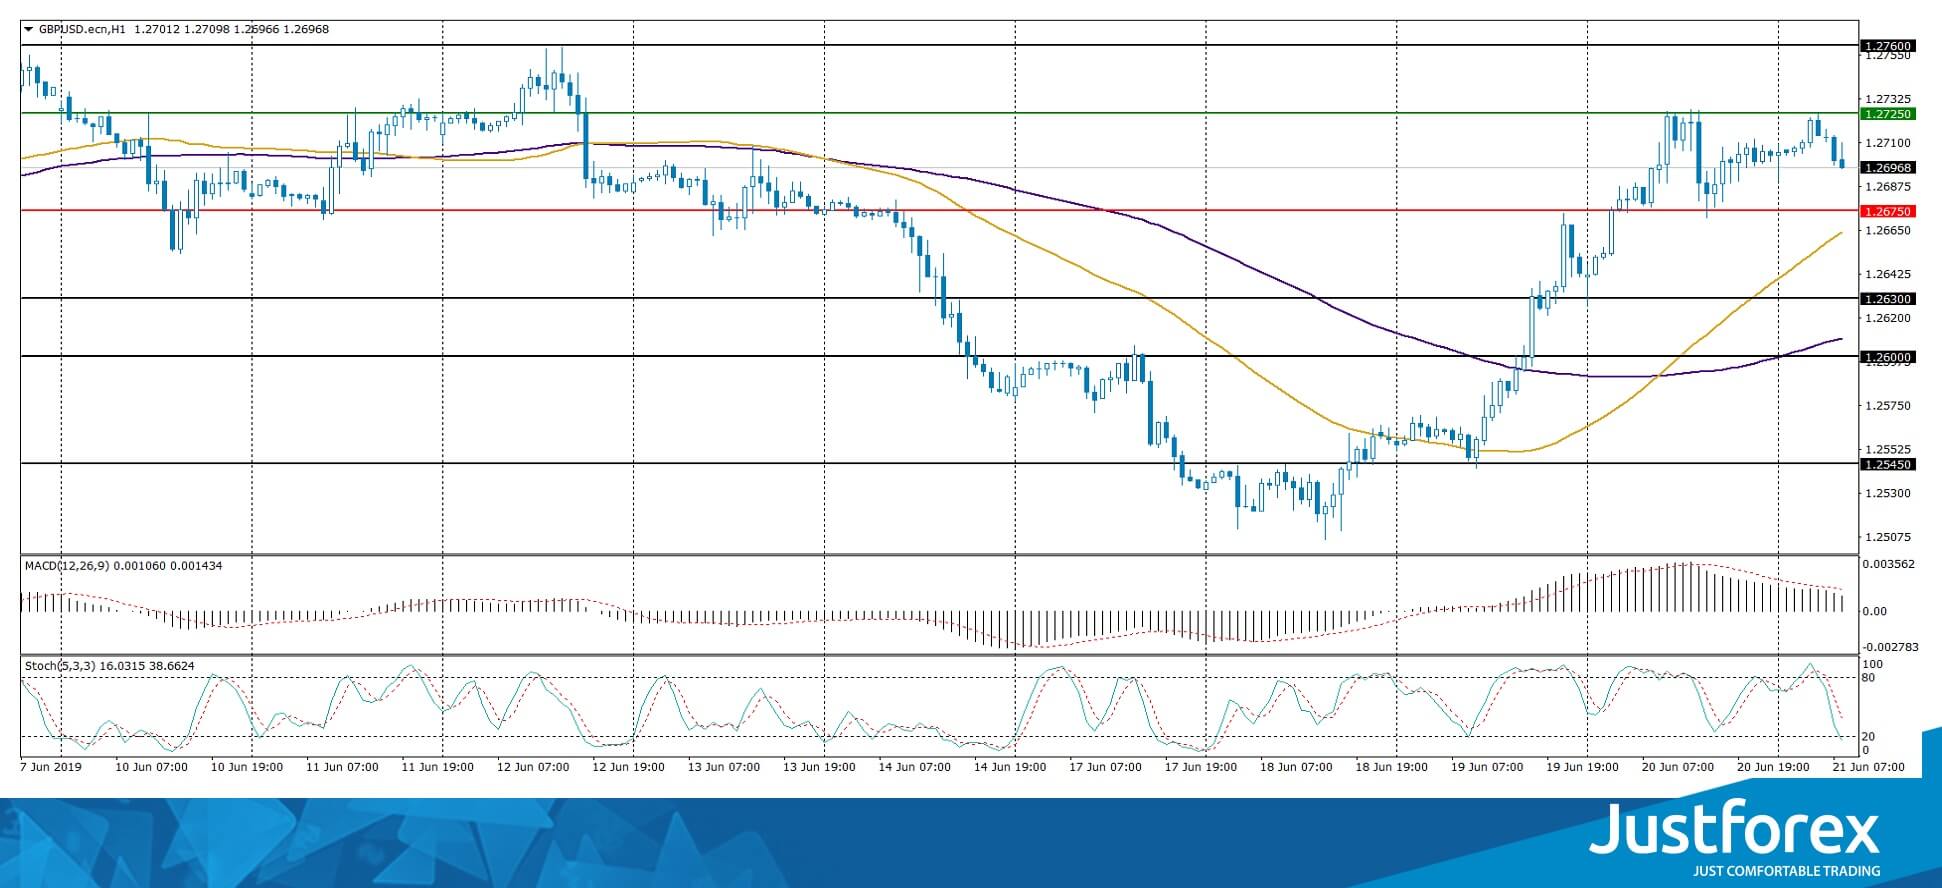
The price fixed above 50 MA and 200 MA which points to the power of the buyers.
The MACD histogram is in the positive zone but below the signal line which gives a weak signal to buy GBP/USD.
The Stochastic Oscillator is in the neutral zone, the %K line is below the %D line which points towards a correctino of GBP/USD.
Trading recommendations
Support levels: 1.26750, 1.26300, 1.26000
Resistance levels: 1.27250, 1.27600
If the price fixes above 1.27250, expect further growth towards 1.27600-1.27800.
Alternatively, the quotes can descend towards 1.26400-1.265200.
The USD/CAD currency pair
Technical indicators of the currency pair:
Prev Open: 1.32787
Open: 1.31897
% chg. over the last day: -0.72
Day's range: 1.31622 – 1.31960
52 wk range: 1.2727 – 1.3664
USD/CAD is consolidating after a rapid fall since the beginning of the week. The key support and resistance levels are 1.31600 and 1.32200. USD remains under pressure. A technical correction is possible soon. We expect important report from Canada. Keep an eye on the oil quotes dynamics and open positions from the key levels.
At 15:30 (GMT+3:00) Canada will publish a retail sales report.
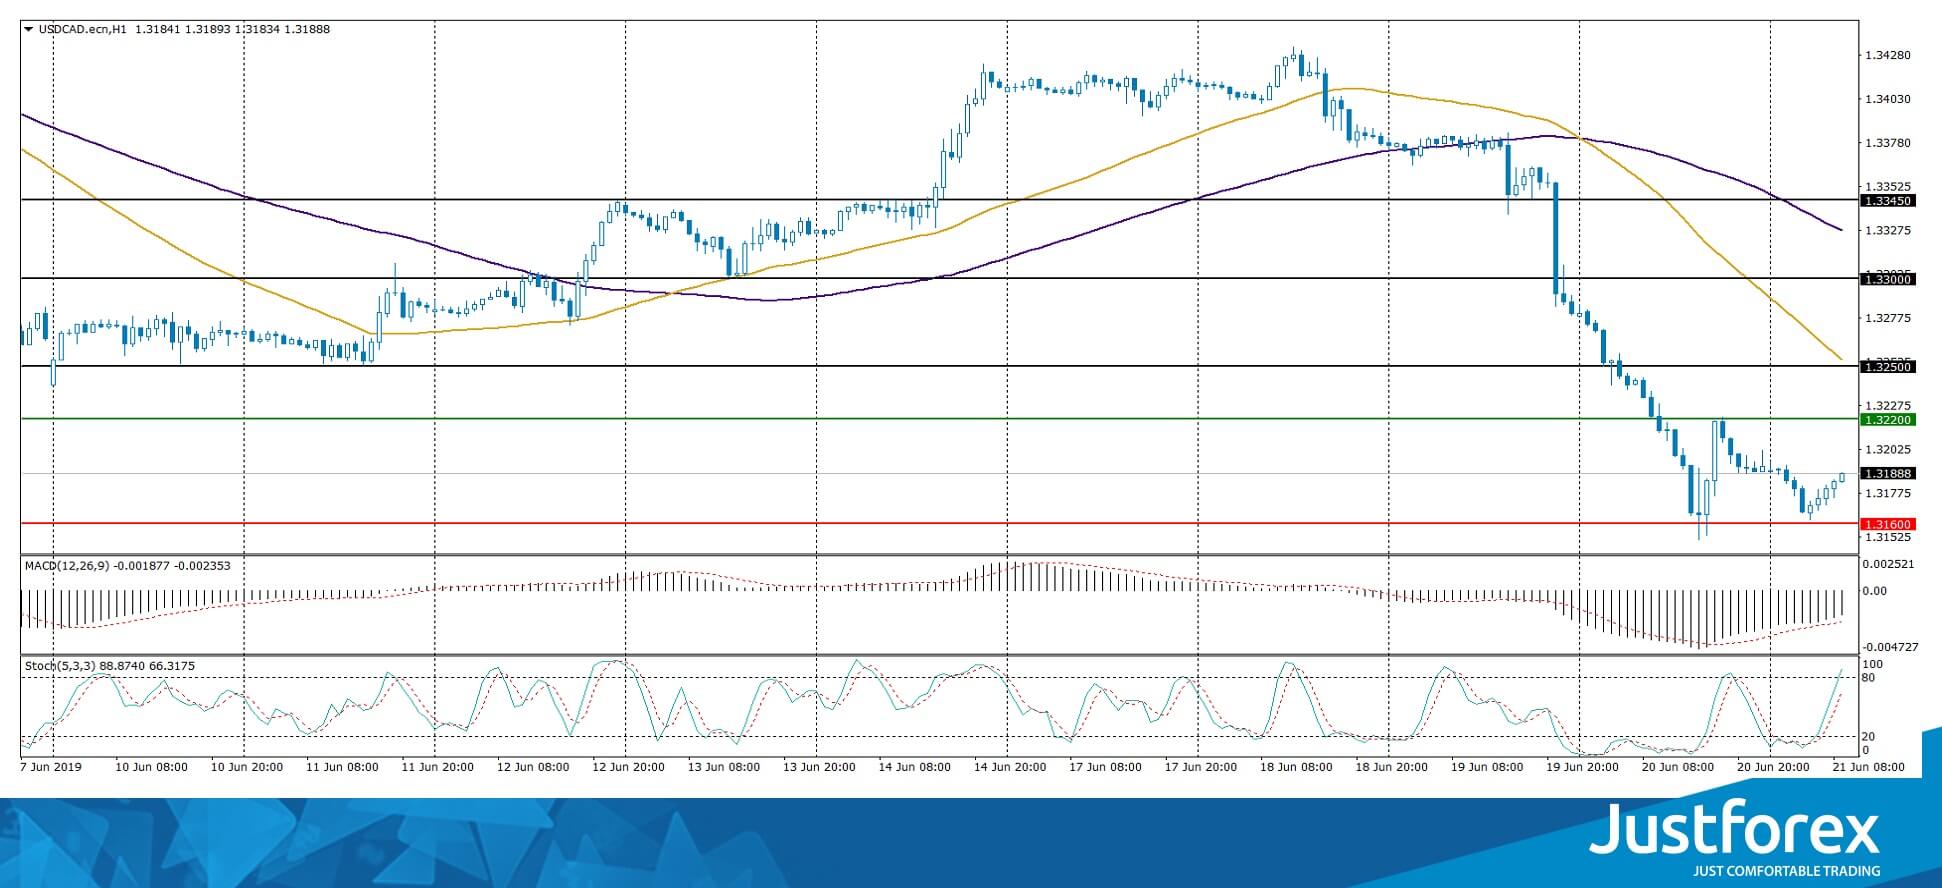
The price is fixed below 50 MA and 200 MA which points to the power of the buyers.
The MACD histogram is in the negative zone but above the signal line which gives a weak signal to sell USD/CAD.
The Stochastic Oscillator is in the neutral zone, the %K line is above the %D line which points towards a correction of USD/CAD.
Trading recommendations
Support levels: 1.31600, 1.31300, 1.31000
Resistance levels: 1.32200, 1.32500, 1.33000
If the price fixes below 1.31600 local support, expect further descend towards 1.31300-1.31000.
Alternatively, the quotes can correct towards 1.32500-1.32800.
The USD/JPY currency pair
Technical indicators of the currency pair:
Prev Open: 108.099
Open: 107.288
% chg. over the last day: -0.74
Day's range: 107.049 – 107.370
52 wk range:: 104.97 – 114.56
USD/JPY remains in a bearish mood. Right now the trading instrument is testing the key minimums. The local support and resistance levels are 107.000 and 107.400. The demand for USD remains low after the Federal Reserve meeting. The USD/JPY quotes have prospects for further descend. Keep an eye on the US Treasury bonds' yield and open positions from the key levels.
The Economic News Feed for 21.06.2019 is calm.
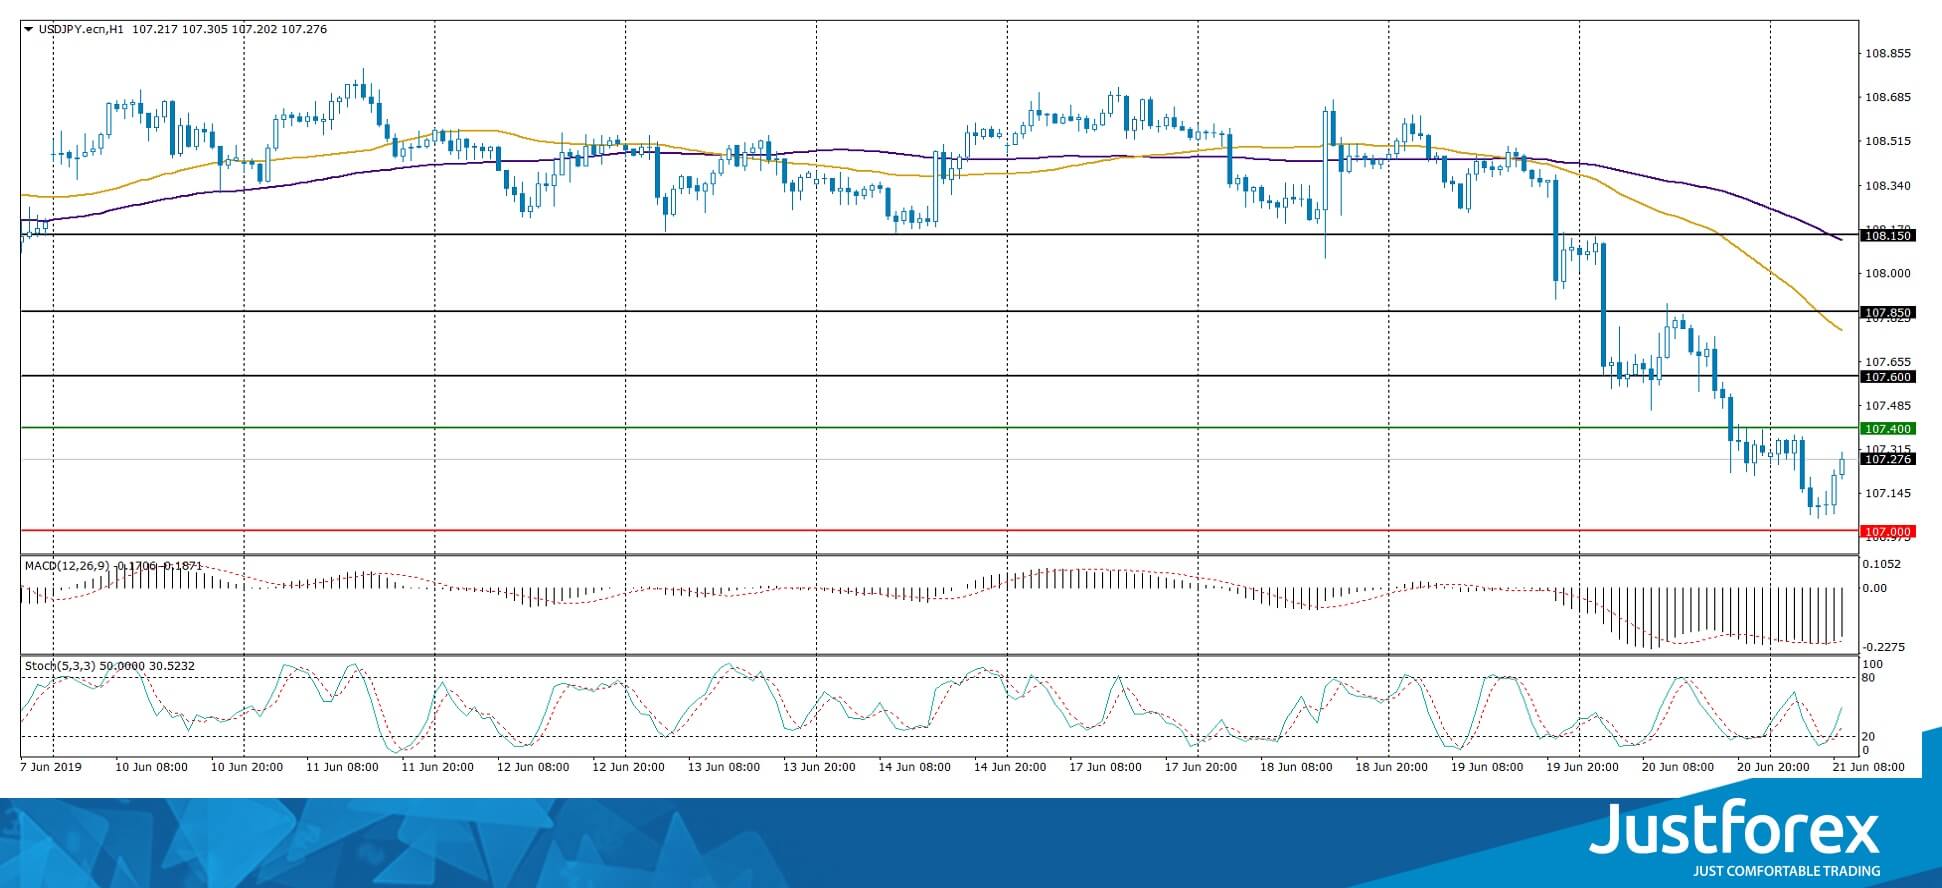
The price fixed below 50 MA and 100 MA which points to the power of the buyers.
The MACD histogram is in the negative zone but above the signal line which gives a weak signal to sell USD/JPY.
The Stochastic Oscillator is in the neutral zone, the %K line is above the %D line which points towards a recovery of USD/JPY.
Trading recommendations
Support levels: 107.000, 106.500
Resistance levels: 107.400, 107.600, 107.850
If the price fixes below 107.000, epxect further growth towards 106.600-106.400.
Alternatively, the quotes can grow towards 107.600-107.850.
EUR/JPY Likely To Aim For 200-Hour SMA
The common European currency maintained a descending channel pattern against the Japanese Yen on Thursday. The currency pair tested the upper boundary of the descending channel pattern at 121.87 during Thursday's trading session.
After hitting the upper border of the channel pattern, the exchange rate began to depreciate and at the end of yesterday's trading session, the pair lost about 77 base points.
By and large, it is likely that the EUR/JPY could aim for re-tests of the upper boundary of the descending channel pattern within this session. The potential upside target for bullish traders will be at the 200-hour SMA at 121.96 today.

AUD/USD Targets At 0.6901
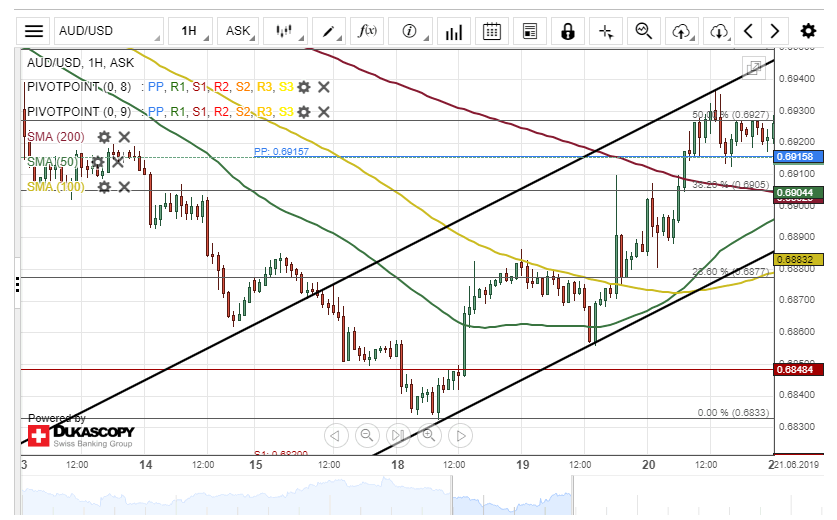
The Australian Dollar appreciated about 54 base points against the US Dollar on Thursday. The currency pair breached the 50.00% Fibonacci retracement level at the end of yesterday's trading session.
Everything being equal, it is likely that the AUD/USD currency pair could make a pullback towards a support cluster formed by the 50– and 200-hour SMAs at 0.6901 within this session.
If this support cluster holds, bulls are likely to push the currency exchange rate towards the 61.8% at 0.6955 Fibonacci retracement level during the following trading session.
USD/CAD Could Make U-Turn North
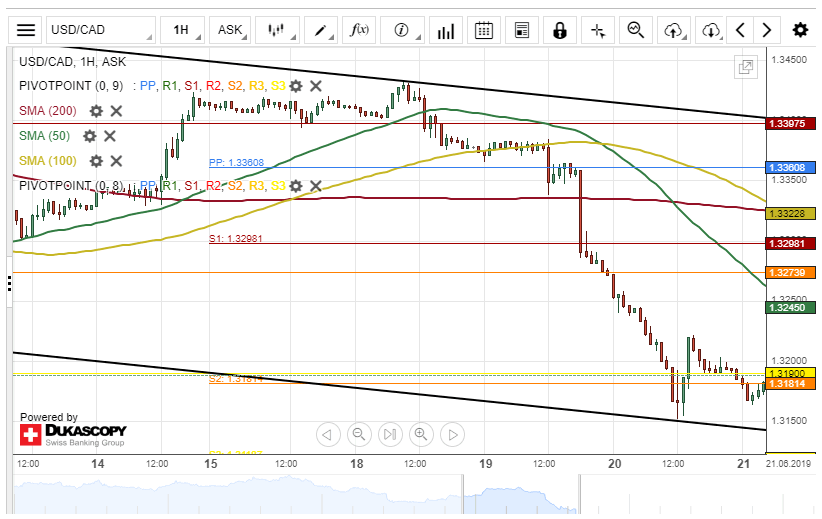
The US Dollar depreciated about 118 base points against the Canadian Dollar on Thursday. The currency pair was pressured down by the 50-hour simple moving average.
As for the near future, it is likely that bulls could regain some of its lost positions during the following trading session. The potential upside target will be near a resistance cluster formed by the 50-hour SMA and the monthly S1 at 1.3273.
If the resistance cluster holds, the currency exchange rate will continue its downward movement in the short term future.
NZD/USD Tests 50-Hour SMA
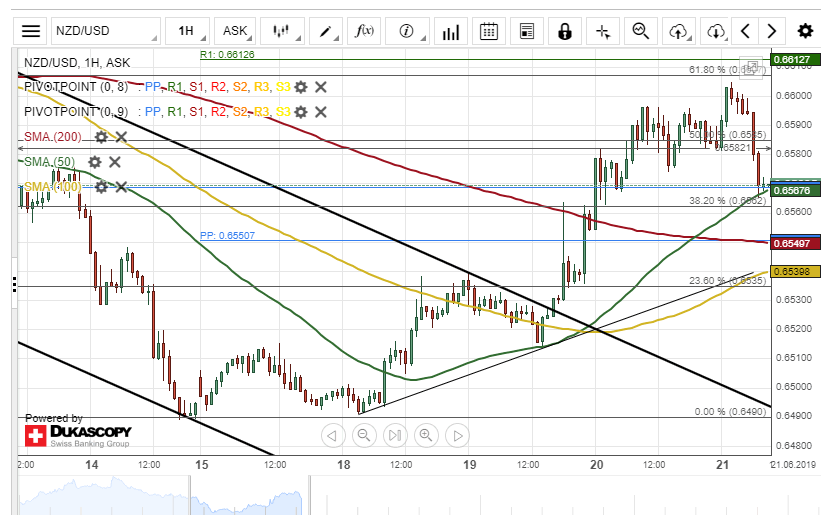
The New Zealand Dollar appreciated about 50 base points against the US Dollar on Thursday. The currency pair breached the 50.00% Fibonacci retracement level during yesterday's trading session.
The exchange rate is currently testing a resistance level formed by the 50-hour simple moving average at 0.6566.
If this resistance level holds, the currency exchange rate could aim for the 61.80% Fibonacci retracement level at 0.6607 within this session.
However, if the pair passes the 50-hour SMA, a decline towards the 23.6% Fibo could be the next target for bearish traders.
Forex Technical Analysis: EUR/USD, USD/JPY, GBP/USD
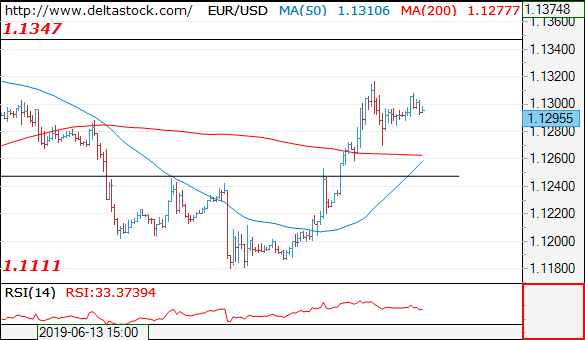
EUR/USD
Current level - 1.1295
The pattern below 1.1320 is corrective, preceding an attack of 1.1347 resistance. Intraday, the bias is negative, for a dip to 1.1260.
| Resistance | Support | ||
| intraday | intraweek | intraday | intraweek |
| 1.1320 | 1.1450 | 1.1250 | 1.1110 |
| 1.1350 | 1.1450 | 1.1180 | 1.1010 |
USD/JPY
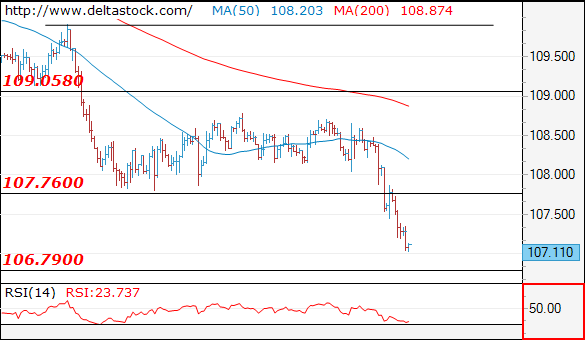
Current level - 107.11
The downtrend is intact heading towards 106.70 area. Initial resistance lies at 107.40.
| Resistance | Support | ||
| intraday | intraweek | intraday | intraweek |
| 107.40 | 109.90 | 106.70 | 106.70 |
| 108.70 | 112.40 | 106.70 | 104.50 |
GBP/USD
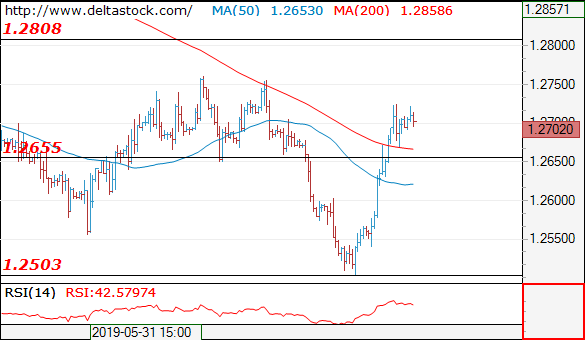
Current level - 1.2702
The structure below 1.2730 is corrective and after a brief second dip to 1.2660 a rise should follow, towards 1.2810.
| Resistance | Support | ||
| intraday | intraweek | intraday | intraweek |
| 1.2760 | 1.2890 | 1.2650 | 1.2503 |
| 1.2810 | 1.3170 | 1.2600 | 1.2420 |
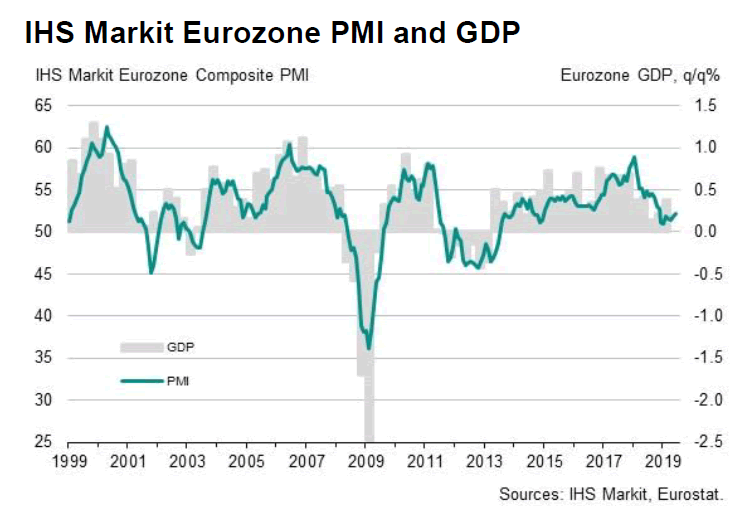
Eurozone PMIs: Overall growth remains subdued, pace restricted by uncertainty and risk aversion
Eurozone PMI Manufacturing rose to 47.8 in June, up from 47.7 but missed expectation of 48.0. It's also staying well below 50 level. PMI Services rose to 53.4, up from 52.9 and beat expectation of 53.0. It's the highest level in 7 months. PMI Composite rose to 52.1, up from 51.8, also the highest in 7 months.
Commenting on the flash PMI data, Chris Williamson, Chief Business Economist at IHS Markit said:
"The eurozone economy picked up further momentum in June, with the headline PMI rising from the lows seen earlier in the year to hint that the worst of the current slowdown may be behind us. However, the overall rate of expansion remains weak, with the survey data indicative of eurozone growth of just over 0.2% in the second quarter.
"However, growth trends between the core and the periphery have widened. Germany and France are both showing improved performances compared to earlier in the year as one-off factors (such as the political unrest in France) continue to drop out of the picture, but the data highlight a growing concern that the rest of the region is sliding closer towards stagnation.
"Growth also remains very much dependent on the service sector, which in turn largely reflects the relative strength of domestic consumer demand and improving labour markets. Manufacturing, in contrast, remains in a steep downturn which is only showing tentative signs of moderating.
"The overall rate of growth consequently remains subdued, and a further deterioration in business confidence about the year ahead suggests the pace of expansion will continue to be restrained by uncertainty and risk aversion. Concerns about weaker economic growth at home and in export markets, rising geopolitical risks and trade wars continue to dominate the picture and dampen business spending, investment and sentiment."
Dovish Fed Continues To Feed USD Bears
The USD weakened further yesterday as the Fed's dovishness on Wednesday continues to feed the bears around the USD. A further decline of the 10 year Treasury yield , near the 2% threshold, contributed to further USD weakness. Analysts tend to point out that the rally in gold's prices, may foreshadow a longer timeframe of selling pressure for the greenback. Also, analysts tend to mention that the upside for the USD is capped as the market is already looking beyond the July meeting. We expect market focus to switch towards the Osaka G20 meeting next week in order to see if the US and China can resolve their trading differences. Unless we see some favorable fundamental headlines for the USD we could see it weakening even further, however some early signs of stabilization started to occur. EUR/USD continued its rise yesterday, clearly breaking the 1.1260 (S1) resistance level (now turned to support) and testing the 1.1300 (R1) resistance line. As the pair broke the upward trendline incepted since Wednesday, we switch our bullish bias in favor of a sideways motion scenario. Should the bulls once again reign over the pair's direction, we could see it breaking the 1.1300 (R1) resistance line and aim for the 1.1340 (R2) resistance level. Should the bears be in charge, we could see EUR/USD breaking the 1.1260 (S1) support line and aim for lower grounds.
Pound weakens on BoE's interest rate decision
BoE's interest rate decision was released yesterday, and despite the bank remaining on hold as expected the pound weakened, as the outlook seems uncertain. Despite some hawkish comments in the near past by BoE members, the bank lowered its Q2 GDP estimate reaching 0.0% qoq. Also the bank seems to favor an ongoing tightening of the monetary policy at a gradual and limited pace. Yet the above scenario, assumes that a smooth Brexit will take place, which is highly uncertain. On the latest news regarding the UK political scene, the first phase for replacing Theresa May seems to be ending and now the members will have to choose between Boris Johnson and Jeremy Hunt for its next leader. We expect the pound to remain under pressure in the near term as uncertainty remains high. Cable maintained a sideways motion yesterday above the 1.2665 (S1) support line. As the pair broke the upward trendline incepted since the 18th of the month, we switch our bullish bias, in favor of a sideways scenario. Should the pair be under the selling interest of the market, we could see it breaking the 1.2665 (S1) support line and aim for the 1.2560 (S2) support barrier. Should the pair's long positions be favored by the market, we could see it breaking the 1.2775 (R1) resistance line.
Other economic highlights, today and early tomorrow
Today during the European session, we get Eurozone's preliminary PMI figures for June. In the American session we get Canada's retail sales growth rates for April, the US preliminary Markit Mfg PMI for June and the Baker Hughes oil rig count figure. As for speakers, BoE's Tenreyro, Fed's Mester and Daly are scheduled to speak. During Monday's Asian session RBA governor Lowe speaks.
EUR/USD H4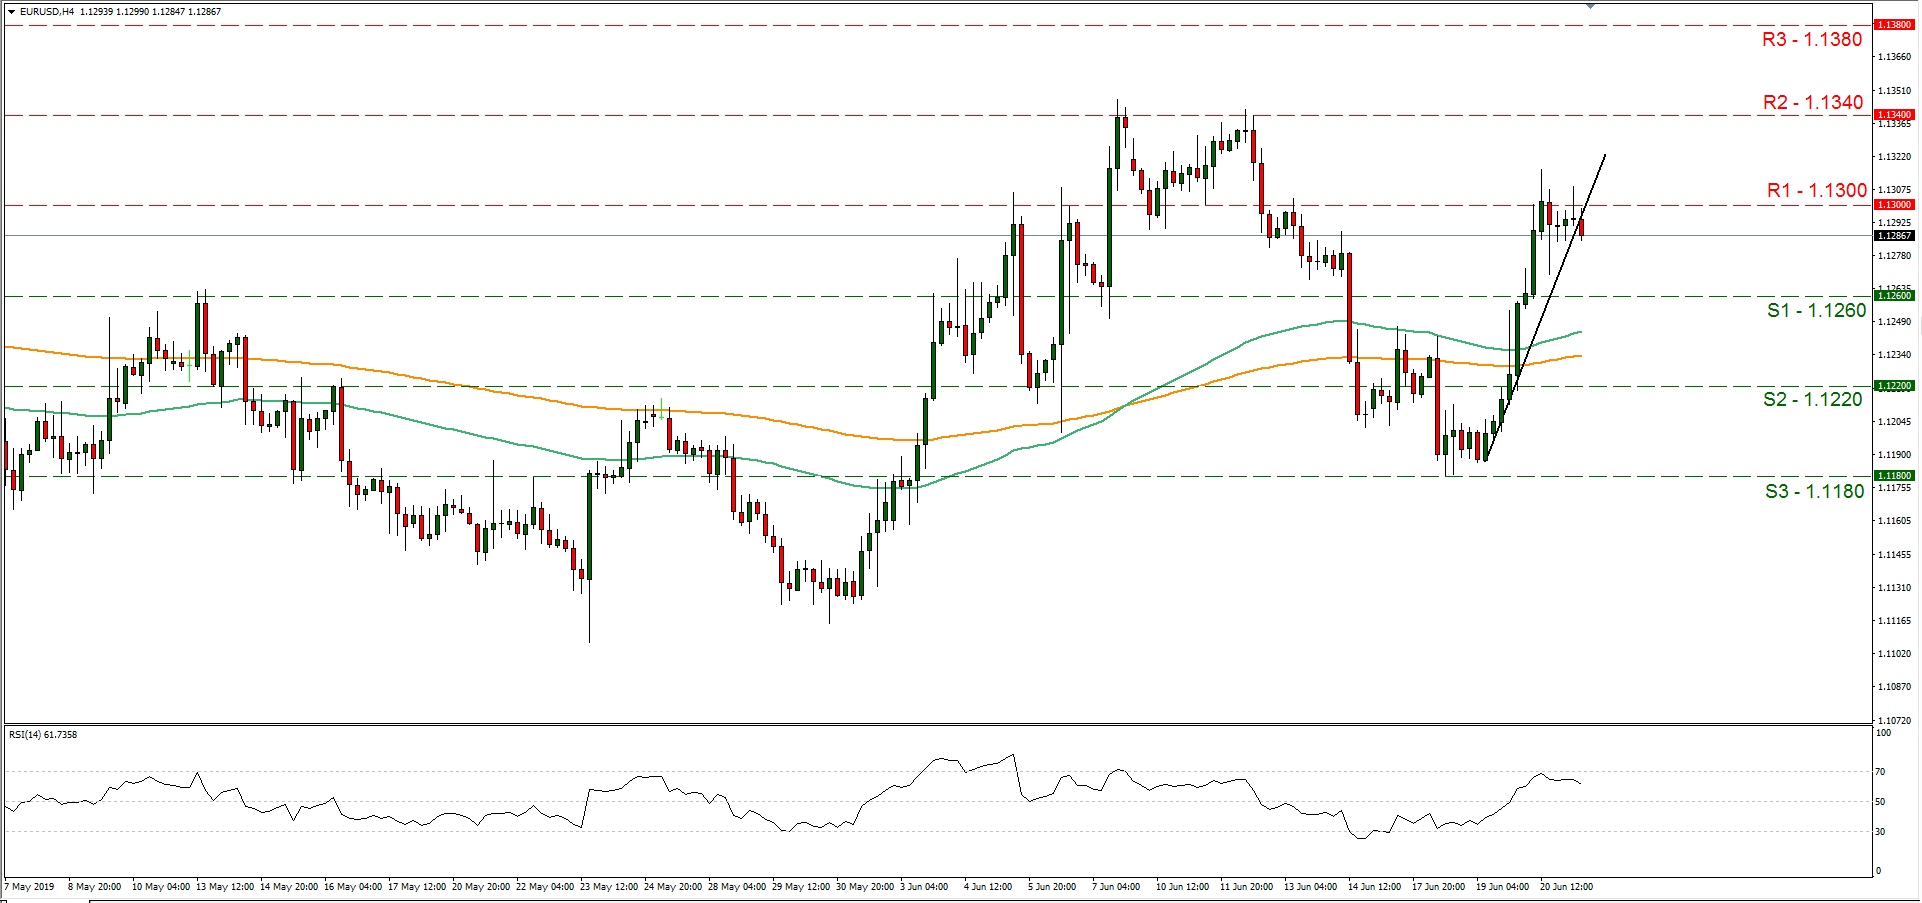
Support: 1.1260 (S1), 1.1220 (S2), 1.1180 (S3)
Resistance: 1.1300 (R1), 1.1340 (R2), 1.1380 (R3)
GBP/USD H4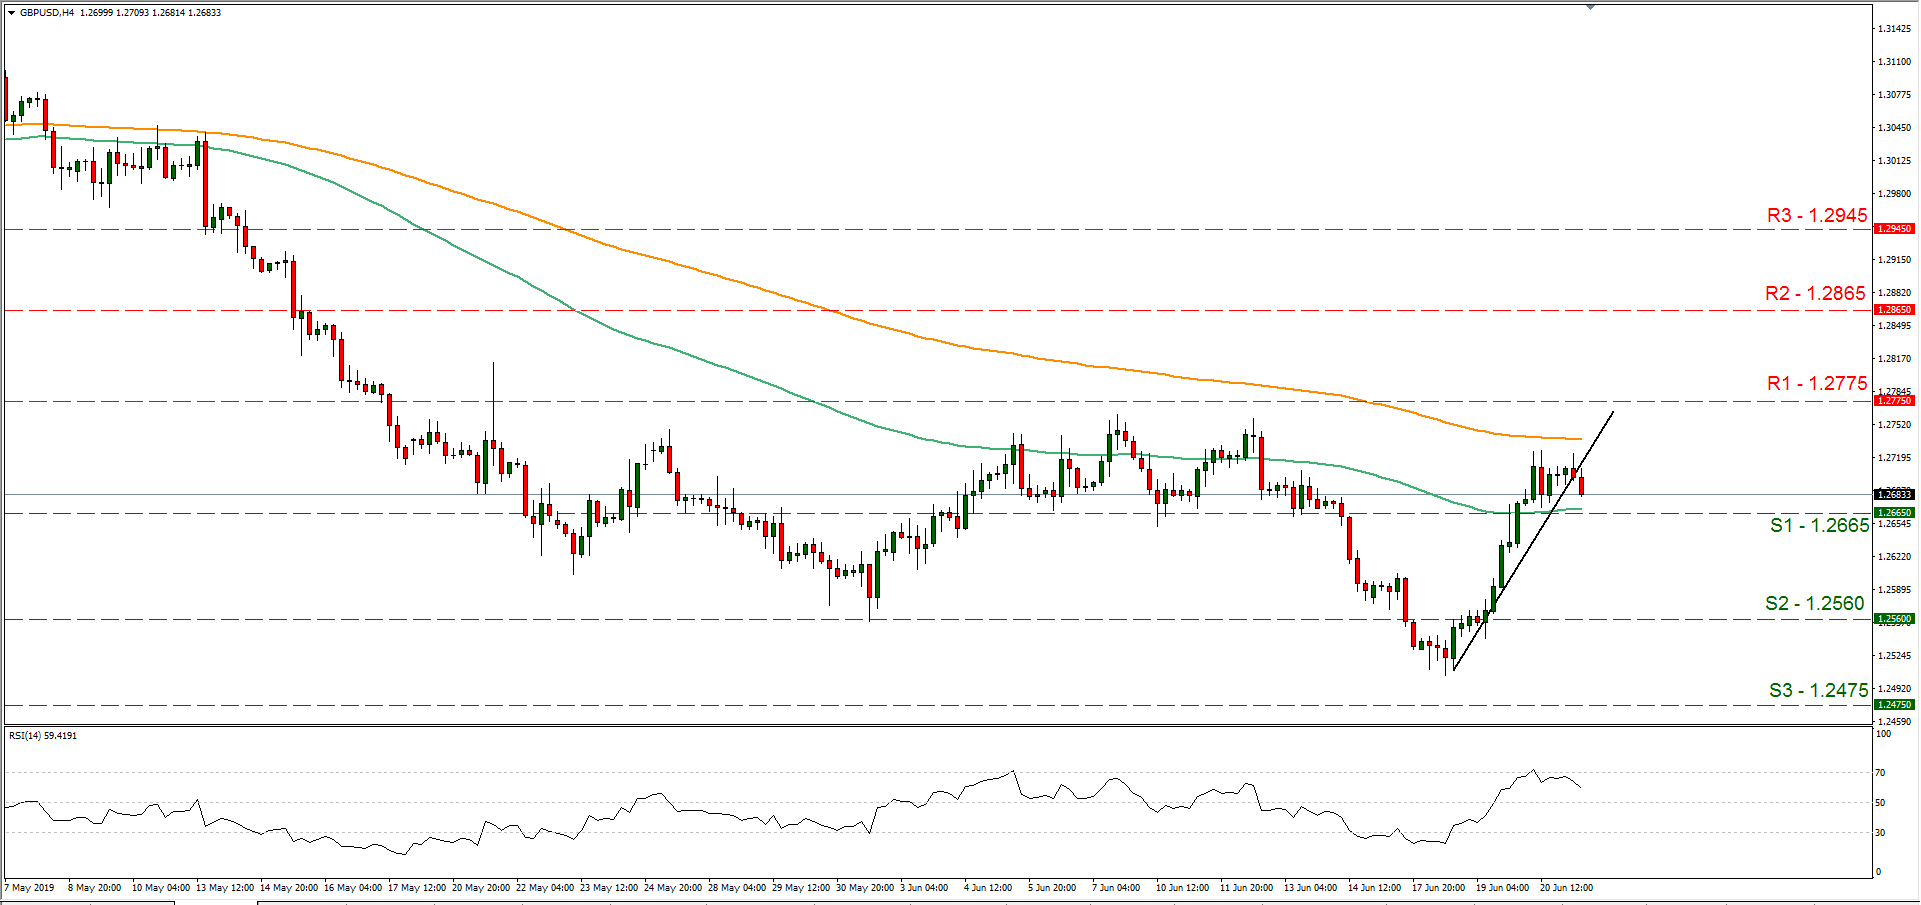
Support: 1.2665 (S1), 1.2560 (S2), 1.2475 (S3)
Resistance: 1.2775 (R1), 1.2865 (R2), 1.2945 (R3)
EUR/USD Outlook: Bullish Outlook Above Daily Cloud
The Euro probed again above 1.1300 barrier, boosted by better than expected French / German PMI data which showed that EU business growth picked up in June.
The single currency remains firm despite signals from the ECB about further policy easing if inflation fails to rise.
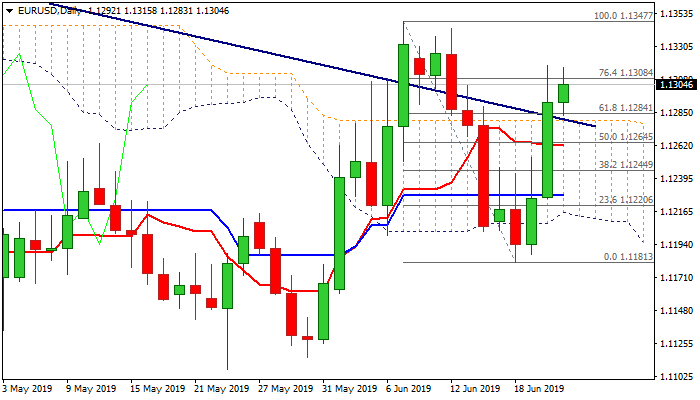
Thursday's long bullish candle (the Euro was up 0.6% for the day) underpins near-term action, along with strong bullish signals generated on daily close above pivotal barriers at 1.1279/84 (daily cloud top / bear-trendline / Fibo 61.8% of 1.1347/1.1181).
Technical studies show daily MA's in full bullish setup, but weaker momentum and flat RSI partially offset positive signals.
The pair may hold in extended consolidation above daily cloud which would keep bulls intact for fresh upside attempts.
Sustained break above 1.1300/08 (psychological barrier / Fibo 76.4%) is needed to open way for attack at key barriers at 1.1347/51 (200WMA / 7 June high / 200SMA).
Conversely, return and close below daily cloud top would soften near-term tone and risk deeper pullback that would also generate an initial signal of recovery stall.
Res: 1.1317, 1.1347, 1.1351, 1.1377
Sup: 1.1284, 1.1279, 1.1262, 1.1237