Sample Category Title
USDCHF Falls The Most In Three Years, Looks Oversold
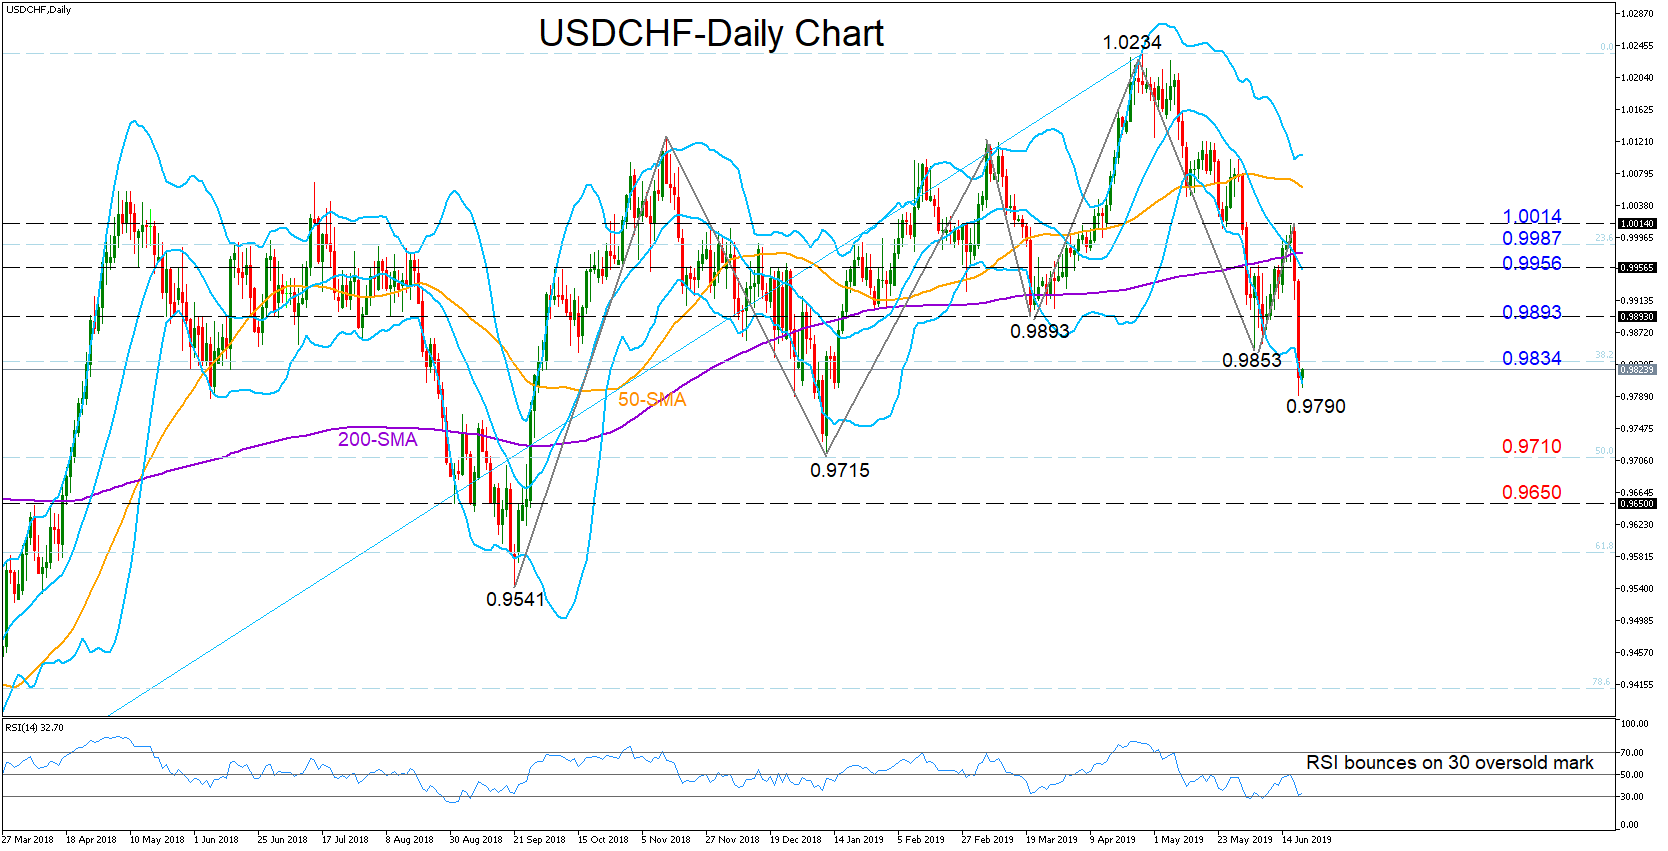
USDCHF experienced its worst daily trading in more than three years on Thursday, posting a sharp dip towards a 6 ½ -month low of 0.9790. The price is currently hovering around the lower Bollinger band, while the RSI is set to shift higher after hitting its 30 oversold mark, a warning that the bearish action may not continue in the short-term.
Yet with the market action taking place well below moving averages, the pair may need extra time to correct the recent downtrend that started from the 1.0234 top.
A failure to return above the previous low of 0.9853 would put more faith to the bearish wave triggered from the 1.0234 top, shifting focus initially to Thursday’s trough of 0.9790 and then towards 0.9710 which is the 50% Fibonacci of the 2-year old downtrend from 0.9186 to 1.0234. Breaking the latter, the next key support to watch could be the 0.9650 number.
Closing comfortably above the March 20 low of 0.9893 would revive the 2-year old upward pattern , with resistance moving near the middle Bollinger band at 0.9956. Slightly higher, the 23.6% Fibonacci of 0.9987 could also halt upside corrections ahead of the 1.0014 level.
The medium-term picture turned slightly bearish after the fall below 0.9853.
In brief, USDCHF continues to hold a negative status both in the short and the medium-term.
USD/JPY Daily Outlook
Daily Pivots: (S1) 106.97; (P) 107.55; (R1) 107.90; More...
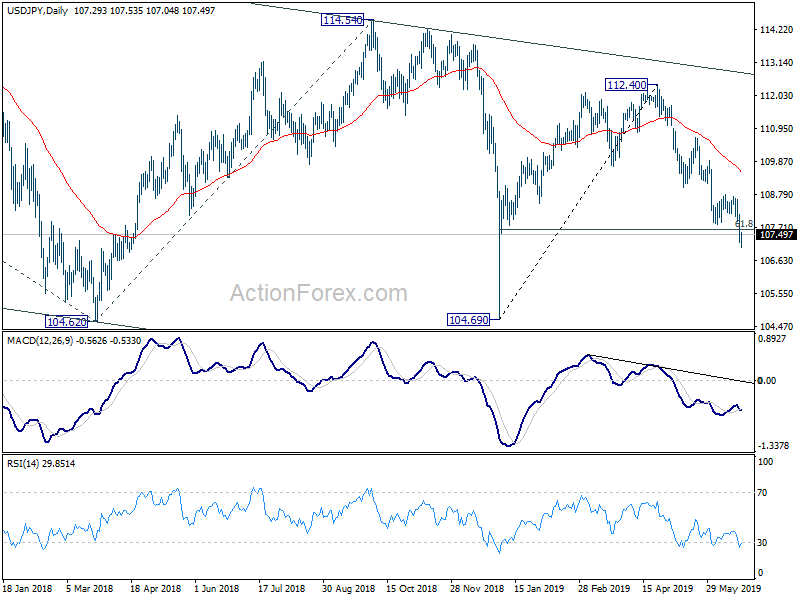
Intraday bias in USD/JPY remains on the downside as fall from 112.40 is in progress. Sustained trading below 61.8% retracement of 104.69 to 112.40 at 107.63 will pave the way back to 104.62/9 key support. On the upside, break of 108.80 resistance is needed to indicate short term bottoming. Otherwise, outlook will remain bearish in case of recovery.
In the bigger picture, decline from 118.65 (Dec 2016) is still in progress, with the pair staying inside long term falling channel. Break of 104.62 will target 100% projection of 118.65 to 104.62 from 114.54 at 100.51. For now, we'd expect strong support above 98.97 (2016 low) to contain downside to bring rebound.
AUD/USD Daily Outlook
Daily Pivots: (S1) 0.6890; (P) 0.6913; (R1) 0.6947; More...
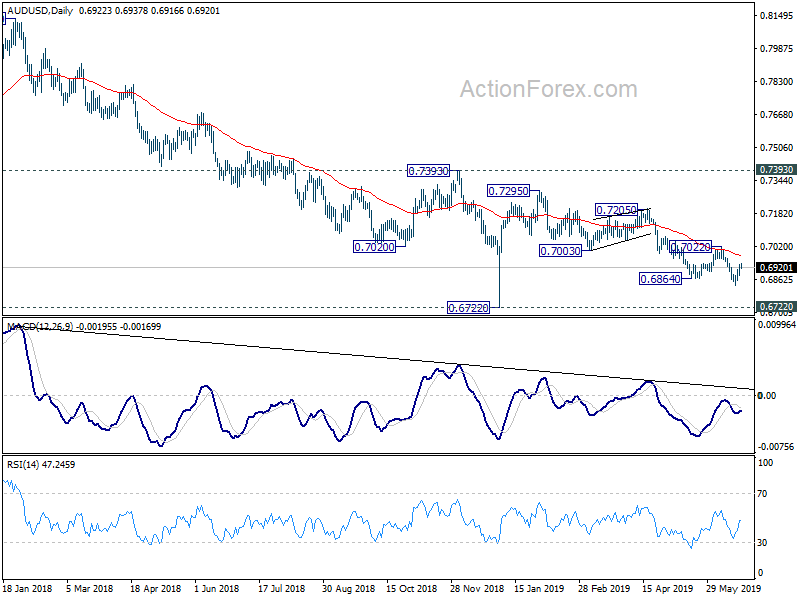
Outlook in AUD/USD remains unchanged at this point. While further recovery cannot be ruled out, upside should be limited below 0.7022 resistance to bring fall resumption. On the downside, below 0.6831 will extend the decline from 0.7295 to retest 0.6722 low. Nevertheless, firm break of 0.7022 will indicate near term bullish reversal and turn outlook bullish for 0.7205 resistance next.
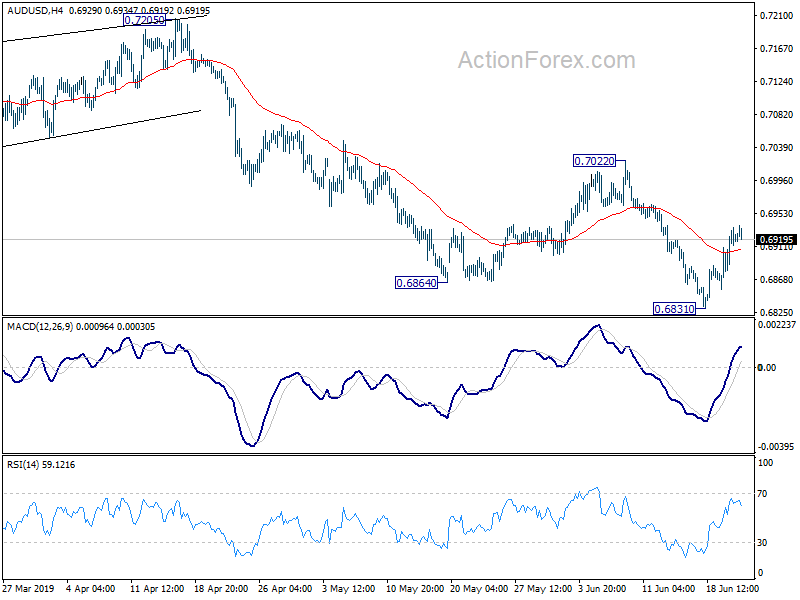
In the bigger picture, with 0.7393 key resistance intact, medium term outlook remains bearish. The decline from 0.8135 (2018 high) is seen as resuming long term down trend from 1.1079 (2011 high). Decisive break of 0.6826 (2016 low) will confirm this bearish view and resume the down trend to 0.6008 (2008 low). However, firm break of 0.7393 will argue that fall from 0.8135 has completed. And corrective pattern from 0.6826 has started the third leg, targeting 0.8135 again.
USD/CAD Daily Outlook
Daily Pivots: (S1) 1.3133; (P) 1.3211; (R1) 1.3271; More...
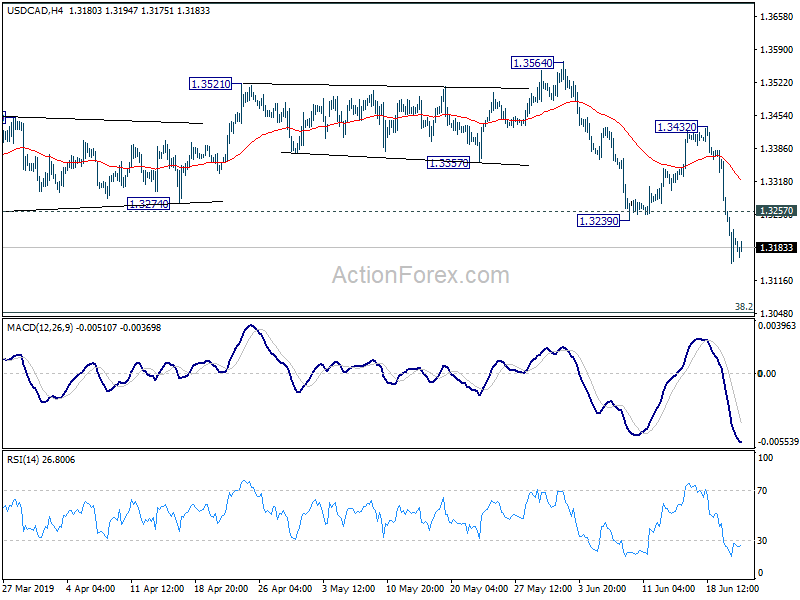
Intraday bias in USD/CAD remains on the downside for the moment. Current fall from 1.3564 is in progress for 1.3052/68 cluster support next. On the upside, above 1.3257 minor resistance will turn intraday bias neutral for consolidations. But risk will remain on the downside as long as 1.3432 resistance holds, in case of strong recovery.
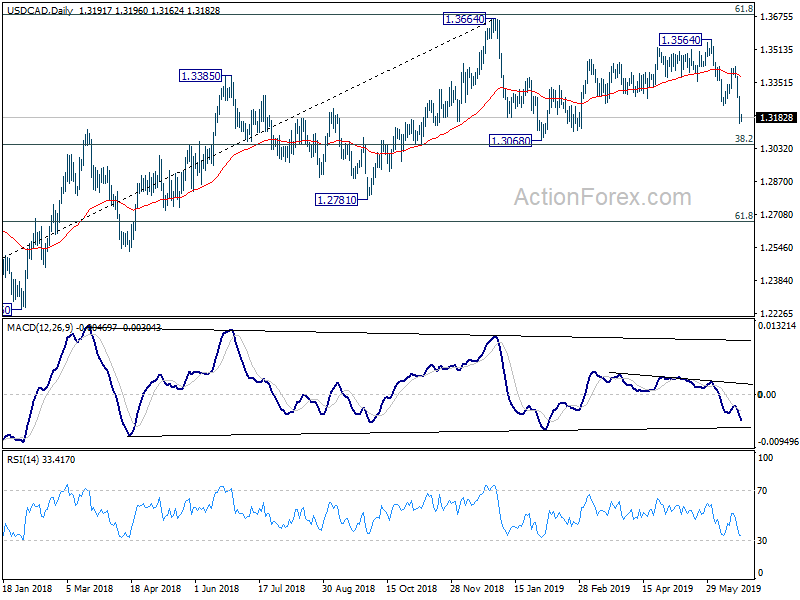
In the bigger picture, medium term outlook stays neutral for now even though the case of bearish reversal is building up. Decisive break of 1.3068 cluster support (38.2% retracement of 1.2061 to 1.3664 at 1.3052) will confirm completion of up trend from 1.2061 (2017 low). Further fall should be seen to 61.8% retracement at 1.2673 next. On the upside, sustained break of 61.8% retracement of 1.4689 (2016 high) to 1.2061 at 1.3685, is needed to confirm resumption of up trend from 1.2061 (2017 low). Otherwise, risk will stay on the downside.
GBP/JPY Daily Outlook
Daily Pivots: (S1) 135.96; (P) 136.57; (R1) 136.93; More...
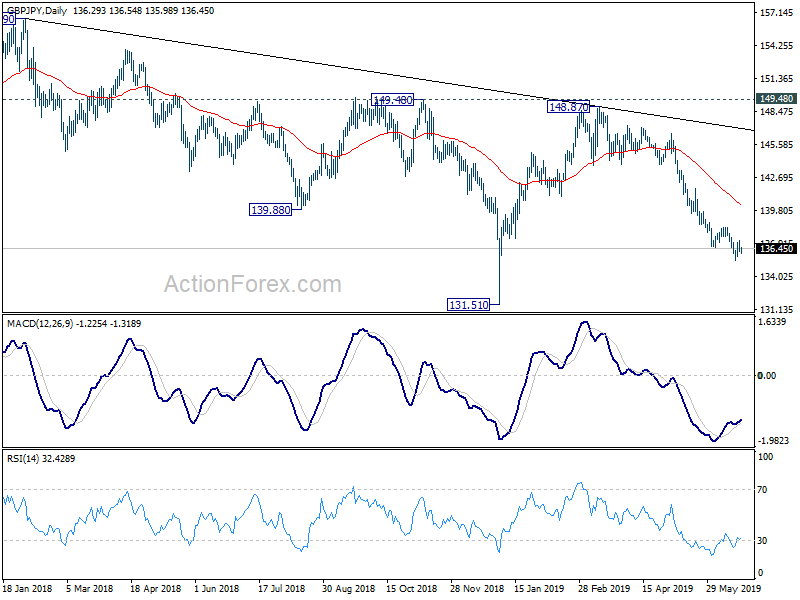
Intraday bias in GBP/JPY remains neutral as consolidation from 135.38 is extending. In case of stronger recovery, upside should be limited by 138.32 resistance to bring fall resumption. On the downside, break of 135.38 will extend recent fall from 148.87 to retest 131.51 low. Though, firm break of 135.38 will confirm short term bottoming and bring stronger rebound first.
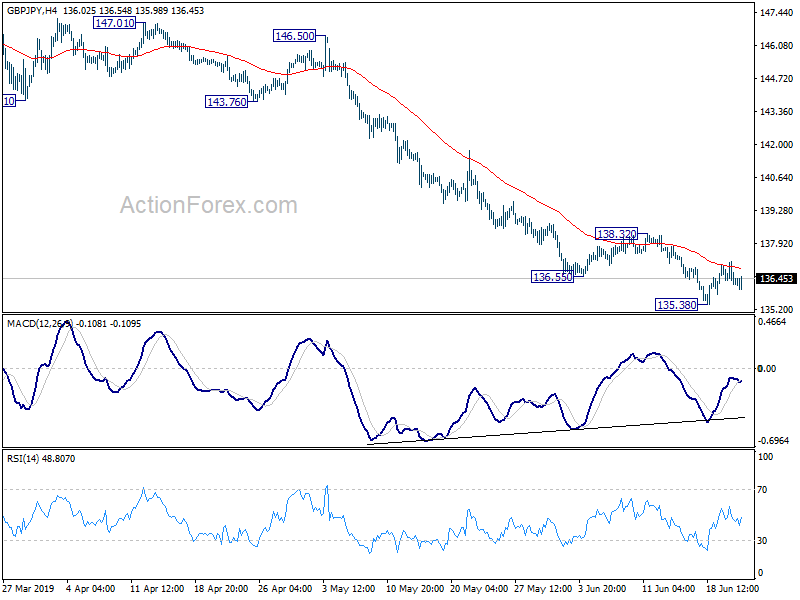
In the bigger picture, current development suggests that GBP/JPY's medium term fall from 156.59 (2018 high) is still in progress. Break of 131.51 will target 122.36 (2016 low). Structure of such decline is corrective looking so far, arguing that it's just the second leg of consolidation from 122.36. Thus, we'd expect strong support from 122.36 to contain downside to bring reversal.
Gold Maintains The Upside Momentum
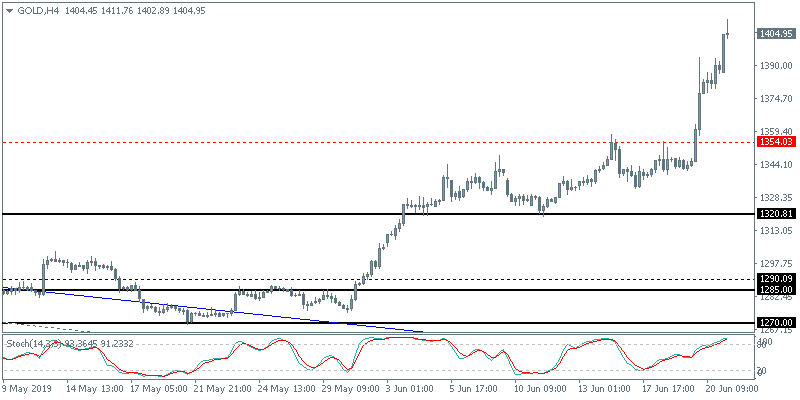
The precious metal continued to surge higher on the day as price tested $1400 an oz earlier this morning. The gains come as central banks shift to dovish forward guidance across the globe. Meanwhile, rising tensions between Washington and Tehran also add to the global concerns of a potential fallout into a war.
XAUUSD Could Consolidate Near Highs
Following a week of strong gains, gold could pause its gains in the short term. After this morning’s spike to 1400.00, which is a key psychological level, gold prices could see a pullback. In the short term, support could be seen at 1390.25. However, for this pullback to occur, the precious metal will need to signal a bearish reversal pattern near the current highs.
Sterling Muted to BoE
Following weeks of voting, Boris Johnson is set to become the next Prime minister of the United Kingdom. Having won the UK conservative party leadership vote, Johnson is set to replace PM May who resigned after failing to deliver a Brexit deal. Elsewhere, the BoE held its monetary policy meeting but left the interest rates unchanged. The sterling was unmoved on the outcome of the meeting.
GBPUSD Could Continue Higher
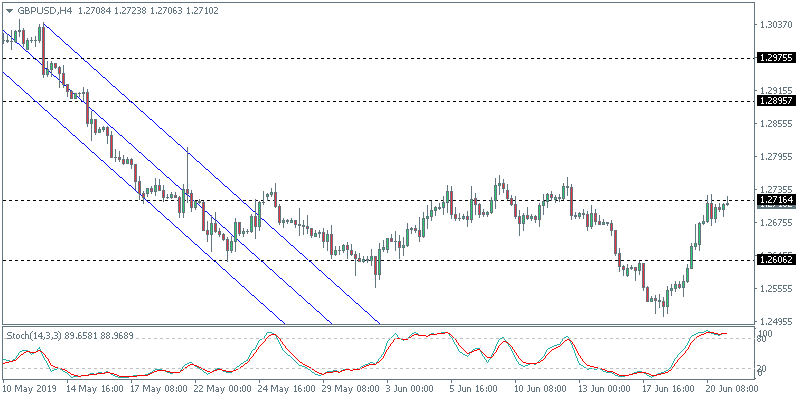
The GBPUSD currency pair continued to maintain its gains over the week. Price is testing the resistance level of 1.2716 at the time of writing. A breakout above this level is required to keep the momentum going. The upside bias comes on the bullish divergence seen on the daily chart. A close above 1.2716 could confirm this view as GBPUSD will be targeting 1.2895 next.
EUR/JPY Daily Outlook
Daily Pivots: (S1) 120.85; (P) 121.39; (R1) 121.69; More....
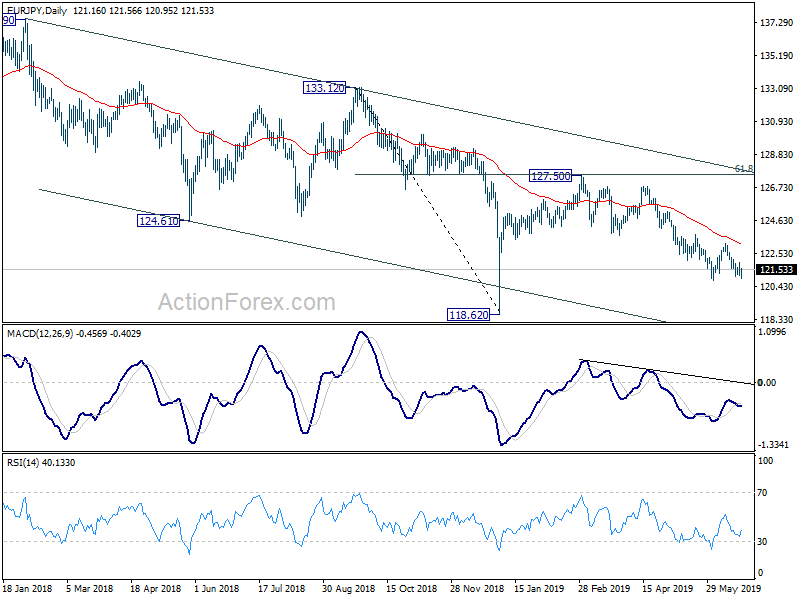
EUR/JPY continues to lose downside momentum as seen in 4 hour MACD. But further decline is expected with 121.92 minor resistance intact. Firm break of 120.78 will resume the larger decline from 127.50 will target 118.62 low next. On the upside, above 122.17 minor resistance delay the bearish case, turn intraday bias to the upside to extend the consolidation from 120.78.
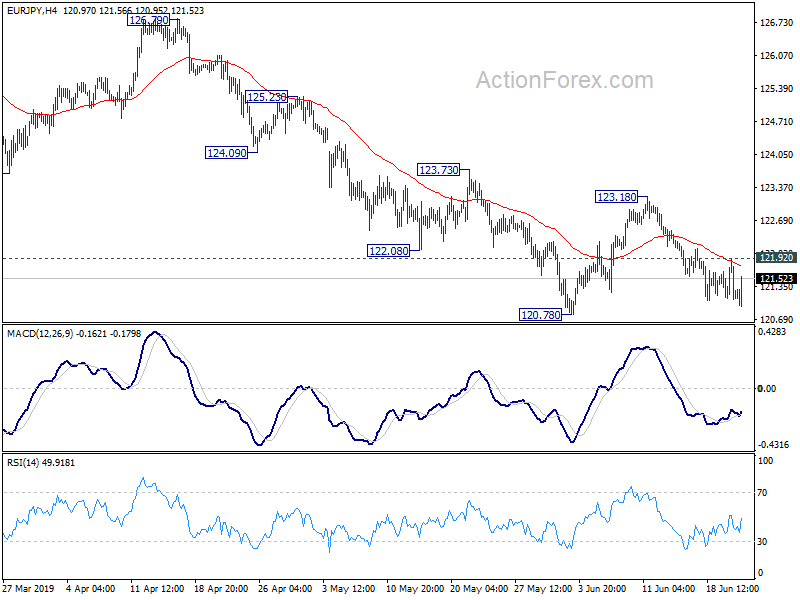
In the bigger picture, down trend from 137.49 is still in progress with the cross staying inside long term falling channel. Break of 118.62 will extend the fall to 109.48 (2016 low). On the upside, break of 127.50 resistance is needed to be the first sign of medium term reversal. Otherwise, outlook will remain bearish in case of strong rebound.
Euro Gains On A Weak USD
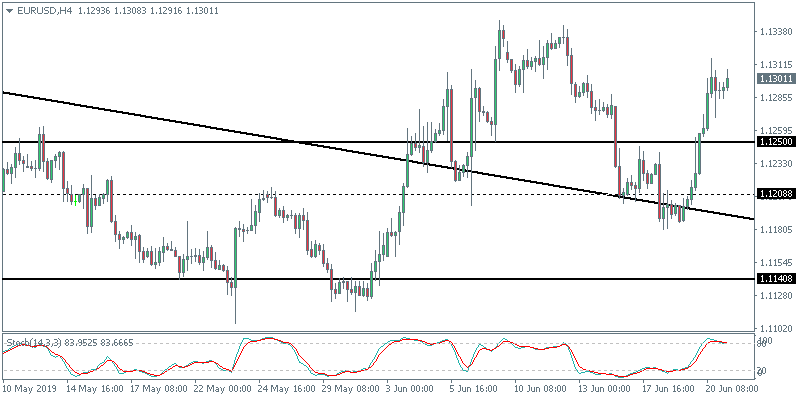
As the US dollar weakened following the FOMC meeting, the common currency posted strong gains on the day. Economic data from the eurozone was sparse. The reversal in the EURUSD came after both the ECB and the Fed came out with dovish forward guidance. Flash manufacturing PMI reports from the eurozoneare due later today.
EURUSD Likely to Consolidate Near Current Highs
The single currency managed to reverse the losses from earlier this week. Price posted strong gains as it broke past the 1.1250 level. At the time of writing, the EURUSD is trading near the 1.1300 handle. We expect price action to remain anchored around this level in the near term. The 4-hour chart signals a hidden bearish divergence which could see price dipping to 1.1250 to establish support.
GBPUSD Overdue For A Correction
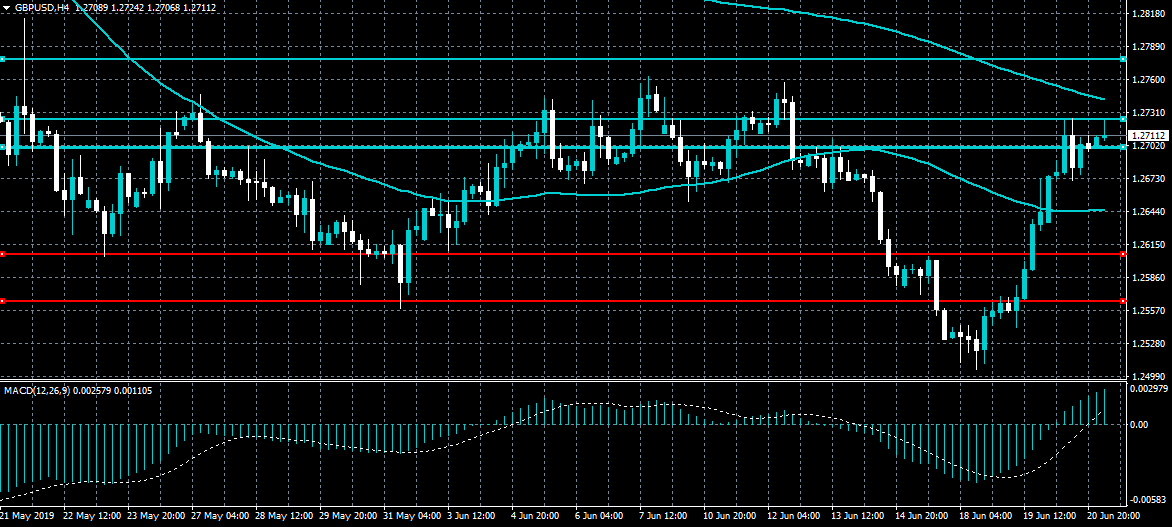
The British pound is starting to appear overstretched around the 1.2700 level against the US dollar as a number of key downside risks for sterling still remain place. A deeper bearish correction may see the GBPUSD pair test back towards the 1.2600 level. GBPUSD bulls need to maintain price above the 1.2730 resistance level to inspire further buying towards the 1.2770 level.
The GBPUSD pair is only bullish while trading above the 1.2700 level, key resistance is found at the 1.2730 and 1.2755 levels.
If the GBPUSD pair trades below the 1.2700 level, key support is found at the 1.2645 and 1.2600 levels.