Sample Category Title
Market Morning Briefing: Dollar-Yen Is Down To Test Support At 107
STOCKS
The increasing tensions between the US and Iran after the US drone was shot down by Iran yesterday seems to have not impacted the equities much as of now. But the developments on the US-Iran conflict will need a close watch which might disrupt the ongoing rally in the equity segment. The US equities have surged overnight and continue to remain bullish for further rise. Asians, though trading mixed remains positive from a broader picture. Shanghai has broken its sideways range on the upside as expected and is bullish for further rise. Sensex and Nifty can consolidate sideways for some time.
Dow (26753.17, +249.17, +0.94%) has surged breaking above 26600. The bullish outlook is intact and the index can extend its upmove to our preferred targets of 27200 and 27500.
DAX (12355.39, +46.86, +0.38%) tested 12430 as expected yesterday and has come-off from there. Immediate support is in the 12300-12285 region which can limit the downside in the near term. While above this support zone, the bullish outlook will remain intact to test 12600 and 12800 in the coming weeks.
Nikkei (21429.06, -33.8, -0.16%) has dipped slightly. But the broader bullish view remains intact to test 21750 on the upside. The support at 21250 can limit the downside in case of any intermediate dips.
As expected, Shanghai (3002.48, +15.36, +0.51%) has broken the sideways range above 2950 and has risen to 3000. Immediate resistance is at 3020 which can hold and trigger a corrective fall. But the resistance-turned-support level of 2950 will limit the downside and keep the outlook bullish to target 3050 and 3100 over the medium term.
Sensex (39601.63, +488.89, +1.25%) and Nifty (11831.75, +140.30, +1.20%) have surged yesterday breaking above 39500 and 11800 respectively. Sensex can test 39750 and Nifty can test 11900 which may cap their upside in the near term. The indices can remain range-bound between 38500-39750 (Sensex), 11600-11900 (Nifty) for some time.
COMMODITIES
Commodities are trading strong and have gained momentum. Gold and Silver have risen sharply and are closer to a key resistance. A corrective is possible in the near term. Copper has turned bullish and can rise further. Oil has risen breaking above their key near-term resistance which we had expected to hold. The escalating tensions between the US and Iran has triggered this price rise. A double-bottom in the oil charts indicate further upside is possible in the coming days.
Gold (1397) has surged towards 1400 as expected. A key resistance is near 1405 which may halt the current rally and a corrective fall to 1375 is possible in the coming days.
Silver (15.49) has room to test 15.65-15.70 on the upside. A corrective fall to 15.5-15.4 is possible from there before the upmove resumes targeting 16.0-16.10 on the upside.
Copper (2.72) has bounced again as expected. The outlook is now bullish for a test of 2.75 and 2.77. Our earlier bearish view for a fall below 2.60 to 2.58-2.55 has got negated.
Contrary to our expectation for a fall, Brent (64.74) and has risen breaking above 64. A corrective rally is in place now as against our expectation for a sideways consolidation. While above 64, Brent can now test 66 in the near term and even 67-68 thereafter.
Similarly, WTI (57.38) has surged breaking above 55, which we had expected to hold. While above 55, the current corrective rally can extend up to 58.5-59 in the coming days.
FOREX
Almost all currency pairs are testing important resistance and support levels that would be crucial to set further direction for the medium term.
Dollar Index (96.52) is at crucial and important support just now and unless it sees an immediate bounce from current levels, it could be vulnerable to fall towards 95-94 in the near term. A break below 96.50 would break the uptrend from Sep’18.
Euro (1.1304) also has important resistance near 1.1325/50 which should hold to prevent further rise. A sharp break above 1.1325/50 would lead to an eventual rally towards 1.14 and higher in the medium term reversing the longer term outlook to bullish. We would watch price action near 1.1325/50 for confirmation.
Dollar-Yen (107.08) is down to test support at 107. While we may expect the pair to bounce back, there is room for a fall towards 106 in the near term. We would remain cautious and watch price action near immediate support at 107.
Euro-Yen (121.01) is trading above supports at 120 and 121. While these hold, trade within 120-123 looks possible. While above 120, Euro-Yen is bullish for the medium term.
Aussie (0.6930) is rising towards immediate resistance near 0.6950. A corrective dip from either 0.6950 or higher from 0.70 looks possible in the near term.
Pound (1.2715) has very near term resistance at 1.2750 which if breaks could turn bullish towards 1.28 or higher in the longer run. We may prefer a short dip from 1.2750 before Pound resumes its rally towards 1.28-1.29 in the longer run.
USDINR (69.45) closed below 69.50 contrary to our expectation of trading in the 69.50-69.90 region yesterday. This fall is crucial and if sustains, could lead to a test of 69.25 today from where a bounce back towards 69.50 is possible.
INTEREST RATES
The US near term yields have risen after an initial sharp fall seen as reaction to the FED statement while the yields at the farther end remain stable. The 2YR (1.76%) and 5Yr (1.77%) are sharply up from 1.72% and 1.75% while the 10Yr (2.01%) and the 30Yr (2.52%) are stable just now. The 30Yr has room for a fall towards 2.45% which could be tested next week after an initial bounce for 1-2 sessions. But the fall in the near term could be limited and we could hope for some corrective upmoves in the next 1-2 weeks.
The US-Japan 10Yr (2.19%) has risen from 2.13%. If the rise sustains, it could indicate a rise in Dollar-Yen from 107. But note that the yield spread has room towards 2.10% on the downside and if the spread resumes to fall, Dollar Yen could be pushed down towards 106.
The 10Yr GOI (6.9336%) remains bearish to test 6.80/75% on the downside. This could aid Rupee strength in the coming sessions. Resistances are seen near 6.95% and higher at 7%.
USD/JPY Struggling To Regain Ground Post Dovish Fed
Key Highlights
- Recently, the Fed signaled possible interest rate cuts in 2019, putting pressure on the US Dollar.
- USD/JPY settled below 108.50 and even broke the 108.00 support area.
- The US Initial Jobless Claims for the week ending June 15, 2019 declined from 222K to 216K.
- The US Manufacturing PMI in June 2019 (Preliminary) could slide from 50.5 to 50.4.
USDJPY Technical Analysis
In the past few days, the US Dollar traded in a range below 108.80 against the Japanese Yen. Recently, USD/JPY broke the key 108.50 and 108.20 supports and extended its decline below 108.00.
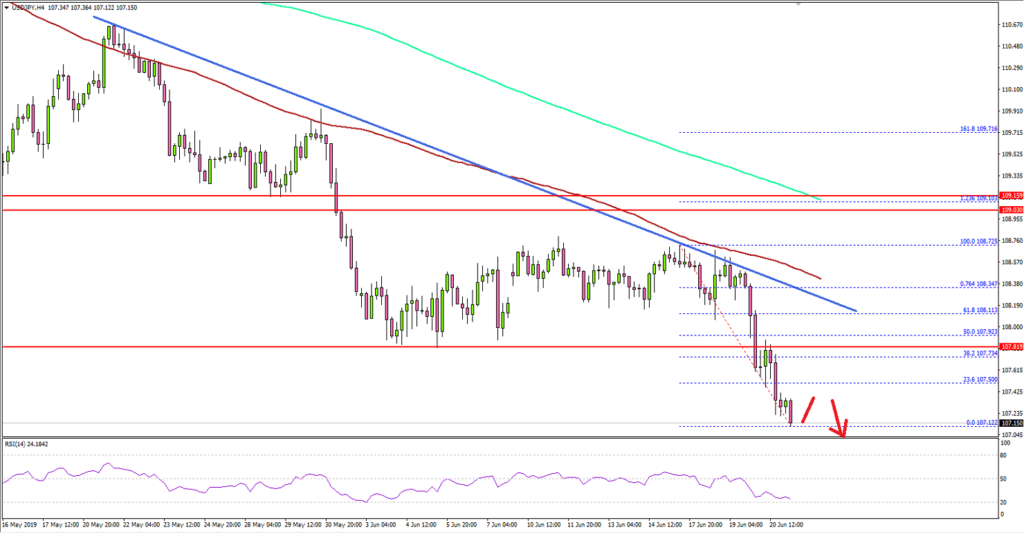
Looking at the 4-hours chart, the pair clearly struggled to gain pace above the 108.80 level and the 100 simple moving average (red, 4-hours). The pair also remained well below the 109.00 pivot level and the 200 simple moving average (green, 4-hours).
More importantly, the Fed recently signaled possibilities of a rate cut due to uncertainties, resulting in a sharp decline in USD/JPY. The pair broke the 108.00 support and traded towards the 107.20 level.
It is currently struggling below 107.50 and is well below the 23.6% Fib retracement level of the drop from 108.72 to 107.12.
To start a decent recovery, the pair must break the 108.00 resistance plus the 50% Fib retracement level of the drop from 108.72 to 107.12. Moreover, there is a crucial bearish trend line forming with resistance at 108.20 on the same chart.
If there is a successful close above 108.00 and 108.25, the pair could start an upward move. If not, there are chances of more losses below 107.20 and 107.00.
Fundamentally, the US Initial Jobless Claims figure for the week ending June 15, 2019 was released by the US Department of Labor. The market was looking for a minor decline in claims from 222K to 220K.
The actual result was better than the market forecast, as the US Initial Jobless Claims declined from 222K to 216K. Besides, the Counting Jobless Claims were down from the last revised reading of 1.699M to 1.662M.
The report added:
The 4-week moving average was 218,750, an increase of 1,000 from the previous week's unrevised average of 217,750.
Overall, the greenback seems to be under pressure after the Fed signaled a possible rate cut in 2019. Pairs such as EUR/USD, GBP/USD and AUD/USD climbed higher recently, whereas USD/JPY declined heavily.
Economic Releases to Watch Today
- Germany's Manufacturing PMI for June 2019 (Preliminary) – Forecast 44.5, versus 44.3 previous.
- Germany's Services PMI for June 2019 (Preliminary) – Forecast 55.4, versus 55.4 previous.
- Euro Zone Manufacturing PMI June 2019 (Preliminary) – Forecast 48.0, versus 47.7 previous.
- Euro Zone Services PMI for June 2019 (Preliminary) – Forecast 52.9, versus 52.9 previous.
- US Manufacturing PMI for June 2019 (Preliminary) – Forecast 50.4, versus 50.5 previous.
- US Services PMI for June 2019 (Preliminary) – Forecast 51.0, versus 50.9 previous.
- US Existing Home Sales for May 2019 (MoM) – Forecast +1.2%, versus -0.4% previous.
Daily Markets Broadcast
Wall Street extends gains on Fed outlook
With most barriers to a Fed rate cut seemingly removed, US indices pushed higher yesterday, approaching record highs again. Crude oil prices soared following the downing of a US surveillance drone in the Gulf.
US30USD Daily Chart
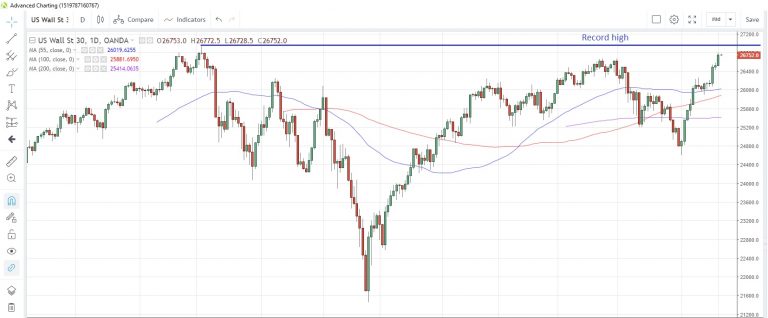
The US30 index rose for a fourth day yesterday, as investors took on more risk in their portfolios following the dovish FOMC meeting yesterday
The index climbed above the April high and now probably has eyes on the record high of 26,940 struck back in October last year
The flash Markit manufacturing PMI is seen drifting lower to 50.4 in June from 50.5 last month, the latest surveys show. Note the June Philadelphia Fed manufacturing index released yesterday was a disappointment, falling to 0.3 from 16.6 with expectations of an 11.0 print.
DE30EUR Daily Chart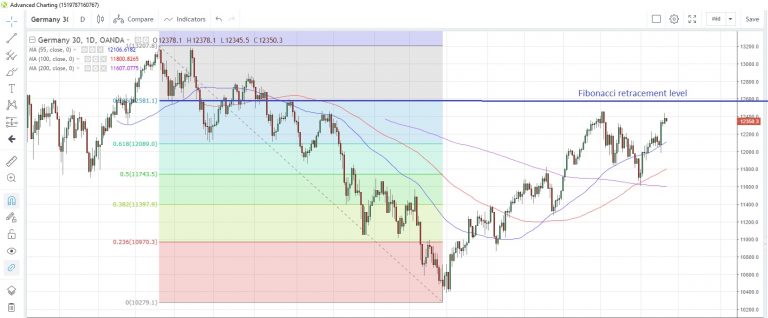
The Germany30 reverted back to positive mode yesterday after Wednesday’s setback, touching a three-week high
The May high of 12,452 is within reach while the 78.6% Fibonacci retracement of the May-December drop last year is at 12,581
Germany’s flash Markit manufacturing PMI is expected to improve slightly to 44.5 in June from 44.3 in May. This would be the 11th month in a row it has been in contraction territory.
WTICOUSD Daily Chart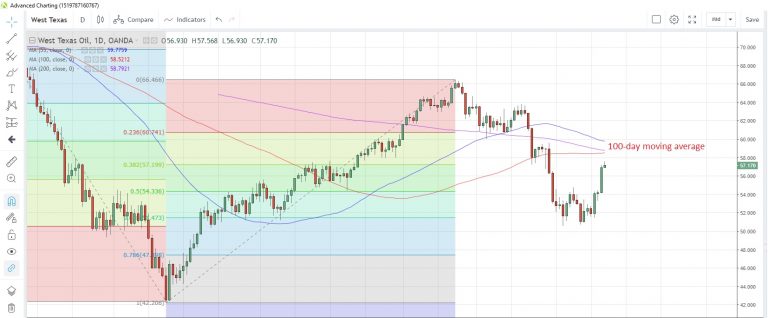
Crude oil prices surged more than 5% yesterday following reports that a US surveillance drone had been shot down in the Gulf
WTI is moving toward the 100-day moving average at 58.52, which has capped prices since May 31
Trump tweeted that Iran had made a “big mistake” by downing the drone. There has been no news about possible responses, though in a later tweet he commented that the incident was probably a mistake by a “loose and stupid” individual.
USD/CAD Canadian Dollar Rises On Oil Surge And Fed Rate Cut Expectations
The US dollar retreated across the board versus major pairs as the dovish tone from the Fed’s latest monetary policy linger. Oil prices rose on the combination of a weak dollar and rising supply uncertainty after Iran shot down a US drone.
The loonie rose as inflation data on Wednesday gives some breathing room to the Bank of Canada to stay put as other major central banks are forced to roll back into easing mode.
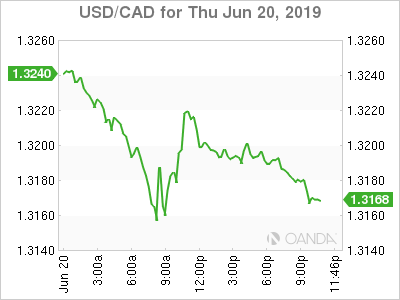
Trade optimism has pushed stock markets higher as presidents Trump and Xi will meet in Japan while taking part in the G20. The USMCA continues rolling through its ratification stage, with Mexico already approving the deal and positive comments from US Rep Lighthizer. Prime Minister Trudeau is in Washington and both nations are ready to push the deal through into legislation.
OIL – Crude Higher After US Drone Shot Down and Soft Dollar
Oil prices surged after Iran shot down a US drone as the relationship between the two nations was already tense. West Texas Intermediate jumped more than 6 percent and Brent 4.46 percent as US President Trump tweeted that Iran had made a big mistake.
Iran has threatened to close the Strait of Hormuz and with the tanker attacks and now this latest incident really puts a lot of uncertainty on global crude supplies. Disruptions have boosted energy prices combined with the dollar weakness after the Fed signalled an interest rate is near.
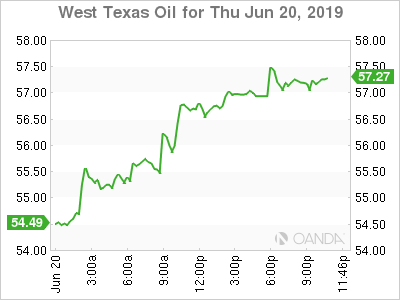
Trade anxiety has died down, pushing energy prices higher as global growth will not be pressured by a prolonged tariff war. The end of June and the beginning of July will be key for oil traders as during the G20 President Xi and Trump will meet to discuss trade. The OPEC+ meeting was moved to follow the G20 and adapt on the outcome of the trade talks. A positive trade outcome would allow the OPEC+ to add some flexibility to the supply cuts and allow some producers to raise their output.
A disappointing meeting between the leaders of China and the United States could be the end of the OPEC+ as members could be asked to keep production at current levels leading to their exit from the group.
GOLD – Dovish Central Banks and Middle East Tension Boost Gold
Gold jumped more than 3 percent on Thursday as the Fed left little doubt that an interest rate is coming and with trade and political tensions still at play the yellow metal was a clear choice for investors looking for a safe haven.
First the ECB and then the Fed came out this week in full dove mode ready to keep easing to avoid falling into a recession. The Fed was ahead of the pack as it had hiked four times in 2018, but increasing macro headwinds are starting to impact economic growth in America.
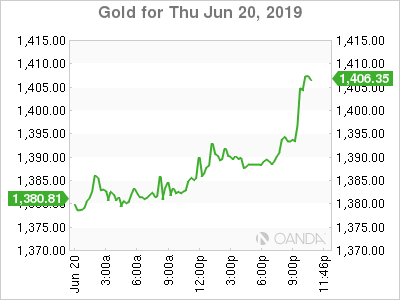
The Fed is near a full 180 on rates as it lifted rates in December, called for patience in January and has now removed that language from its statement as it prepares for its first rate cut at the July Federal Open Market Committee (FOMC) meeting.
Before Fed members sit down, trade uncertainty could be resolved if Xi and Trump reach an agreement ending the prolonged tariff war giving the central bank some breathing room. An unsuccessful meeting by the two leaders on the other hand, could solidify the market view of an US interest rate cut this summer.
STOCKS – Fed Rate Cut Guides Equities Higher
Equities are once again in record territory after the Fed statement removed all monetary policy obstacles in the way of the current rally. The Fed managed to spin the narrative of a central bank willing to step in ahead of the curve, rather than be late to react. Fed Chair Jerome Powell was able to balance a dovish outlook while remaining optimistic about economic growth.
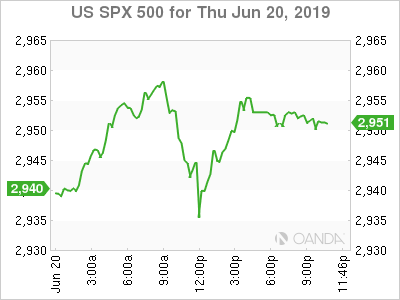
Global monetary policy makers have come out in full dove mode to reassure investors they will act if needed by keeping or even cutting interest rates lower. Markets are now hitting record highs as optimism is high of a positive result in the sit-down between US and China when both leaders are in Japan for the G20 meeting at the end of the month.
Energy stocks followed crude prices higher after the news of Iran shooting down a US drone sparked concerns of supply disruptions after the tanker attacks last week.
Eco Data 6/21/19
[php_everywhere instance="1"]
10-year yield breaks 2% key support, heading to 1.72 next
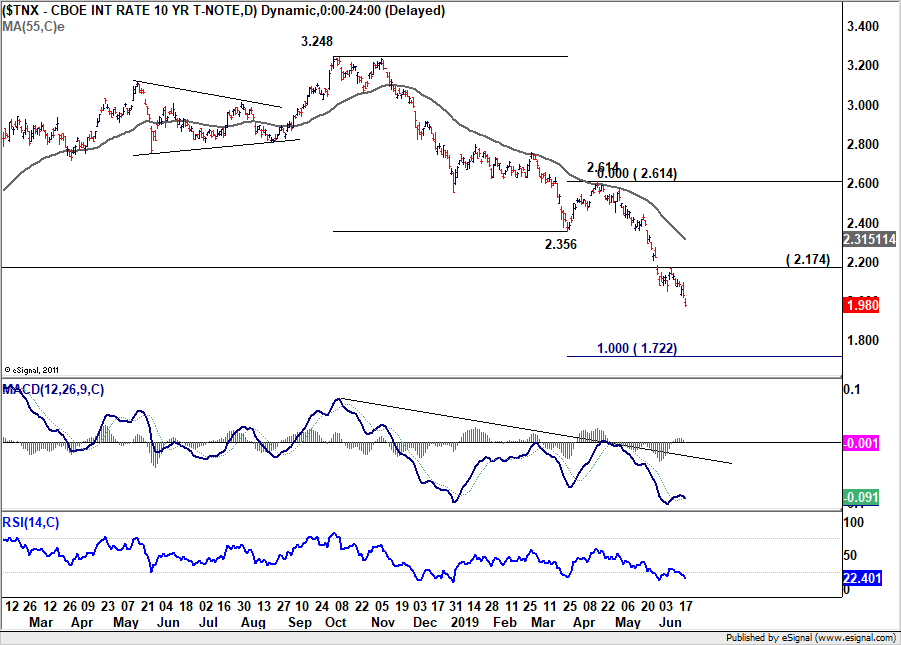
10-year yield open lower today and extends recent down trend to as low as 1.975 so far. With key support zone around 2.0 psychological level taken out rather decisively, further decline should now be seen to 100% projection of 3.248 to 2.356 from 2.614 at 1.722. This will remains the favored case as long as 2.174 resistance holds.
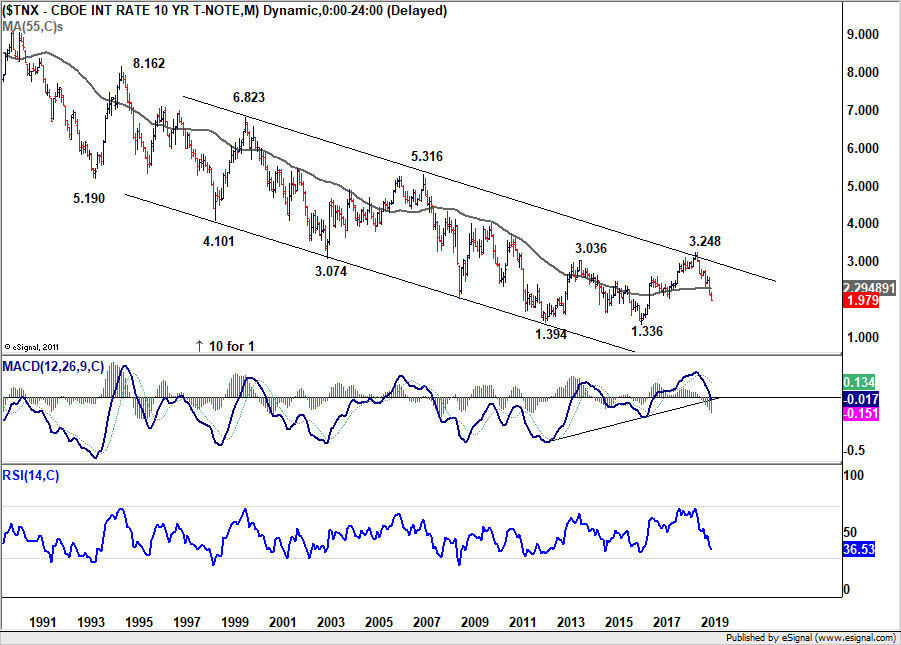
More importantly, from long term perspective, 55 month EMA is also firmly taken out. The three wave consolidation pattern from 1.394 could have completed at 3.248 after hitting decade long trend line resistance. If such interpretation is correct, we might seen 10-year yield falling back to 1.336 low.
US30 Index Returns to Record Highs
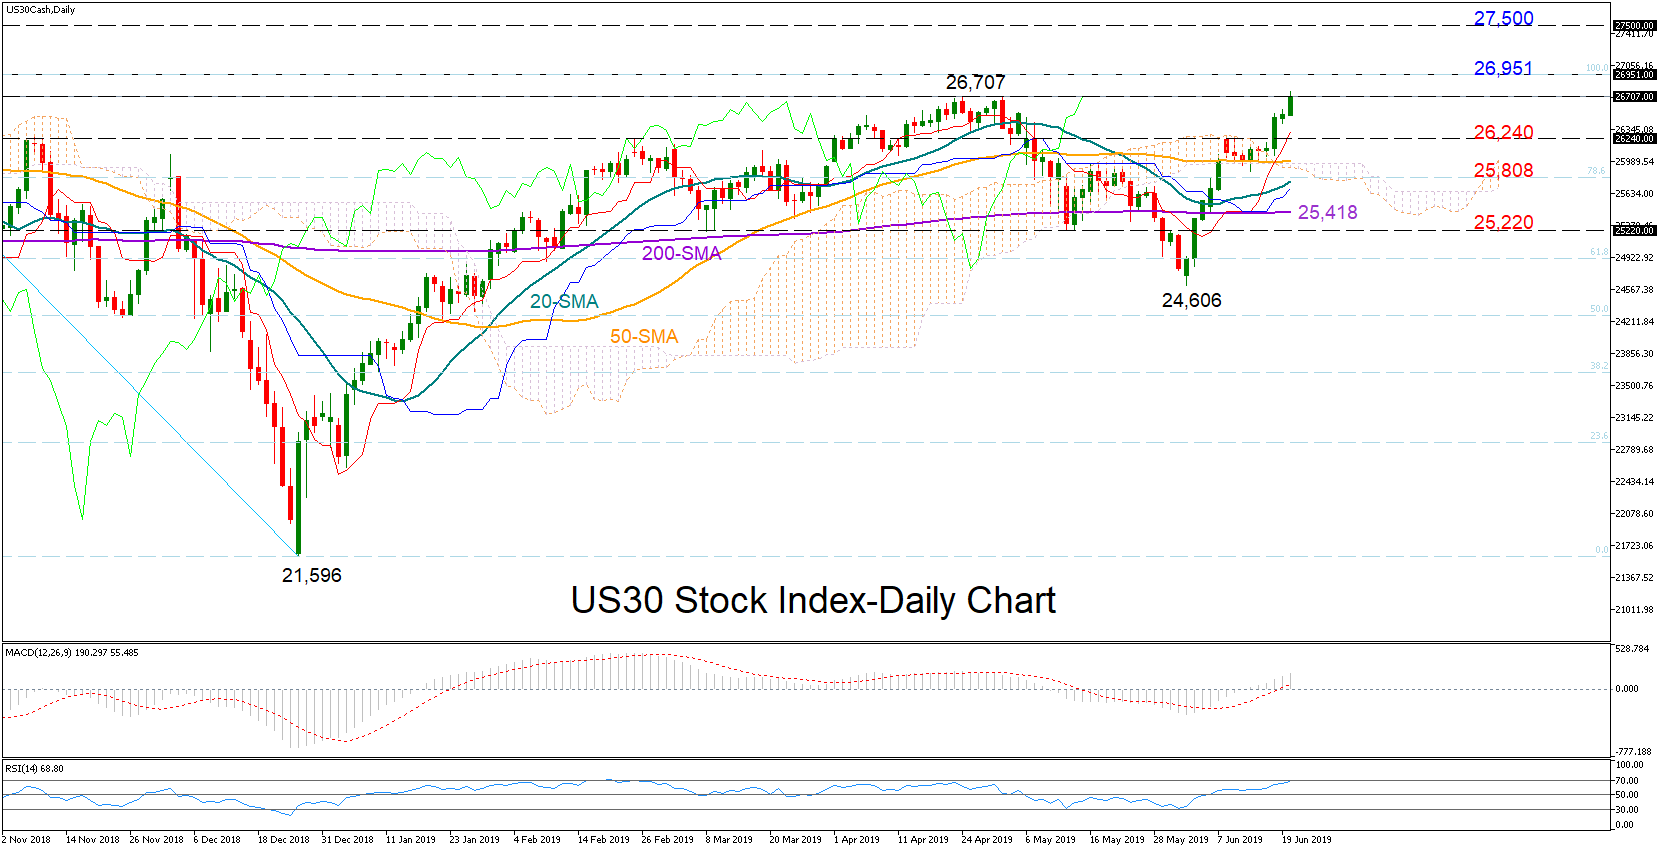
US30 stock index (Dow Jones) is currently flirting with May’s peak of 26,707 but the positive momentum in the MACD, which trends above its red signal line, suggests that September’s record high of 26,951 could be achievable as well. Still, the RSI warns that the market is approaching overbought territory and hence downside corrections cannot be ruled out.
Clearing the 26,951 ceiling, the bulls would aim to test the uncharted area between 27,000 and 27,500.
Otherwise, if the market weakens below the 26,240 resistance level, the 78.6% Fibonacci of 25,808 of the downleg from 26,951 to 21,596 could next halt bearish action. Moving lower, the 25,220 number could provide a stronger base to prevent more aggressive declines.
In the medium-term picture, a bull market could officially begin comfortably above 26,951, while a bearish outlook would resume under 24,606.
Oil Supported on Middle East Tensions and Rising Demand Forecasts
Crude prices are trading sharply as international tensions soar in the Middle East and on fresh stimulus signals from the Fed. Iran is showing they are still able to rattle oil markets with the downing of a US drone. Iran claims the US drone entered in Iranian air space, while the US firmly denies that it is the case. Iran’s media said the drone was shot down near Kuh Mobarak, on Iran’s southern coast, which is just next to the entrance of the Persian Gulf.
Oil prices are out of bear market territory and appear well supported here. With demand forecasts receiving some relief as dovish signals are now strong expected to come from both the Fed and ECB. Demand forecasts could also get another boost if we see a positive outcome with the US – China upcoming trade talk at the G20 summit in Japan.
Crude prices are also being supported as OPEC and allies were finally able to settle on a date to meet and the three biggest producers (Saudi Arabia, Iraq and UAE) are set on extending production cuts for the rest of the year.
West Texas Intermediate crude is higher by 4.9% and Brent is up 3.7%.
MARKET WRAP: Trump’s Tweet Created Panic; BOE Left Interest Rate Unchanged
Bank of England left the interest rate unchanged; gold price maintained its momentum; geopolitical tensions heightened after Trump’s Tweet
Stocks
- The S&P 500 Index made another record high and soared 0.83% as of 15:42 London time, the Nasdaq Composite Index jumped 0.78% and the Dow Jones Industrial Average rose 0.80%.
- The Stoxx Europe 600 increase by 0.84% due to the dovish Fed monetary policy, all European indices recorded a positive day
- The MSCI Emerging Market Index followed global markets and jumped 0.52%.
Currencies
- The Bloomberg Dollar Spot Index took a lot of beating today as prospects of rate cut became stronger. The index dropped nearly 0.47%.
- The Euro recovered its losses and stayed positive for the day. It jumped by 0.77% to $1.1296.
- The British pound may be forming a floor despite the BOE left the rates unchanged. It added 0.40% to $1.2684.
Bonds
- The yield on 10-year Treasuries fell 3 basis points to 1.99%.
- The UK’s 10-year guilt moved by five basis point to 0.81%.
Commodities
- West Texas Intermediate jumped 1.65% to $56.26 a barrel.
- Gold stayed above the 1350 mark and the next target is 1400. It jumped 2.75% to $1,384 an ounce.
EUR/CHF Mid-Day Outlook
Daily Pivots: (S1) 1.1140; (P) 1.1176; (R1) 1.1197; More...
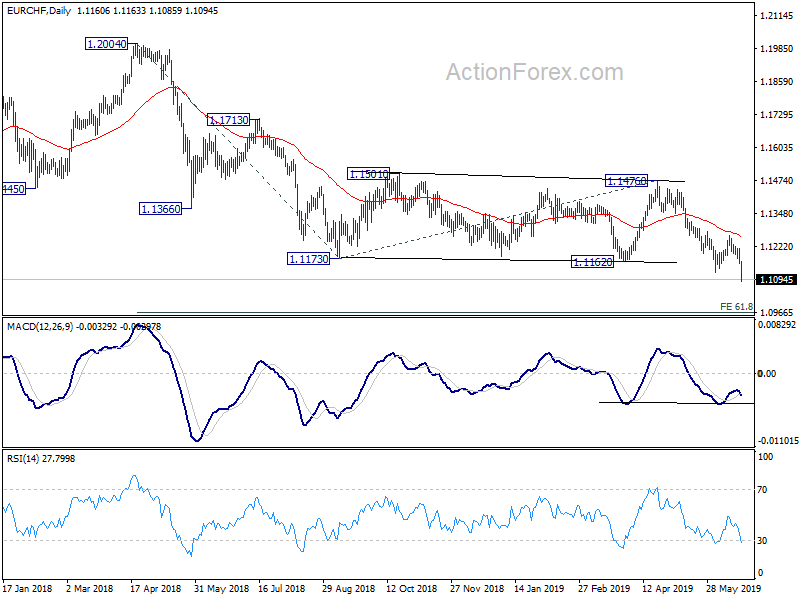
EUR/CHF drops to as low as 1.1085 and break of 1.1119 support confirms down trend resumption. Intraday bias stays on the downside for 61.8% projection of 1.2004 to 1.1173 from 1.1476 at 1.0962 next. On the upside, above 1.1163 minor resistance will turn intraday bias neutral for consolidation first. But recovery should be limited below 1.1264 resistance to bring further decline.
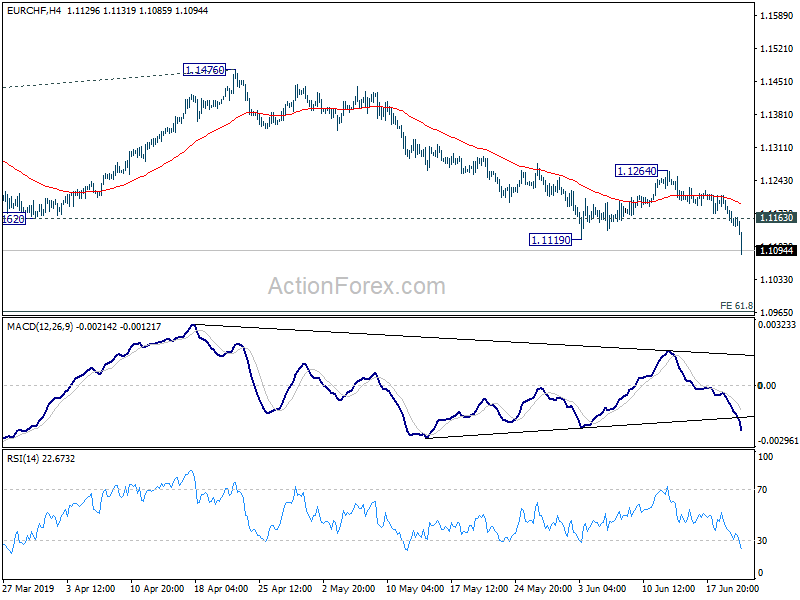
In the bigger picture, current development firstly suggests that down trend from 1.2004 is still in progress. More importantly, it's likely a long term down trend itself, rather than a correction. Outlook will remain bearish as long as 1.1476 resistance holds. EUR/CHF could target 1.0629 support and below.