

Sample Category Title
Aussie Trading Higher In The Asian Session
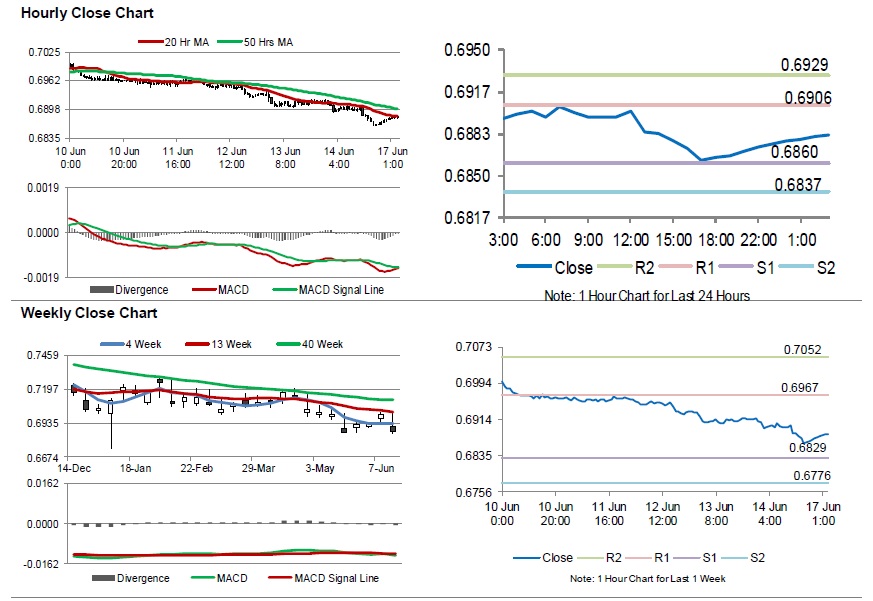
For the 24 hours to 23:00 GMT, the AUD declined 0.69% against the USD and closed at 0.6869 on Friday.
Industrial production in China, Australia’s largest trading partner, advanced 5.0% on a yearly basis in May, undershooting market expectations for a gain of 5.4%. In the preceding month, industrial production had registered a rise of 5.4%.
LME Copper prices rose 0.1% or $8.0/MT to $5805.5/MT. Aluminium prices declined 1.1% or $19.0/MT to $1737.0/MT.
In the Asian session, at GMT0300, the pair is trading at 0.6882, with the AUD trading 0.19% higher against the USD from Friday’s close.
The pair is expected to find support at 0.6860, and a fall through could take it to the next support level of 0.6837. The pair is expected to find its first resistance at 0.6906, and a rise through could take it to the next resistance level of 0.6929.
The currency pair is showing convergence with its 20 Hr moving average and trading below its 50 Hr moving average.
Gold: Yellow Metal Reverses Some Of Its Losses In The Morning Session
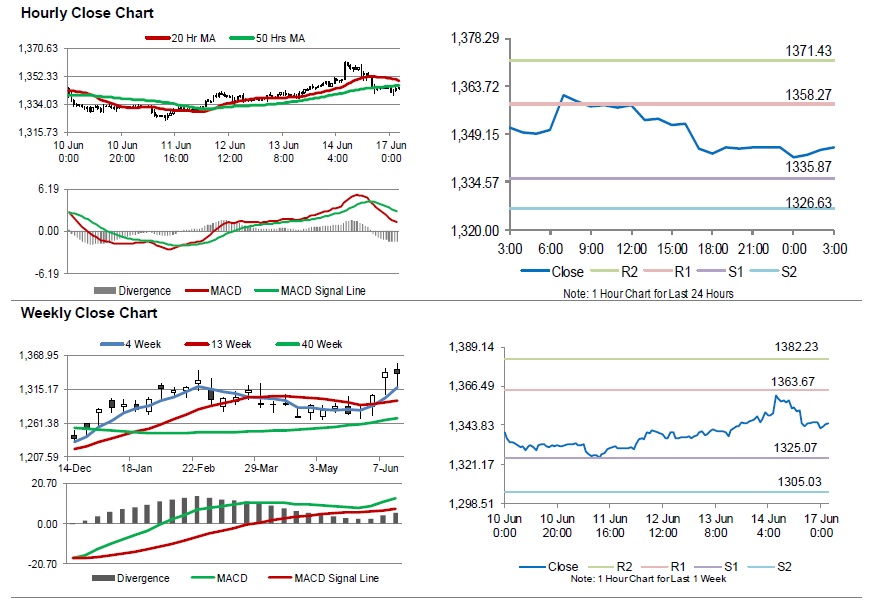
For the 24 hours to 23:00 GMT, Gold declined 0.18% against the USD and closed at USD1345.00 per ounce on Friday, amid broad strength in the US dollar.
In the Asian session, at GMT0300, the pair is trading at 1345.10, with gold trading slightly higher against the USD from Friday’s close.
The pair is expected to find support at 1335.87, and a fall through could take it to the next support level of 1326.63. The pair is expected to find its first resistance at 1358.27, and a rise through could take it to the next resistance level of 1371.43.
The yellow metal is trading below its 20 Hr and 50 Hr moving averages.
Silver: White Metal Trading On A Stronger Footing This Morning
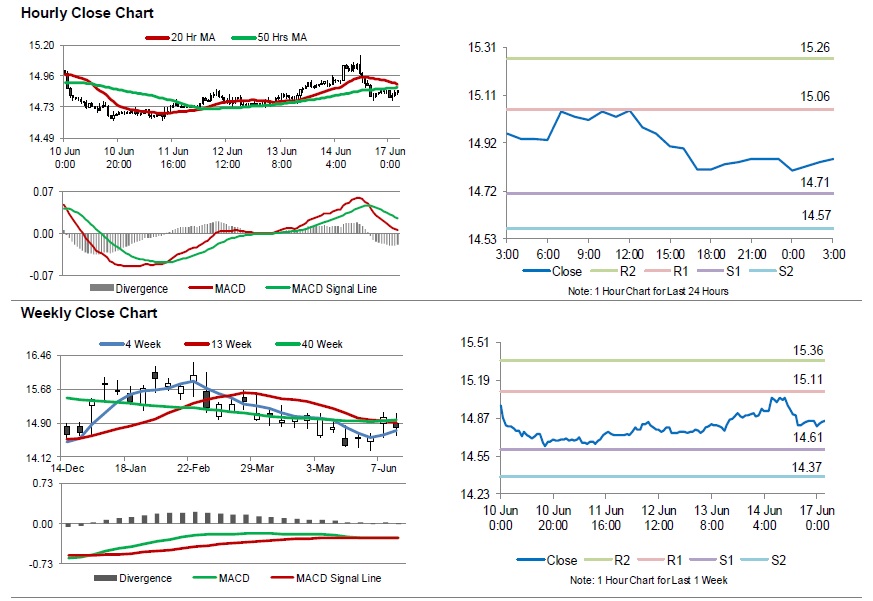
For the 24 hours to 23:00 GMT, Silver declined 0.44% against the USD and closed at USD14.84 per ounce on Friday, tracking losses in gold prices.
In the Asian session, at GMT0300, the pair is trading at 14.85, with silver trading 0.07% higher against the USD from Friday’s close.
The pair is expected to find support at 14.71, and a fall through could take it to the next support level of 14.57. The pair is expected to find its first resistance at 15.06, and a rise through could take it to the next resistance level of 15.26.
The white metal is trading below its 20 Hr and 50 Hr moving averages.
Crude Oil: Oil Trading Higher In The Asian Session
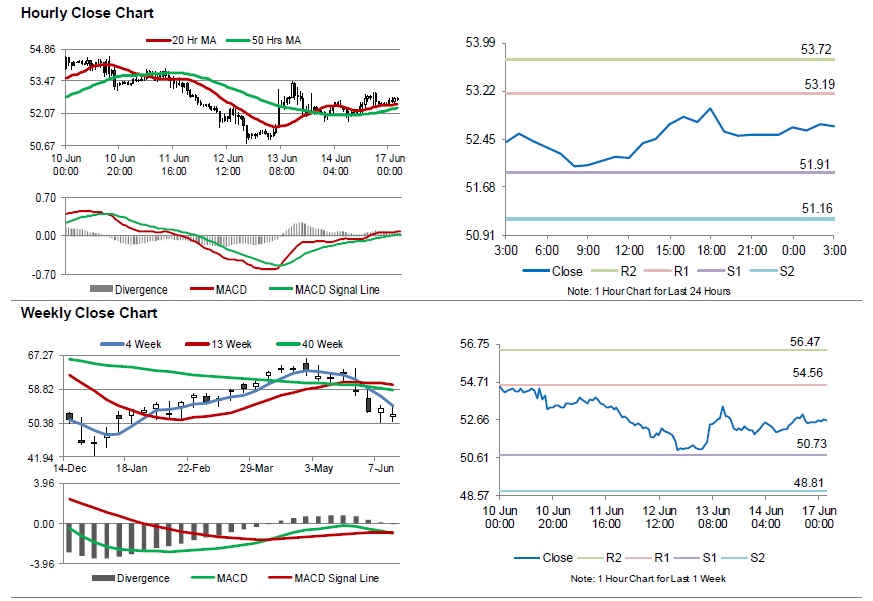
For the 24 hours to 23:00 GMT, Crude Oil rose 0.75% against the USD and closed at USD52.50 per barrel on Friday, after fresh figures from Baker Hughes revealed that the number of active oil rigs declined by 1 to 788 in the week ended 14 June 2019. Moreover, the International Energy Agency (IEA) slashed its 2019 global oil demand growth forecast to 1.2 million barrels per day from 1.3 million barrels per day in the prior month.
In the Asian session, at GMT0300, the pair is trading at 52.65, with oil trading 0.29% higher against the USD from Friday’s close.
The pair is expected to find support at 51.91, and a fall through could take it to the next support level of 51.16. The pair is expected to find its first resistance at 53.19, and a rise through could take it to the next resistance level of 53.72.
Crude oil is trading above its 20 Hr and 50 Hr moving averages.
BCC: Contraction in business investment to drag UK growth in 2020 and 2021
The British Chambers of Commerce revised up 2019 UK growth forecast to 1.3% (from 1.2%), driven by the "exceptionally rapid stock-building" early in the year. However, 2020 growth forecast was downgraded notably to 1.0% (from 1.3%), 2021 downgraded to 1.2% (from 1.4%). In particular, business investment is forecast to contract -1.3% in 2019 before recovering slightly by 0.4% 2020.
Adam Marshall, Director General of BCC noted: "Businesses are putting resources into contingency plans, such as stockpiling, rather than investing in ventures that would positively contribute to long-term economic growth. This is simply not sustainable",
Suren Thiru, Head of Economics at BCC said: "The deteriorating outlook for business investment is a key concern as it limits the UK's productivity potential and long-term growth prospects.... A messy and disorderly exit from the EU remains the main downside risk to the UK's economic outlook as the disruption caused would increase the likelihood of the UK's weak growth trajectory translating into a more pronounced deterioration in economic conditions."
ECB de Guindos: De-anchoring of inflation expectations needed before more monetary stimulus
Over the weekend, ECB Vice President Luis de Guindos said current monetary policy is "fully compatible with both inflation and real activity." And, "de-anchoring of inflation expectations" is needed before ECB ease monetary policy again.
He told Italian newspaper Corriere della Sera that "what we need to see is a de-anchoring of inflation expectations" for more policy stimulus. However, "this has not yet happened, despite the fact that there has been a drop in market-based inflation expectations." "If there is a further deterioration, then we will react," de Guindos added. "But for now, our monetary policy stance is fully compatible with both inflation and real activity."
On the impact of global trade tensions, de Guindos said "you can certainly smooth the impact with monetary policy, but you will not be able to address and fix this kind of problems with monetary policy".
Separately, Governing Council member Ewald Nowotny said it would be "reasonable" to have "some more flexibility" on inflation target. And, he was "in favor of keeping the 2 percent target but with a corridor of 0.5 or 1 percent, up or down. A precision landing is hardly possible."
FOMC Preview – Preparing for Rate Cut
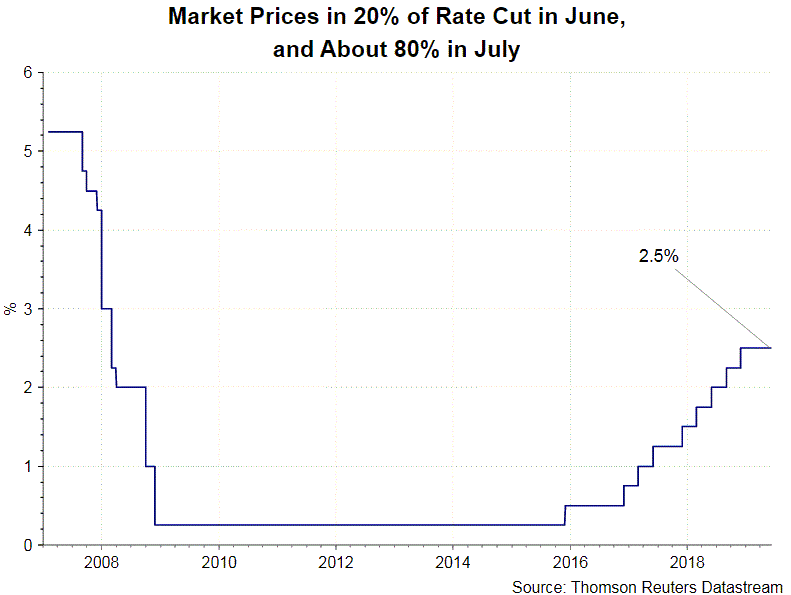
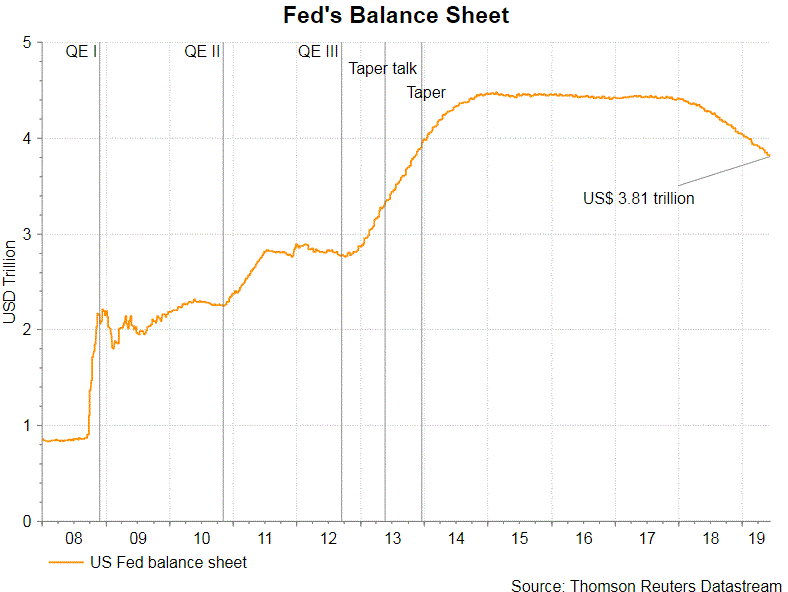
The Fed could make a number of changes in the upcoming June FOMC meeting, to pave way for a rate cut in as soon as July. We would focus on three things: updated economic projections, adjustment in the forward guidance and median dot plot. It is likely that the Fed would leave the policy rate unchanged at 2.25-2.50% this week. Yet, dovish changes in the above-mentioned three items would pave the way for a return of the monetary easing policy.
Downward Revisions in Economic Projections
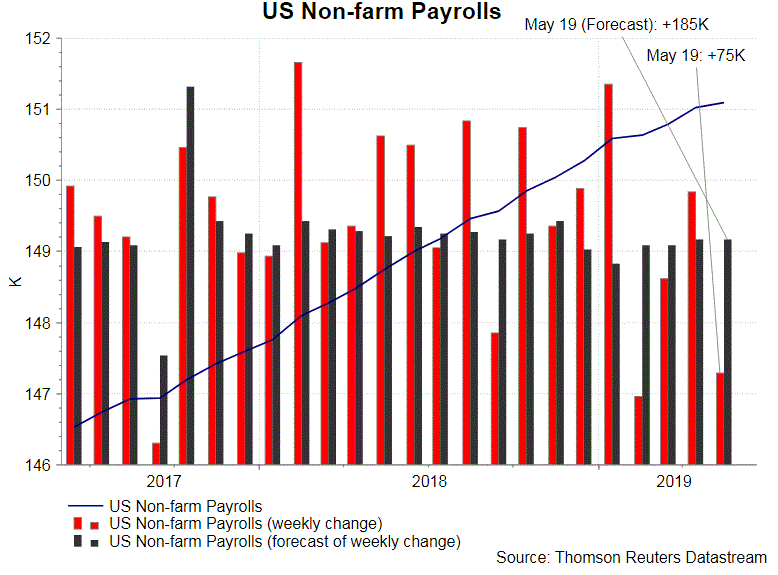
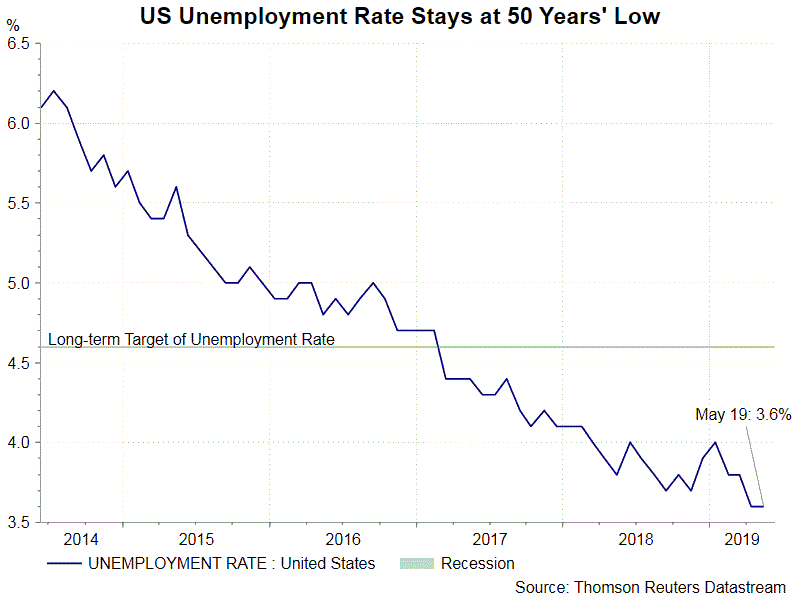
The Fed’s dual mandates are to maximize sustainable employment and to maintain price stability with a +2% inflation target. On the job market, nonfarm payrolls increased +75K in May, missing consensus of +185K and April’s addition of +224K. The unemployment rate stayed at decades’ low of 3.6% and the participation rate also stayed at 62.8%. Wage growth eased to +3.1% y/y, from +3.2% in April.
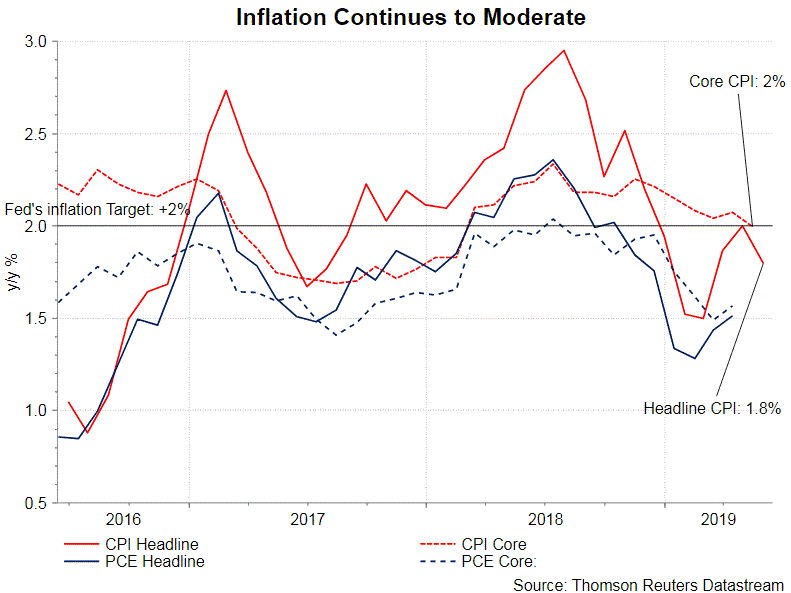
On inflation, headline CPI slowed to +1.8% y/y in May, missing consensus of +1.9% and down from +2% a month ago. Core CPI, excluding food and energy prices, also eased to +2% from April’s +2.1%. Considering Fed’s preferred inflation gauge, PCE, the core reading improved slightly to +1.6% y/y in April from , +1.5% in March.
Meanwhile, the second estimate GDP growth was revised lower to +3.1% q/q saar in 1Q19, compared with the initial reading of +3.2%. Although consumer confidence suggests that spending has remained firm, we expect growth to slow in the second quarter.
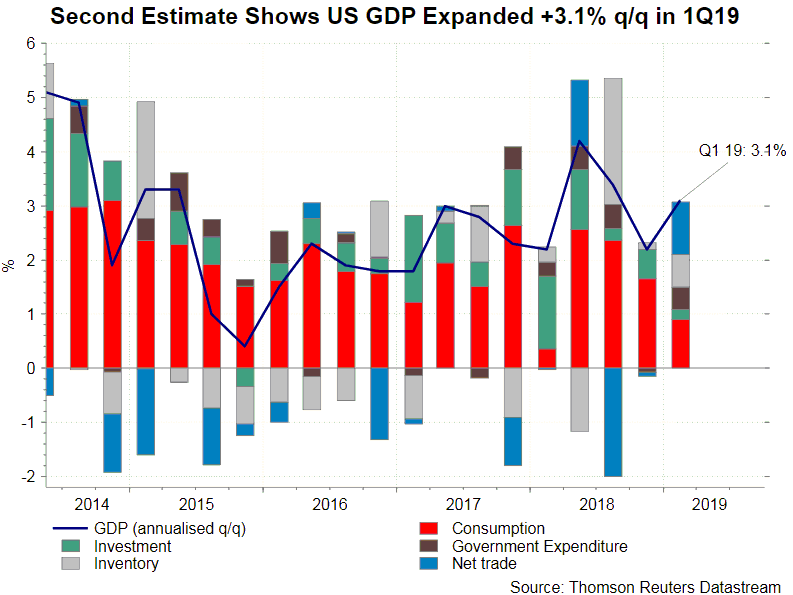
Against the backdrop, the members should revise lower the economic projections to reflect weaker inflation and probably a less resilient growth outlook.
Removing “Patient” in Forward Guidance
Given the moderation in US economic data and expectations of further deterioration, it is likely that the Fed would amend its forward guidance. Over the past months, the Fed had reiterated that “the Committee will be patient as it determines what future adjustments to the target range for the federal funds rate may be appropriate to support these outcomes”. In June, we expect the members might remove the term “patient” and note that any action would very much depend on incoming data. This could help pave the way for rate cut later in the year.
Median Dot Plot
Although the market overwhelmingly expects that the Fed would keep its powder dry in June, rate cut(s) would happen, almost certainly this year. The question is to what extent. The 30-day Fed funds futures shows that that there is 83% chance of a rate cut in July and 87% chance that the Fed would lower the policy rate by at least twice this year. More Fed members should have turned more dovish this month than in March. Their views would be reflected in the latest median dot plot. In March, the median dot plot projected no rate adjustment this year, followed by one rate hike in 2020. Depending how dovish the Fed’s message is, we expect the latest median would at least show no change in the policy rate in 2020.
Dollar Steadies At Start Of Central Bank Week
Indices positive
Most stock market indices were higher at the start of trading this week while the US dollar consolidated Friday’s gains. US indices traded between 0.21% and 0.35% with the Hong Kong index outperforming, recouping more than Friday’s losses after Legislative Council leader Carrie Lam announced at the weekend that she was suspending efforts to pass the legislation and issued a formal apology to HongKongers. Press reported that about 2 million people took part in a peaceful protest that jammed road near government offices on Sunday.
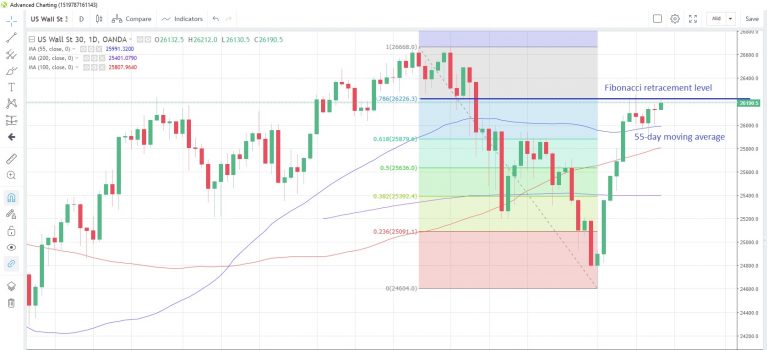
US30USD Daily Chart
PBOC liquidity trickles in
The second phase of recent Reserve Ratio Requirements cuts announce on May 6 came into effect today, releasing CNY100 billion into the banking system while in its daily open market operations it added a net CNY120 billion versus a CNY100 billion drain Friday. The weak industrial production data for May released Friday, where expansion slumped to a 17-year low, has kicked off renewed expectations of further easing from the PBOC. 10-year Chinese yields fell more than 3bps while the offshore yuan slid 0.02% to 6.9311.
India to levy tariffs
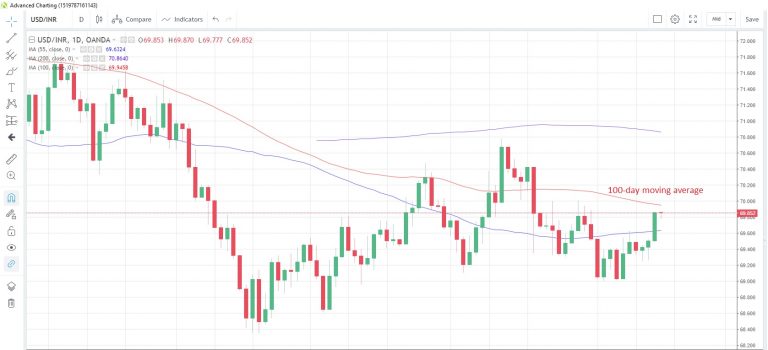
India has announced retaliatory tariffs on 28 US goods in response to US President Trump’s suspension of India’s status under the Generalized System of Preference trade program. The named goods include apples (worth about $156 million in 2018) and almonds worth about $543 million. This month the Indian rupee has declined 1.2% versus the US dollar since US President Trump announced the removal of preferential status would go ahead. The FX pair is now at 69.844.
USD/INR Daily Chart
A slow start to the week
The data calendar has little to offer investors at the start of the week with the European session featuring only Euro-zone Q1 Labour costs and the monthly report from Germany’s Bundesbank. The North American session is also quiet with the NY Empire State manufacturing index and the NAHB Housing market index for June both due. For Canada, portfolio flows for April will be released.
No doubt the main event of the week will be the FOMC meeting from Tuesday to Wednesday. Market pricing is suggesting only an 18% probability of a 25bps cut at this week’s meeting, but expectations are building the comments and discussions will lead to a cut at the July meeting, with an 82% probability attached to that event.
Daily Markets Broadcast
Wall Street indices edge higher
US indices have started this week off with modest gains ahead of the Federal Reserve’s rate meeting Tuesday/Wednesday. Expectations are high that rate cuts will be discussed, which is helping to support stock markets.
US30USD Daily Chart
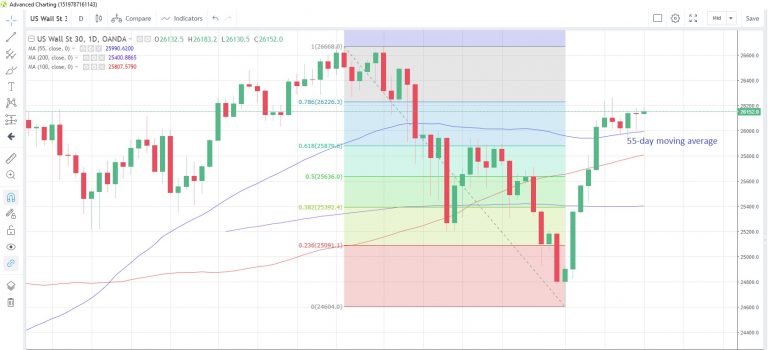
The US30 index rose modestly last week as stalemate in the US-China trade talks was overcome by rising prospects the Fed may be shifting to an easing bias. The index has started positively in early trading this morning
The index is still holding above the 55-day moving average at 25,990, while the 100-week moving average at 24,703 remains a key support level below
The key event of the week will be the FOMC meeting with markets expecting some comments/discussion about rate cuts. There are no major economic data releases scheduled for today.
DE30EUR Daily Chart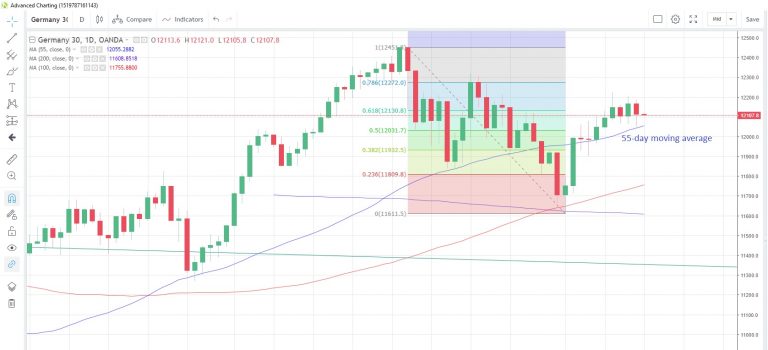
The Germany30 index declined on Friday and has opened this morning with a negative bias
The index is still above the 55-day moving average at 12,055, which has supported prices on a closing basis since June 3
Italy appears to be heading for a confrontation with the EU over next year’s budget after Italy’s Deputy PM Salvini that tax cuts are needed next year, adding that the EU’s fiscal rules are outdated. There are no major releases for either Germany or the Euro-zone today.
CN50USD Daily Chart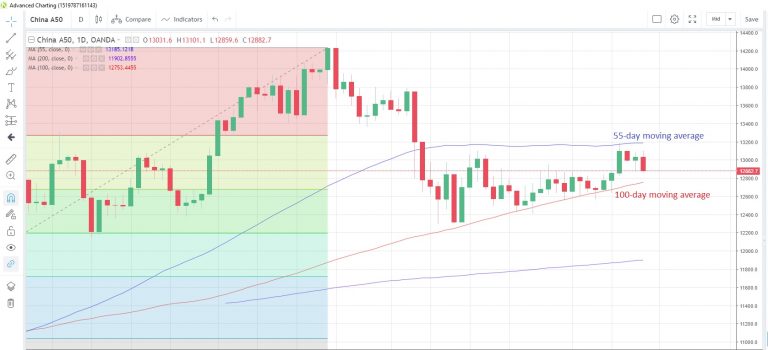
The China50 index fell the most since May 23 on Friday as the Hong Kong protest against the extradition law hit sentiment
The index is sandwiched between 55-day moving average resistance at 13,185 and 100-day moving average support at 12,753
Retail sales rebounded in May, rising 8.6% y/y, above economists’ estimates. However, industrial production missed forecasts with a slump to +5.0% y/y, the weakest expansion in 17 years, according to data released Friday.
Market Morning Briefing: Aussie Remains Bearish
STOCKS
Global equities like the Dow and DAX remains mixed in the near-term while the broader picture continues to remain positive. Nikkei is heading towards a crucial resistance which has to be broken to extend the upmove. Shanghai retains its sideways range. Sensex and Nifty are turning vulnerable to break their sideways range on the downside and see a sharp fall on profit booking.
Dow (26089.61, -17.16, -0.07%) is stuck in a narrow range above 26000. Our bias is bullish for the Dow to breach the resistance at 26250 and rise to 26500-26600 in the coming days. Key supports are at 26000 and 25750.
DAX (12096.40, -72.65, -0.60%) can dip to test 12000 in the near term before we see the uptrend resuming towards our preferred target of 12300.
Nikkei (21167.72, +50.83, +0.24%) sustains above 21000. But as mentioned earlier, it has to breach 212500 to gain momentum and target 21500-21750. Inability to breach 21250 can drag it below 21000 targeting 20750 and 20500 on the downside.
Shanghai (2895.39, +13.41, +0.47%) retains its 2835-2950 sideways range and we have to wait for a breakout of this range to get a clear cue on the next trend. While below 2920, the index can fall within this range towards 2850 in the near term.
Sensex (39741.36, -15.45, -0.04%) and Nifty (11914.05, +7.85, +0.07%) retains their 39300-40300 and 11800-12200 range respectively. However, the bias is turning bearish for them to break the range on the downside and fall to 38500-38000 (Sensex) and 11700-11600 (Nifty)
COMMODITIES
Gold has to surpass the crucial resistance at 1360 to gain further momentum and avoid a fresh fall. Silver looks relatively weaken than gold. Copper can continue to consolidate within its overall downtrend. Oil can inch higher in the near term. A sideways consolidation looks likely before a fresh leg of downmove begins in oil.
Gold (1340) spiked to 1358 on Friday and has come-off sharply from there. While below 1345, it can dip to 1330 and 1320 ahead of the Fed meeting. Gold has to surpass 1360 decisively in order to turn the outlook bullish. Else a fall to 1300-1280 cannot be ruled out in the coming weeks.
The resistance at 15.1 has been holding very well for Silver (14.85). The outlook is bearish for a fall to 14.5 and 14.25. The resistance in the 15.0-15.10 region can continue to cap the upside.
Copper (2.64) fell on Friday within its sideways range as expected on Friday. It is likely to retain the 2.60-2.68 sideways range for some more time with the bias continuing to remain negative for it to break the range below 2.60 and fall to 2.58 and 2.55.
Brent (62.27) sustains above 61 and has moved higher as expected. A test of 63-64 looks likely in the near term, but a break below 64 is unlikely. As mentioned earlier, a sideways consolidation between 59.5 and 64 is possible before a fresh leg of downmove begins.
Similarly, WTI (52.67) can move up to 54 and 54.5 in the near term while it remains above 52. It can trade sideways between 50.5 and 55 for some time within its overall downtrend.
FOREX
Dollar index has gained momentum after the US retail sales data release on Friday. It looks bullish to rise further. Most of the major currencies are getting closer to their key supports. The outcome of the Fed meeting on Wednesday would be the trigger to decide whether these supports hold or not and set the trend. Dollar-Rupee looks bullish in the near-term and has room to test 70.10 and even 70.25 while it remains above 69.50.
Dollar Index (97.51) is bullish. Immediate support is in the 97.45-97.35 region. Key short-term support is at 97. While above 97.35, a rise to 97.8 (initially) and then to 98.25-97.45(eventually) can be seen in the coming days.
Contrary to our expectation Euro (1.1220) has declined below 1.1260. It will have to be see if it can sustain above 1.12 or not and avoid further fall to 1.1175 and 1.1125. Inability to rise past 1.1260 from current levels can drag the Euro below 1.12.
Dollar-Yen (108.68) has risen above 108.5. The trend is down. But while above 108.40, an intermediate upmove to 109 looks likely first before the downtrend resumes towards 108 and 107.
Euro-Yen (121.95) fell below 122 but has bounced-back from the low of 121.5. The near-term view has turned negative. While above 121.75, an intermediate bounce to 122.25 can be seen after which a fresh fall to 121 is possible.
Aussie (0.6880) remains bearish. The resistance at 0.6900 can cap the upside in the current bounce-back move. Aussie can then reverse lower again targeting 0.6830-0.6800 on the downside.
Pound (1.2594) has broken the 1.2650-1.2750 sideways range on the downside. The bias is turning negative. A crucial support is at 1.2550 which if broken can accelerate the downmove to 1.2500 or even 1.2400 in the coming days.
USDCNY (6.9195) can inch higher, but at a slower pace towards 6.93-6.94 in the coming days. It can trade sideways between 6.90-6.94 for some time with the bias being bullish for it to breach 6.94 and rally to 6.98 and 7.0
USDINR (69.8050) can test the immediate resistance at 69.90 and see an intermediate pull-back move to 69.75. There is room for the pair to test 70.10 or even 70.25 this week while it remains above 69.50.
INTEREST RATES
All eyes will be on the outcome of the US Federal Reserve meeting on Wednesday. A change in stance from the Fed to decrease rates this year has been largely priced in the market already. But it will be important see the possible number of rate cuts that the Fed hints for this year.
The US yields have bounced slightly. Though the broader trend is down, the 30Yr (2.61%), 10Yr (2.11%) and 5Yr (1.86%) have room to test 2.65%-2.70%, 2.15% and 1.92% respectively on the upside before resuming the overall downtrend.
The German yields have dipped slightly. The 30Yr (0.32%), 10Yr (-0.26%) and 5Yr (-0.61%) may negate the bullish view if they fail to bounce from current levels. In that case they can fall to 0.25% (30Yr), -0.50% (10Yr) and -0.75% in the short term.
The 10Yr GOI (7.0665%) fell sharply on Friday after the weak WPI inflation data release. The broader downtrend is intact. A break below 7.05% can drag the yield further lower to 7.00% and 6.95% in the coming days.