Sample Category Title
AUD/USD Weekly Outlook
AUD/USD's decline last week suggested that corrective recovery from 0.6864 has completed 0.7022, after rejection by 55 day EMA. Late breach of 0.6864 support argues that fall from 0.7295 is resuming. Initial bias stays on the downside this week. Sustained trading below 0.6864 will pave the way to 0.6722 low. On the upside, break of 0.6918 will delay the bearish case and turn intraday bias neutral first.
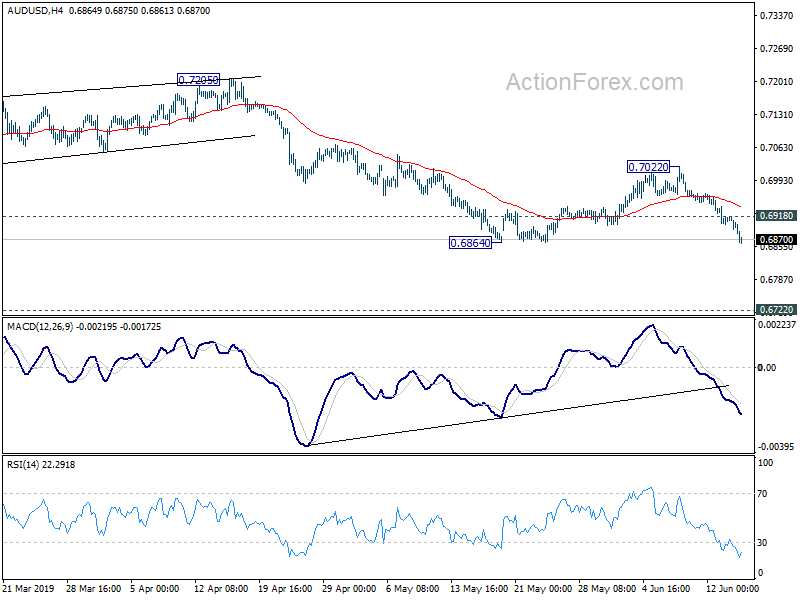
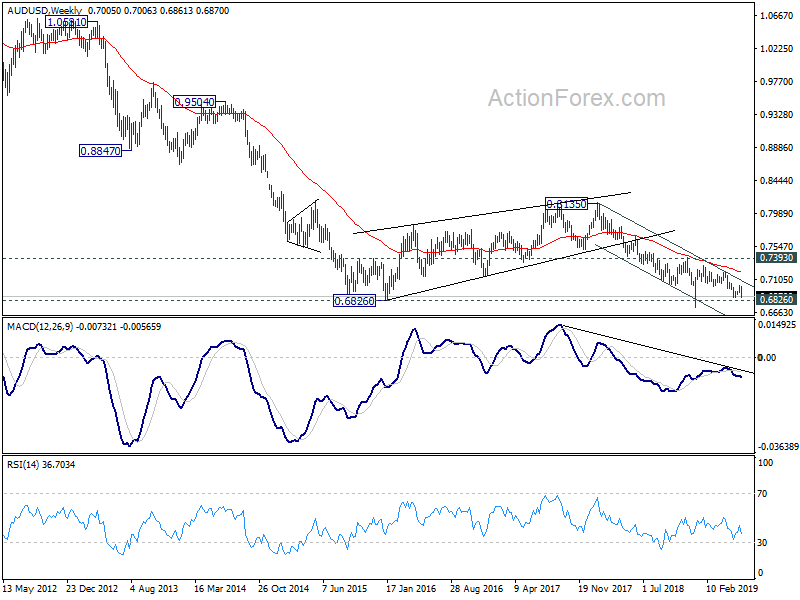
In the bigger picture, with 0.7393 key resistance intact, medium term outlook remains bearish. The decline from 0.8135 (2018 high) is seen as resuming long term down trend from 1.1079 (2011 high). Decisive break of 0.6826 (2016 low) will confirm this bearish view and resume the down trend to 0.6008 (2008 low). However, firm break of 0.7393 will argue that fall from 0.8135 has completed. And corrective pattern from 0.6826 has started the third leg, targeting 0.8135 again.
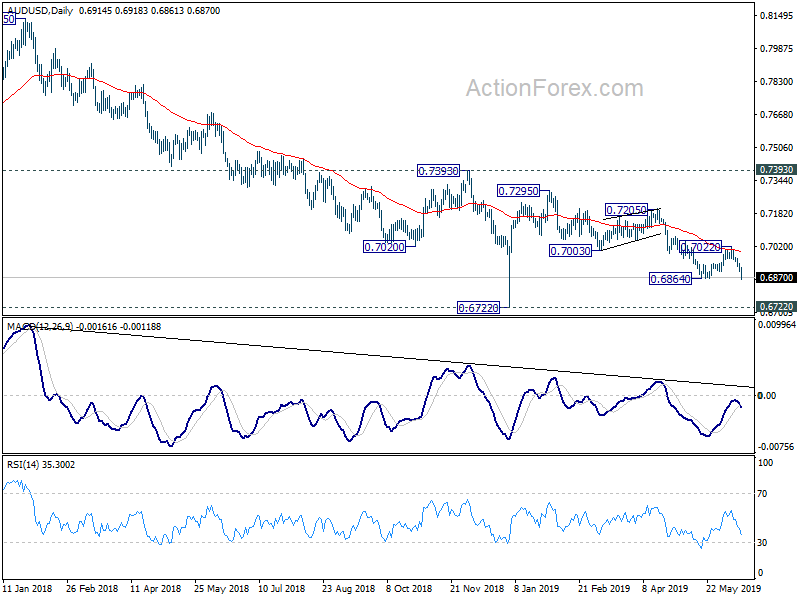
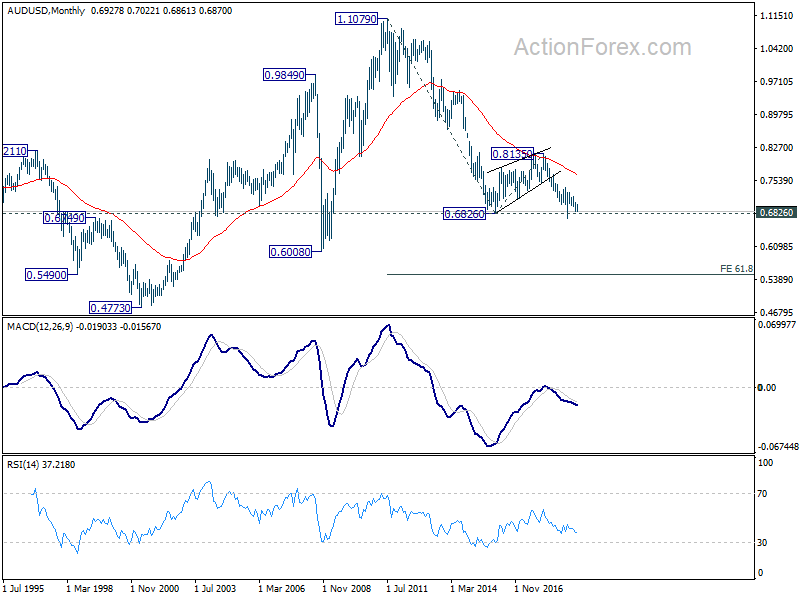
In the longer term picture, prior rejection by 55 month EMA maintained long term bearishness in AUD/USD. That is, down trend from 1.1079 (2011 high) is still in progress. Sustained break of 0.6826 will target 0.6008 low and then 61.8% projection of 1.1079 to 0.6826 from 0.8135 at 0.5507.
USD/CAD Weekly Outlook
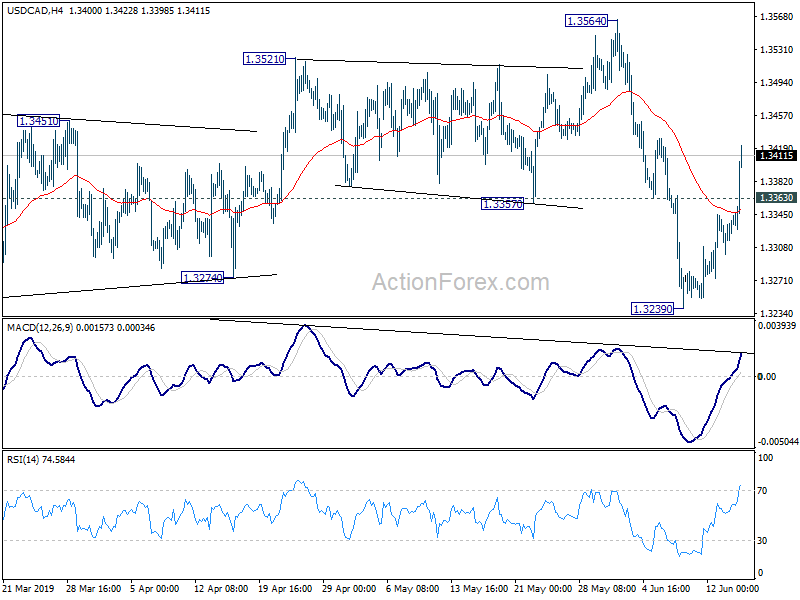
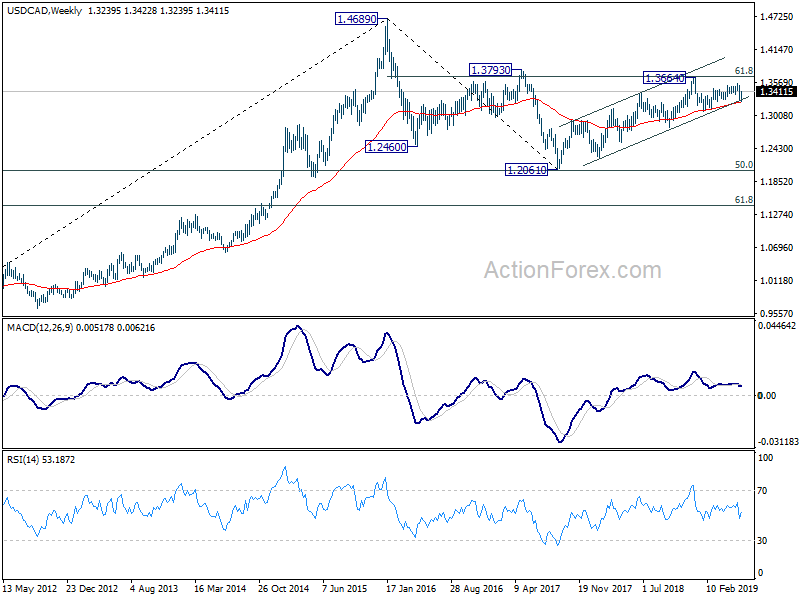
USD/CAD edged lower to 1.3239 last week but rebounded strongly from there. The development dampen original view of bearish trend reversal. Initial bias is back on the upside this week for rebound towards 1.3564 resistance first. Break will target 1.3664 high. On the downside, below 1.3239 will target 1.3052/68 cluster support.
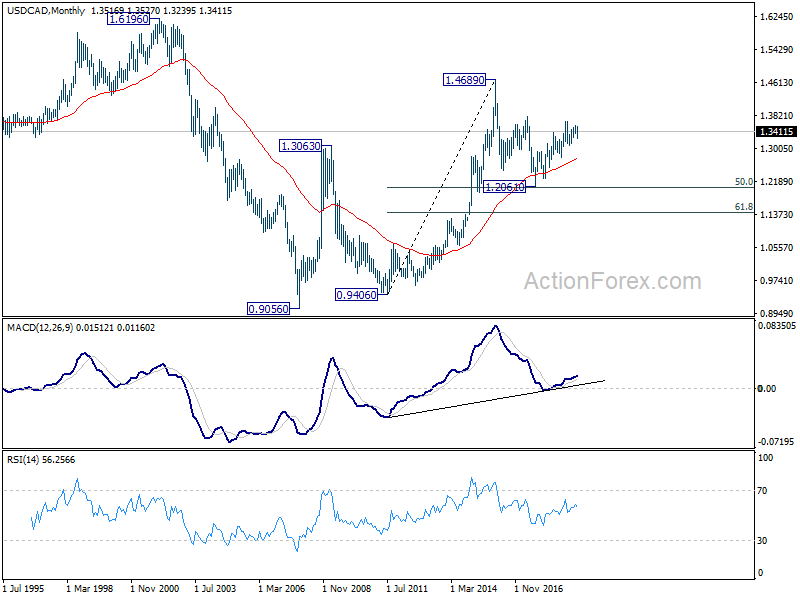
In the bigger picture, outlook is turned mixed after USD/CAD drew strong support from 55 week EMA (now at 1.3232) and rebounded. Nevertheless, sustained break of 61.8% retracement of 1.4689 (2016 high) to 1.2061 at 1.3685, is needed to confirm resumption of up trend from 1.2061 (2017 low), towards 1.4689. Otherwise, medium term outlook will stay neutral first. Break of 1.3239 will revive the case of medium term topping at 1.3664. And, decisive break of 1.3068 cluster support (38.2% retracement of 1.2061 to 1.3664 at 1.3052) will confirm and pave the way to 61.8% retracement at 1.2673 next.
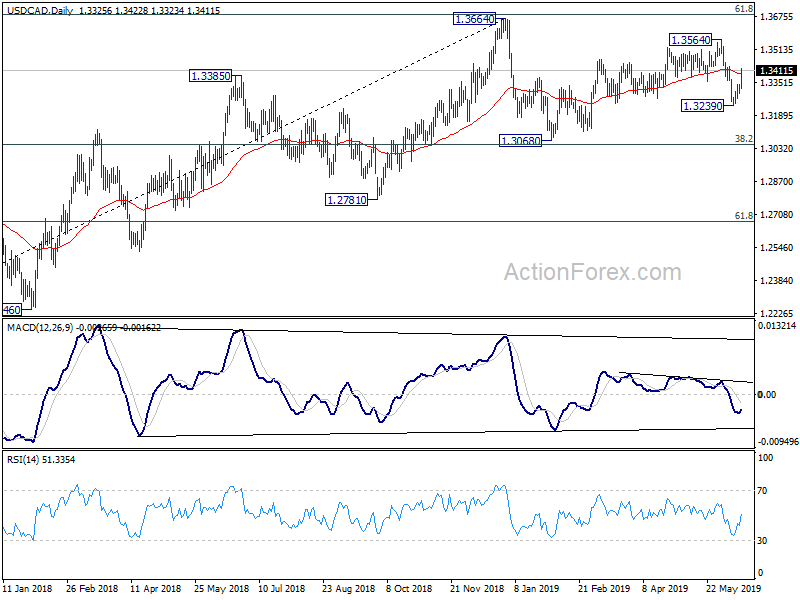
In the longer term picture, outlook remains unchanged that price actions from 1.4689 (2016 high) are forming a corrective pattern. Rejection by 1.3793 resistance would raise the chance of lengthier extension, with risk of dropping through 1.2061 low before completion.
GBP/JPY Weekly Outlook
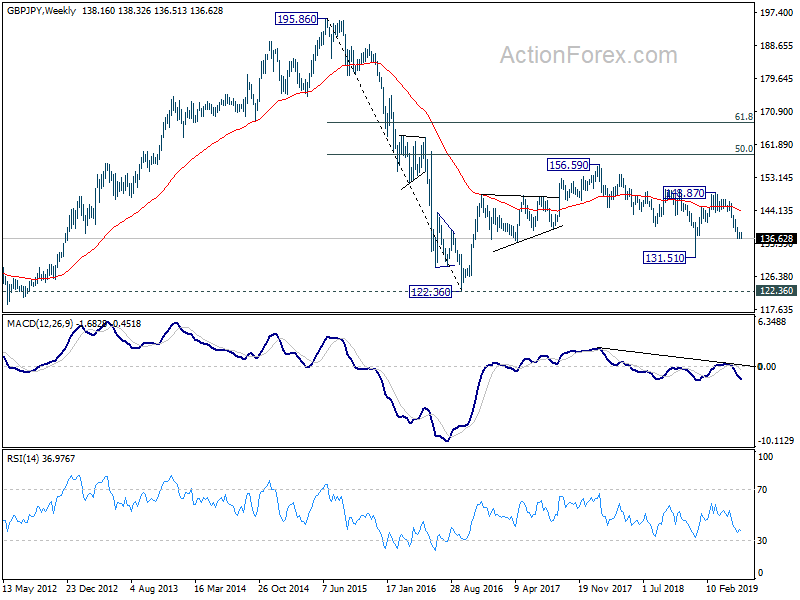
GBP/JPY's late break of 136.55 suggests that decline from 148.87 is resuming. Initial bias is now on the downside this week for 131.51 low next. On the upside, break of 138.32 resistance is needed to indicate short term bottoming. Otherwise, outlook will remain bearish in case of recovery.
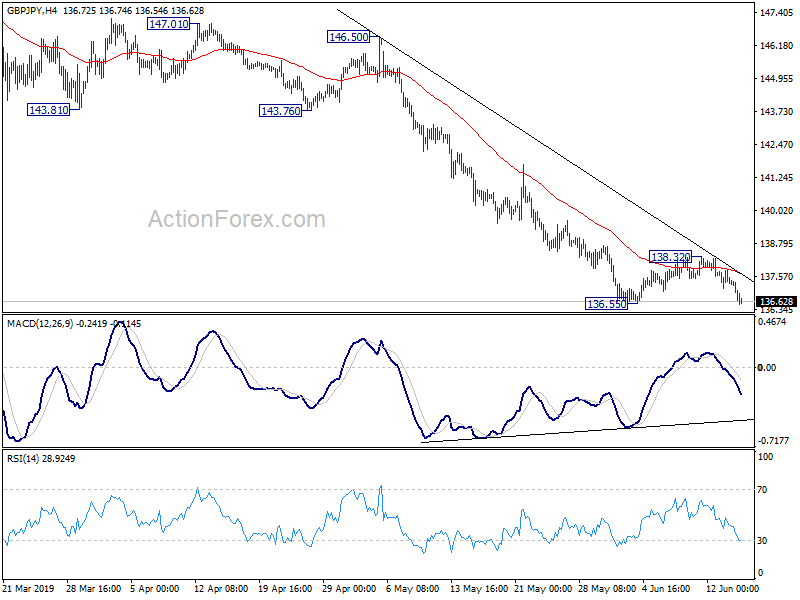
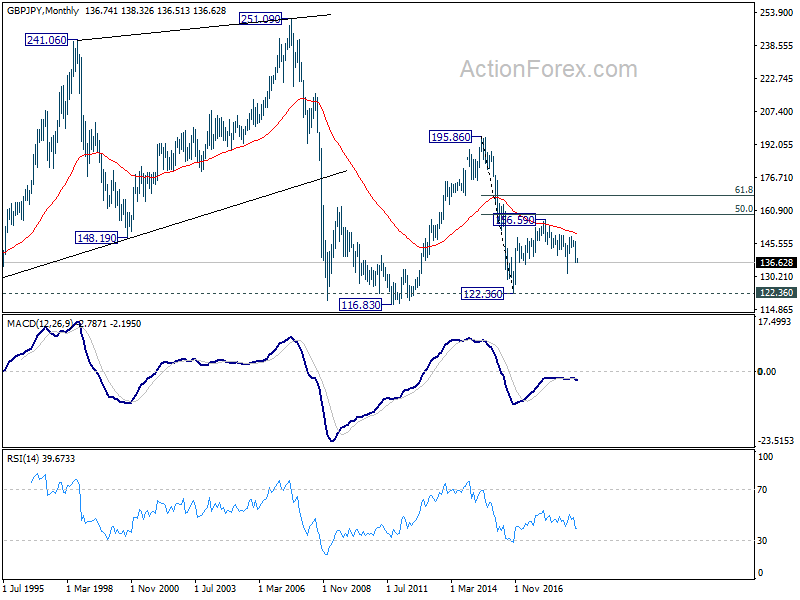
In the bigger picture, current development suggests that GBP/JPY's medium term fall from 156.59 (2018 high) is still in progress. Break of 131.51 will target 122.36 (2016 low). Structure of such decline is corrective looking so far, arguing that it's just the second leg of consolidation from 122.36. Thus, we'd expect strong support from 122.36 to contain downside to bring reversal.
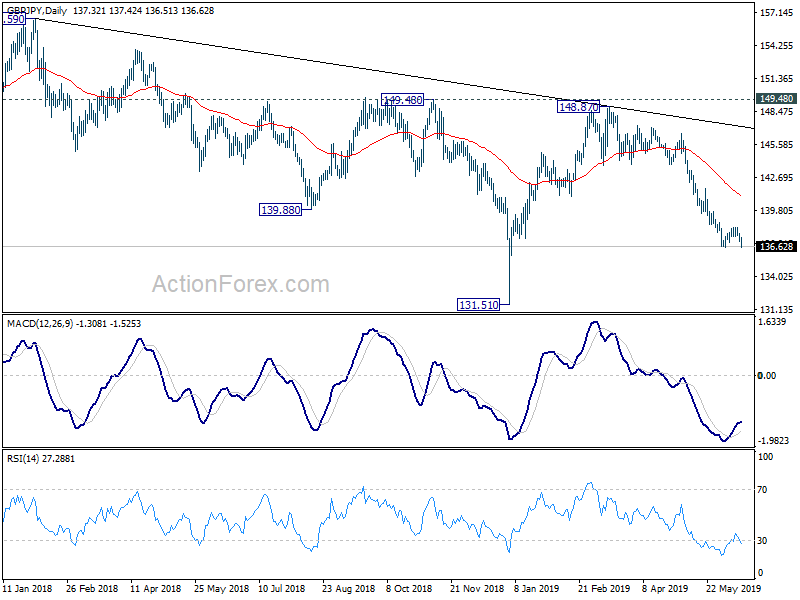
In the longer term picture, firstly, GBP/JPY's is kept well below 55 month EMA, keeping outlook bearish. But we're treating price actions from 122.36 as a corrective pattern. Hence, we'd expect range trading to continue longer. In case of an extension, strong resistance is likely to be seen at 50% retracement of 195.86 (2015 high) to 122.36 at 159.11 to limit upside. However, break of 122.26 will put 116.83 (2011 low) back into focus.
EUR/JPY Weekly Outlook
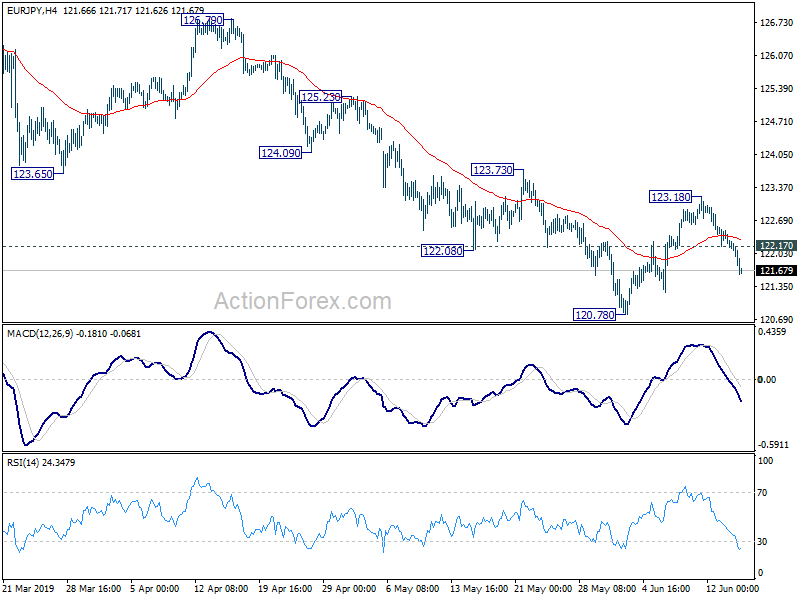
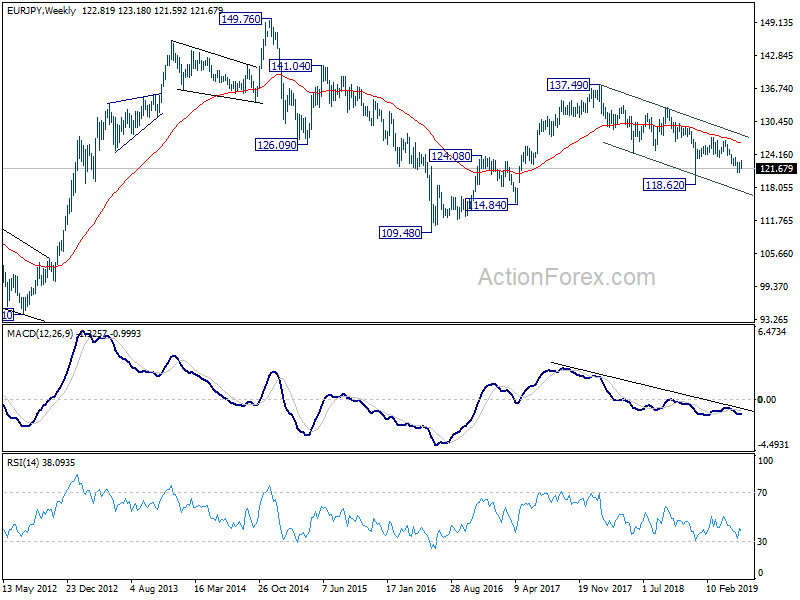
EUR/JPY edged higher to 123.18 last week but dropped sharply since then. The development suggests that corrective recovery from 120.78 has completed. Initial bias remains on the downside this week for 120.78 low first. Break will resume larger fall from 127.50 and target 118.62 low next. On the upside, above 122.17 minor resistance delay the bearish case, turn intraday bias neutral and bring more consolidations first.
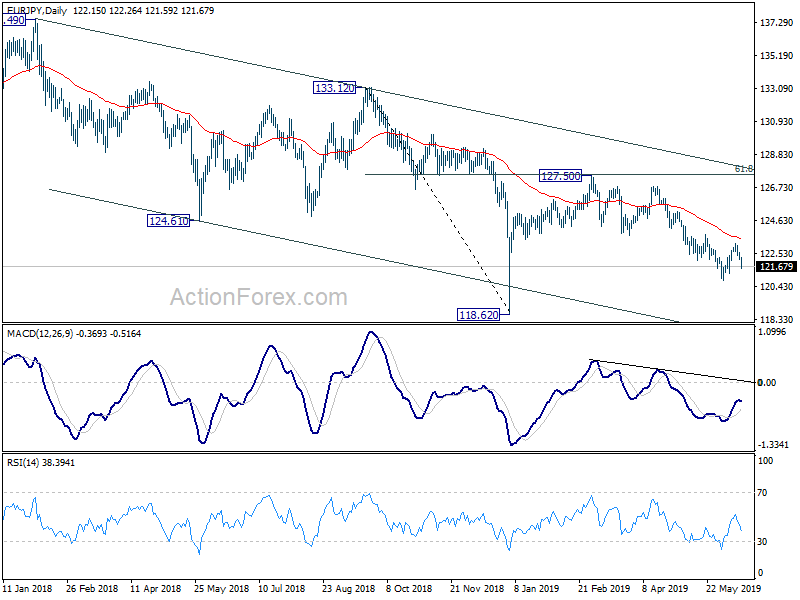
In the bigger picture, down trend from 137.49 is still in progress with the cross staying inside long term falling channel. Break of 118.62 will extend the fall to 109.48 (2016 low). On the upside, break of 127.50 resistance is needed to be the first sign of medium term reversal. Otherwise, outlook will remain bearish in case of strong rebound.
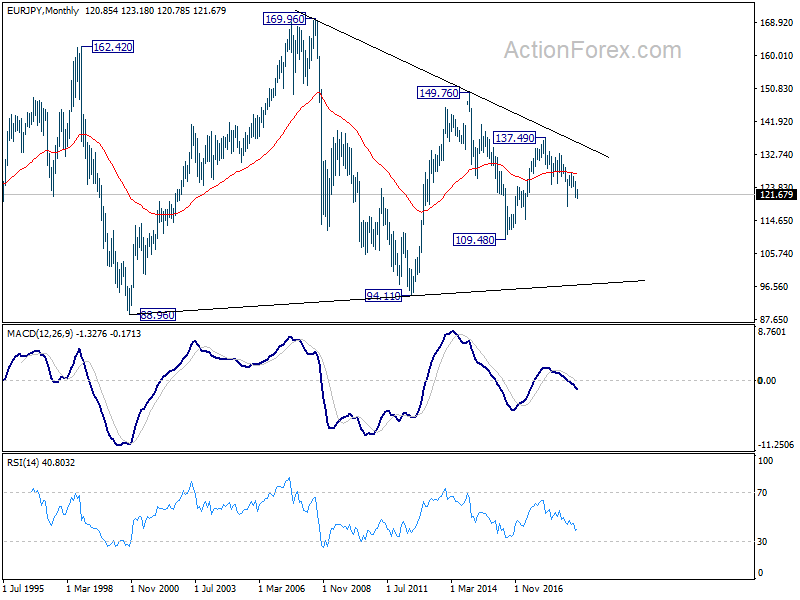
In the long term picture, EUR/JPY is staying in long term sideway pattern, established since 2000. Fall from 137.49 is seen as a falling leg inside the pattern. Break of 118.62 will extend this falling leg through 109.48 (2016 low). With EUR/JPY staying below 55 month EMA, this is now the preferred case.
EUR/GBP Weekly Outlook
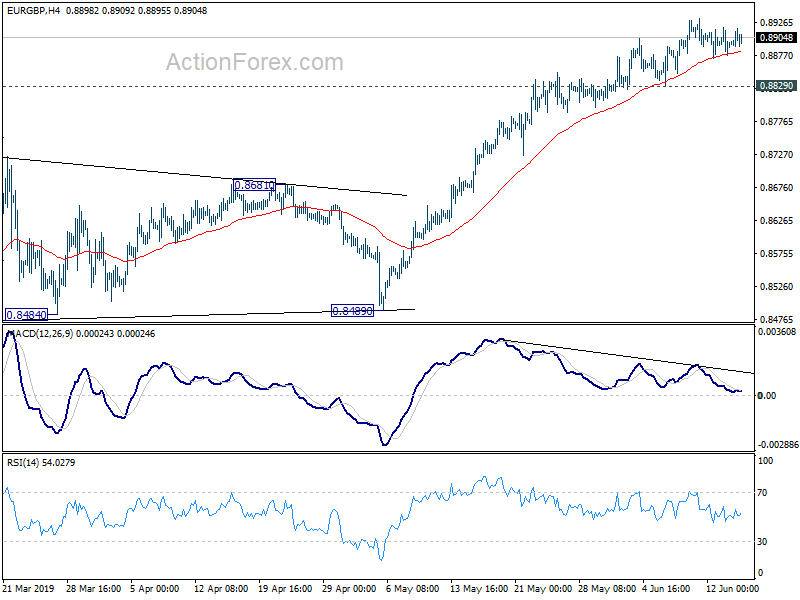
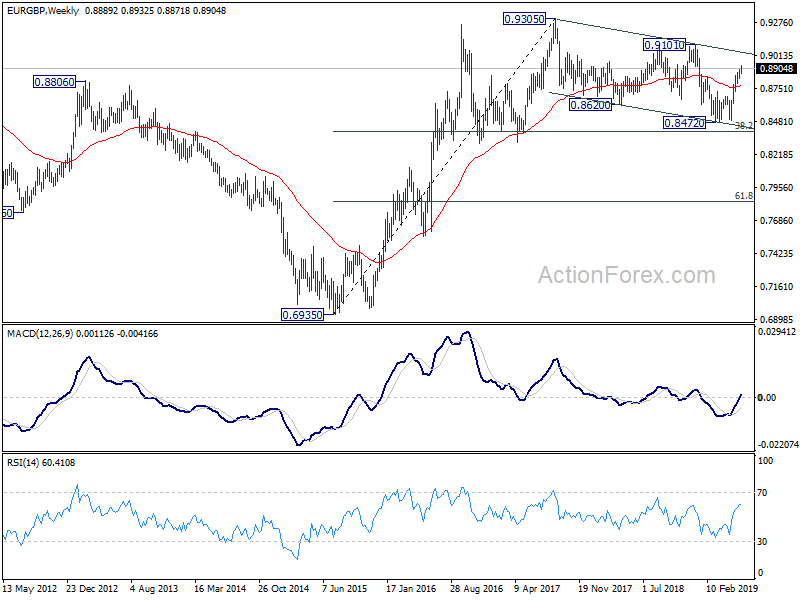
EUR/GBP rise from 0.8472 extended higher last week with diminishing upside momentum. But there is no clear sign of topping yet. Further rise is expected this week as long as 0.8829 support holds, for 0.9101 key resistance. Considering bearish divergence condition in 4 hour MACD, we'd be cautious on strong resistance from there to limit upside to bring pullback. On the downside, though, break of 0.8829 support will indicate short term topping and bring lengthier consolidation before staging another rise.
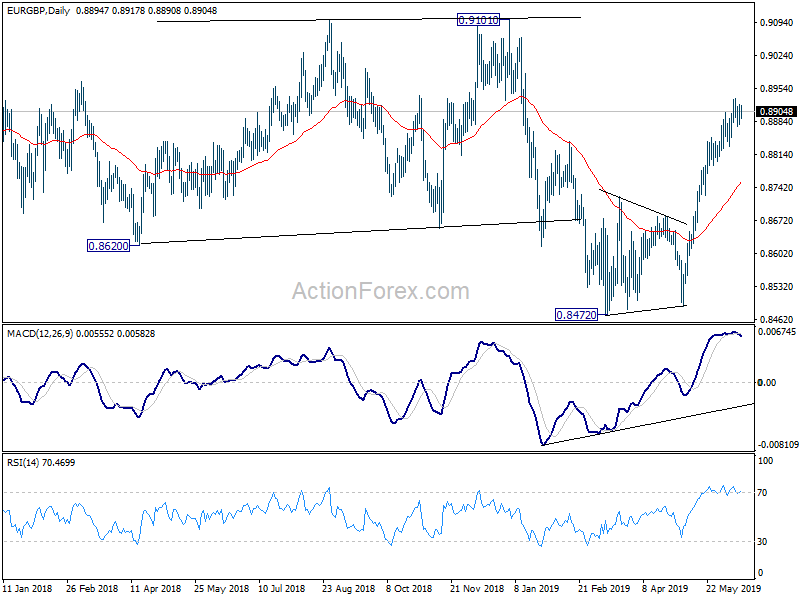
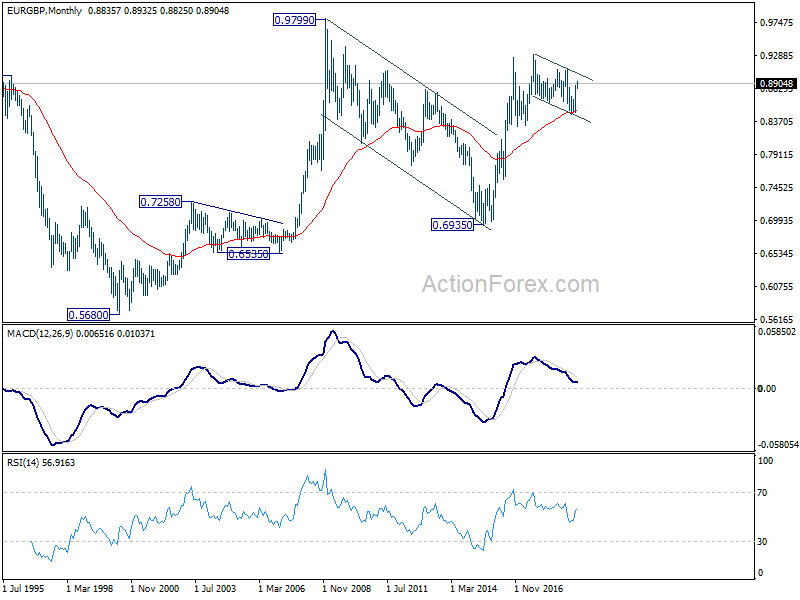
In the bigger picture, medium term decline from 0.9305 (2017 high) is seen as a corrective move. No change in this view. Current development argues that it might have completed with three waves down to 0.8472, just ahead of 38.2% retracement of 0.6935 (2015 low) to 0.9306 at 0.8400, after hitting 55 month EMA (now at 0.8527). Decisive break of 0.9101 resistance will confirm this bullish case. Nevertheless, as EUR/GBP is still staying inside long term falling channel, correction from 0.9305 could still extend to 0.8400 fibonacci level before completion, if upside is rejected by 0.9101.
In the long term picture, we're holding on to the view that rise from 0.6935 (2015 low) is resuming the up trend from 0.5680 (2000 low). As long as 50% retracement of 0.6935 to 0.9304 at 0.8120 holds, further rise should be seen through 0.9305 to 0.9799 and above down the road.
EUR/AUD Weekly Outlook
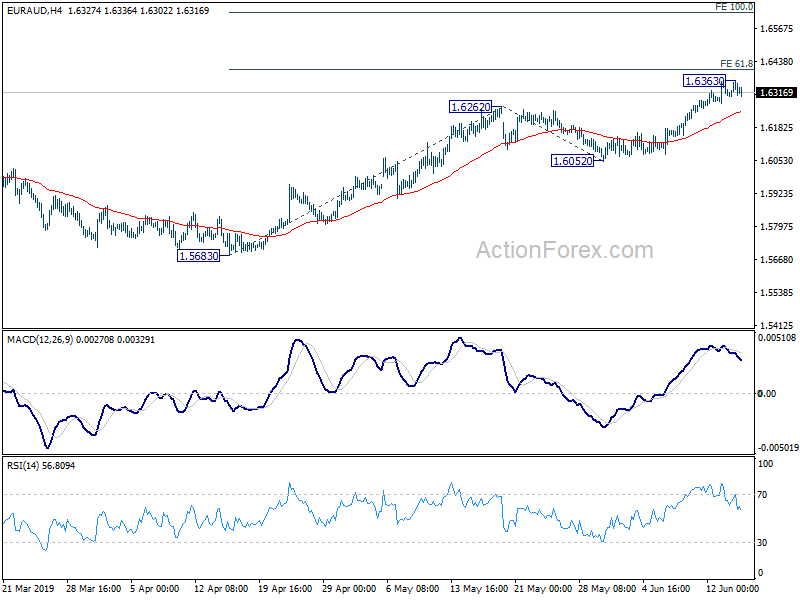
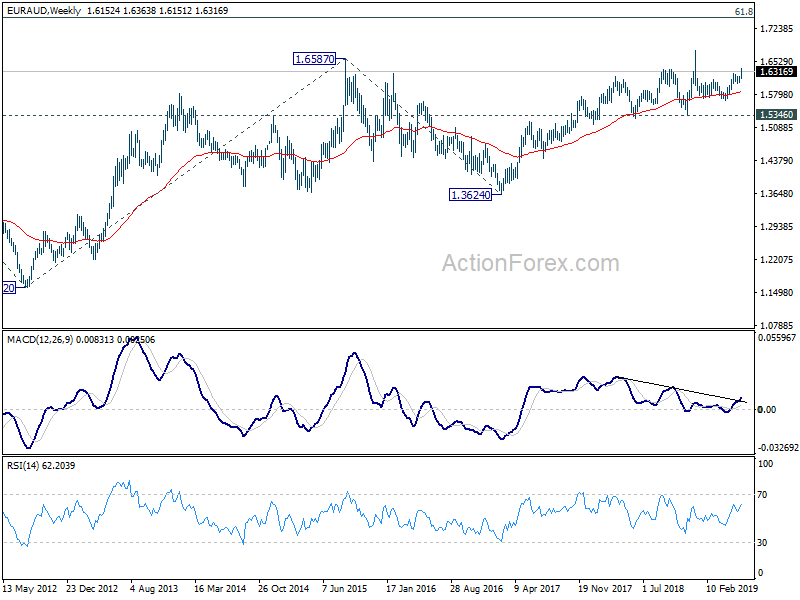
EUR/AUD's rise from 1.5683 resumed last week by breaking 1.6262 resistance. But as a temporary top was formed at 1.6363, initial bias is neutral this week for some consolidations first. Downside of retreat should be contained well above 1.6052 support to bring rise resumption. On the upside, break of 1.6363 will turn bias back to the upside for 61.8% projection of 1.5683 to 1.6262 from 1.6052 at 1.6410 first. Break will target 100% projection at 1.6631 next.
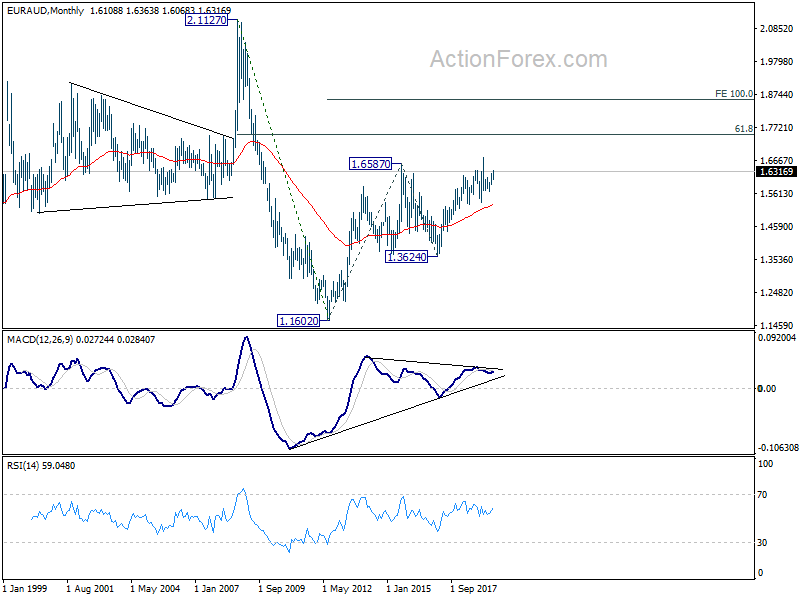
In the bigger picture, as long as 1.5346 support holds, outlook will still remain bullish. Up trend from 1.1602 (2012 low) is expected to resume sooner or later. Break of 1.6765 will target 61.8% retracement of 2.1127 (2008 high) to 1.1602 at 1.7488 next. However, firm break of 1.5346 key support will indicate trend reversal, with bearish divergence condition in weekly MACD, and turn outlook bearish.
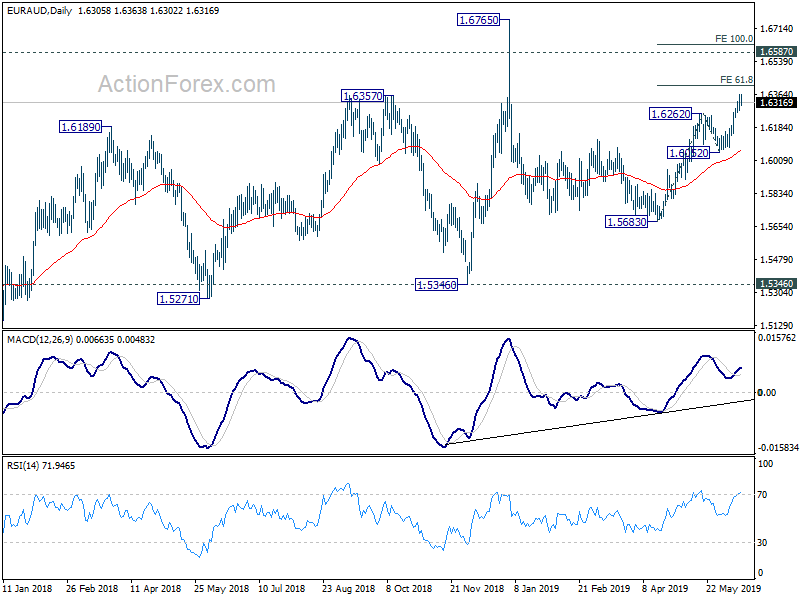
In the longer term picture, the rise from 1.1602 long term bottom (2012 low) is still in progress for 61.8% retracement of 2.1127 to 1.1602 at 1.7488. This will remain the favored case as long as 1.5346 remains intact.
EUR/CHF Weekly Outlook
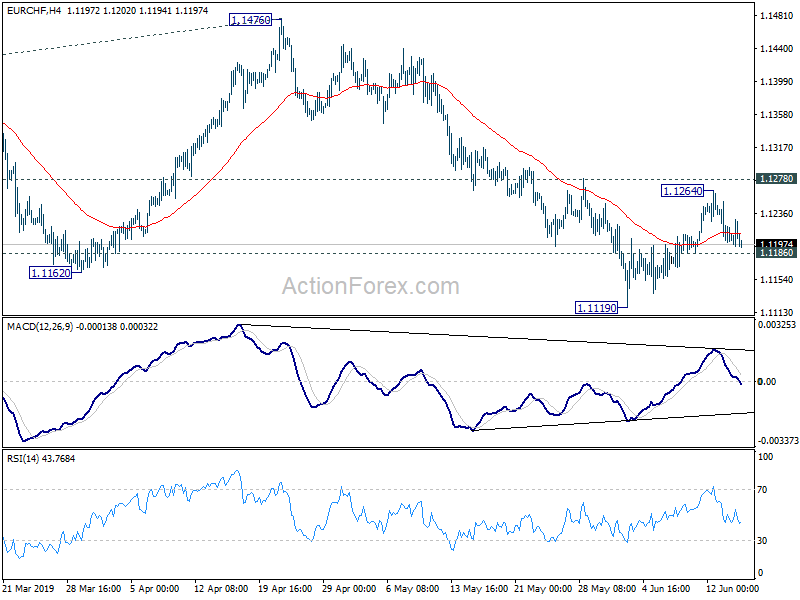
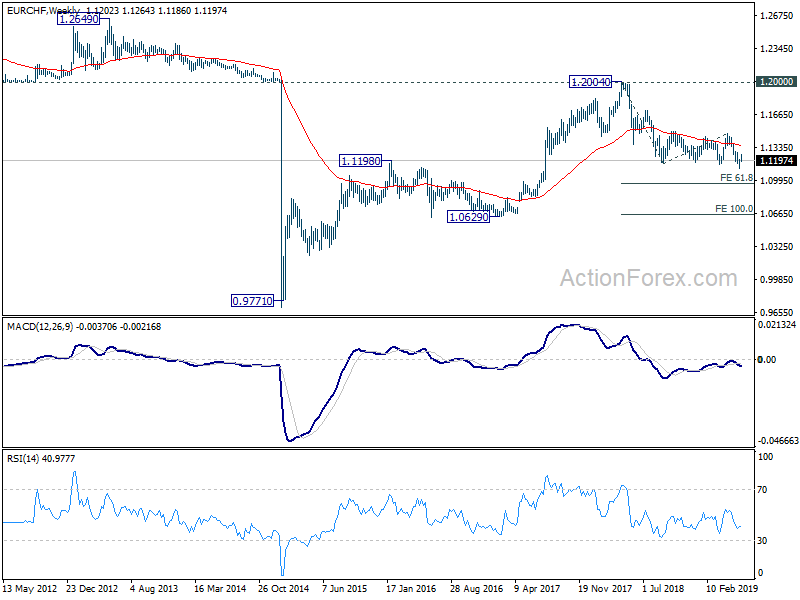
EUR/CHF's recovery from 1.1119 extended to 1.1264 last week but failed to break through 1.1278 resistance as expected. Initial bias is neutral this week first and some more consolidations could be seen. On the downside, break of 1.1186 minor support will turn intraday bias back to the downside for 1.1119 first. Break there will extend recent down trend to 61.8% projection of 1.2004 to 1.1173 from 1.1476 at 1.0962 next limited.
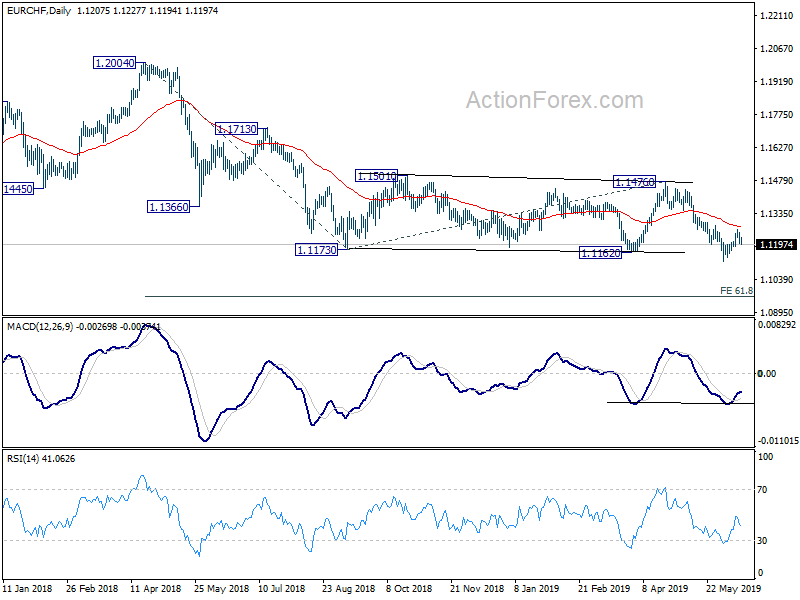
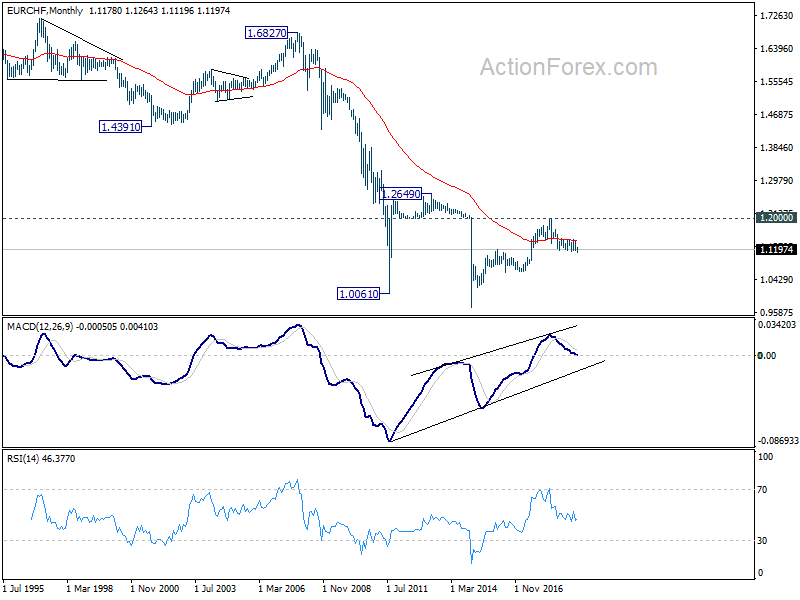
In the bigger picture, current development firstly suggests that down trend from 1.2004 is still in progress. More importantly, it's likely a long term down trend itself, rather than a correction. Outlook will remain bearish as long as 1.1476 resistance holds. EUR/CHF could target 1.0629 support and below.
Dollar Rebounded Strongly as Focus Turns to FOMC Meeting
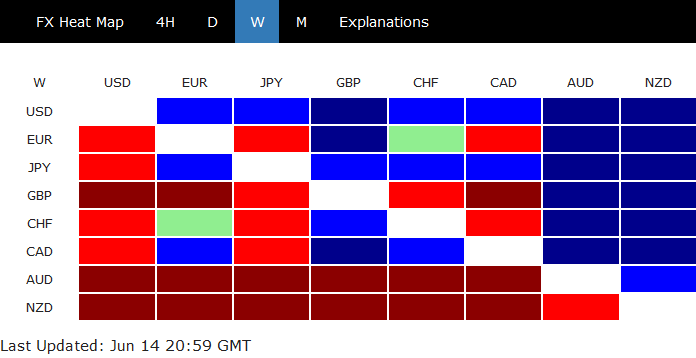
Dollar ended as the strongest one last week as economic data from the US affirmed that Fed is in no rush to deliver the "insurance" rate cut this month, that is, on June 19. Yen was the second strongest as US and German treasury yields stays pressured. Canadian Dollar was the third strongest, lifted by mainly by expectations that BoC is not nearing a rate cut. On the other hand, New Zealand and Australian Dollars were the weakest ones as poor data affirmed the path of monetary easing. Poor data from China also revealed ongoing downward pressure in the economy.
Dollar and Yen look set to resume recent rally after Friday's strong surge. Technically, EUR/USD and EUR/JPY should have completed recent recovery from 1.1107 and 120.78. Retests of these two lows should be seen soon. Similarly, GBP/USD should be heading back to 1.2259 support. GBP/JPY has indeed breached equivalent support at 136.55 already, indicating fall resumption. AUD/USD also breached 0.6864 support on Friday, suggesting falling resumption. AUD/JPY took the lead and broke 74.96 support on Thursday already and extended decline to close near to weekly low.
Markets expecting FOMC to hold on June 19
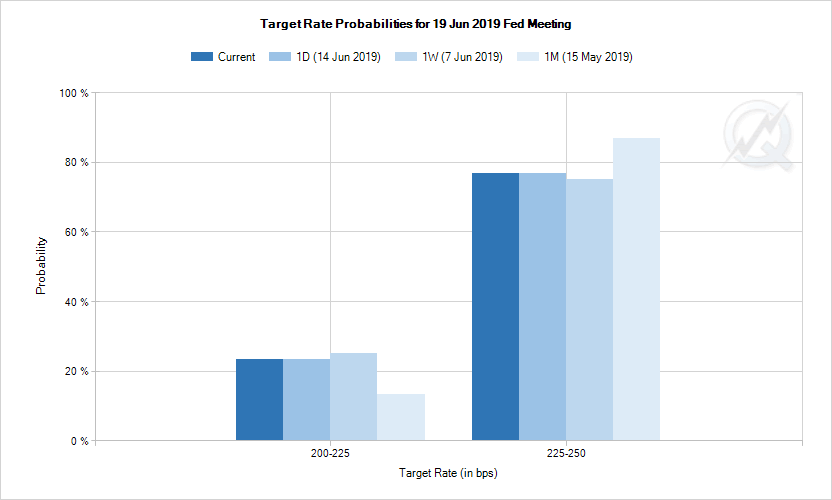
Nevertheless, Dollar's fate could very much depends on FOMC rate decision this week, and new economic projections. For now, fed funds futures are pricing in only 23.3% chance of a rate cut. Tariffs on Mexico were averted with the migration deal. Retail sales suggested solid growth in consumption. Core CPI slowed from 2.1% yoy to 2.0% yoy in May. But that was not a disastrous reading.
While there were talks of increasing downside risks to the US outlook, those are still unmaterialized risks only. There is no imminent need for a rate cut for now. Also, bear in mind that there is an upcoming G20 summit in Osaka, Japan on June 28-29, which is 10 days from FOMC announcement. No one can really predict if there will be a Trump-Xi meeting there, not to mention the results. Thus, it's more sensible for Fed officials to hold the bullets for now.
Fed statement and projection have to confirm on July rate cut
Market pricing of 87.5% chance of a July rate cut remains high. Apparently, such pricing are based on expectation of further escalation in US-China trade war. That is, markets are expecting imposition 25% tariffs on essentially all untaxed Chinese imports. The result of the G20 summit is just one variable.
Even if no agreement is reached to resume negotiations, Trump has a choice to listen to the voice of his own people and refrain from imposing more tariffs on China. In an open letter to Trump, 661 US Companies and Associations urged the administration to avoid tariff escalation with China. It's led by "Tariffs Hurt the Heartland" campaign, signed by 520 companies and 141 trade associations. But then, Trump could continue to ignore such voices.
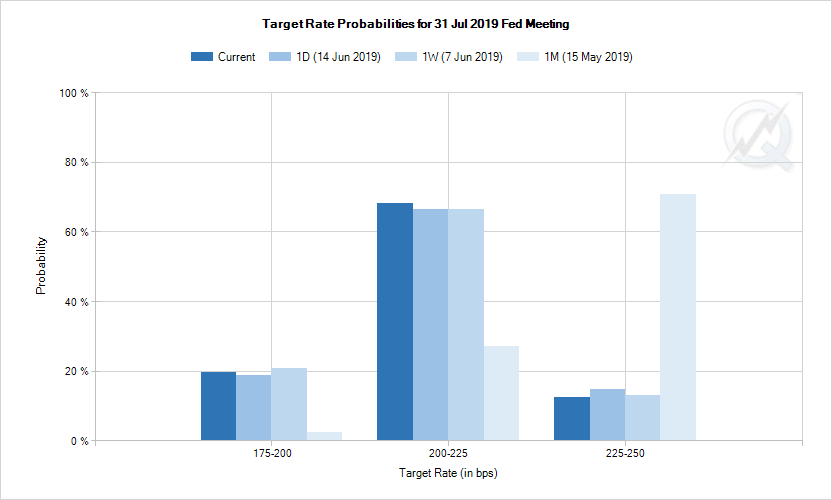
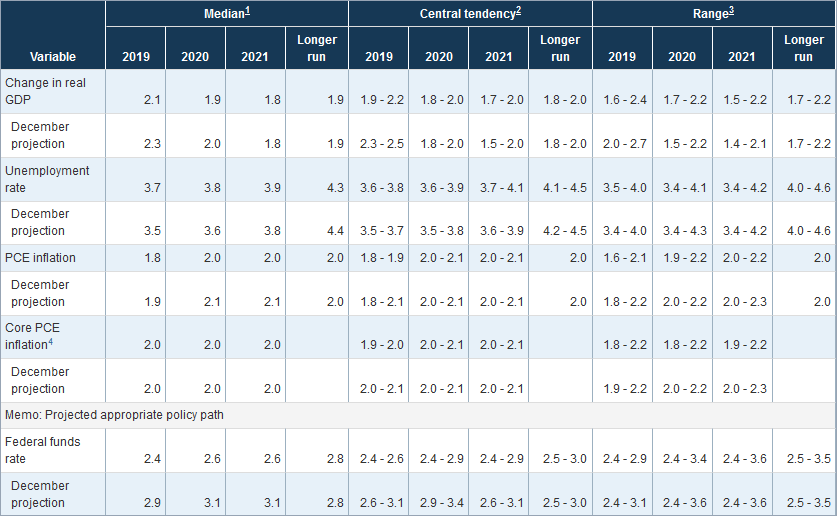
Fed's base case, however, would likely be based on the assumption of no further trade war escalations. That is, the statement and Chairman Jerome Powell's press conference might indicate the willingness to "adjust" interest rates. But the unpredictable uncertainty of trade war shouldn't be reflected in the economic projections.
Back in March, 2019 median projections were for GDP growth to be at 2.1%, unemployment rate at 3.8%, core PCE inflation at 2.0%. The core PCE inflation forecast is particularly important to show how confident Fed is on inflation outlook. On the federal funds rate, median projections is 2.4% for 2019, that is no chance from current 2.25-2.50%.
If Fed turns notably dovish in the forecasts, it's really rather dovish. If not, the "openness" to cut is just "willingness" but not "indication". That is, the statement and projections have to confirm each other on the chance of July cut. We'll see.
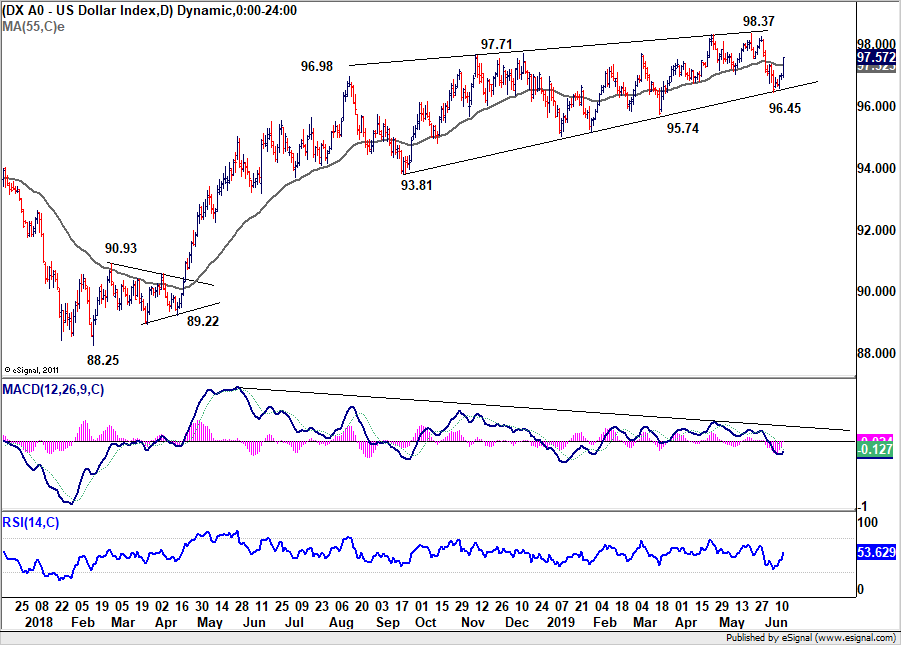
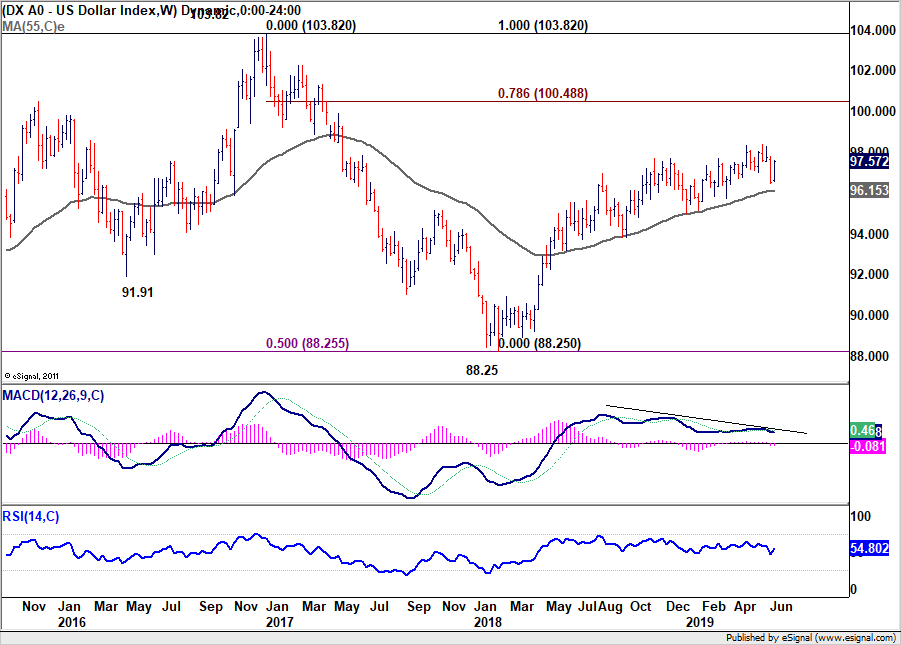
Dollar index staged strong rebound, 98.37 not the medium term top yet
Dollar index's strong rebound last week indicates strong support from trend line. It's also held well above 55 week EMA. Both developments invalidate our original view of medium term topping at 98.37. Further rise is now mildly in favor back to retest 98.37. Nevertheless, upside momentum remain rather unconvincing as seen in daily and weekly MACD. Even if 98.37 might be breached, we don't expect sustain trading above there for the moment. On the other hand, break of 96.45 support will revive the case of medium term topping at 98.37 and turn outlook bearish for 95.4 next.
Rebound due in 10-year yield, which might help Dollar
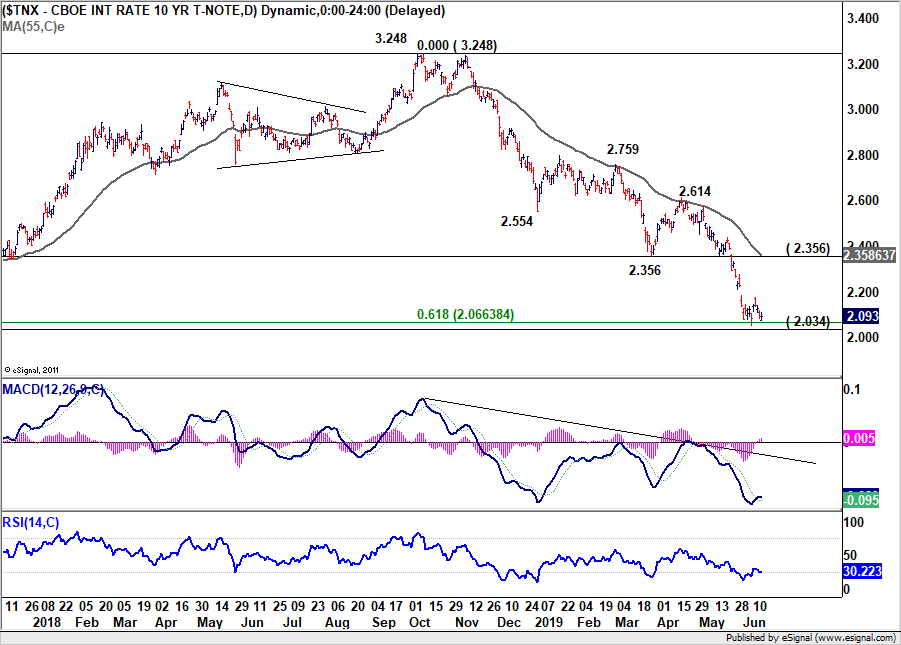
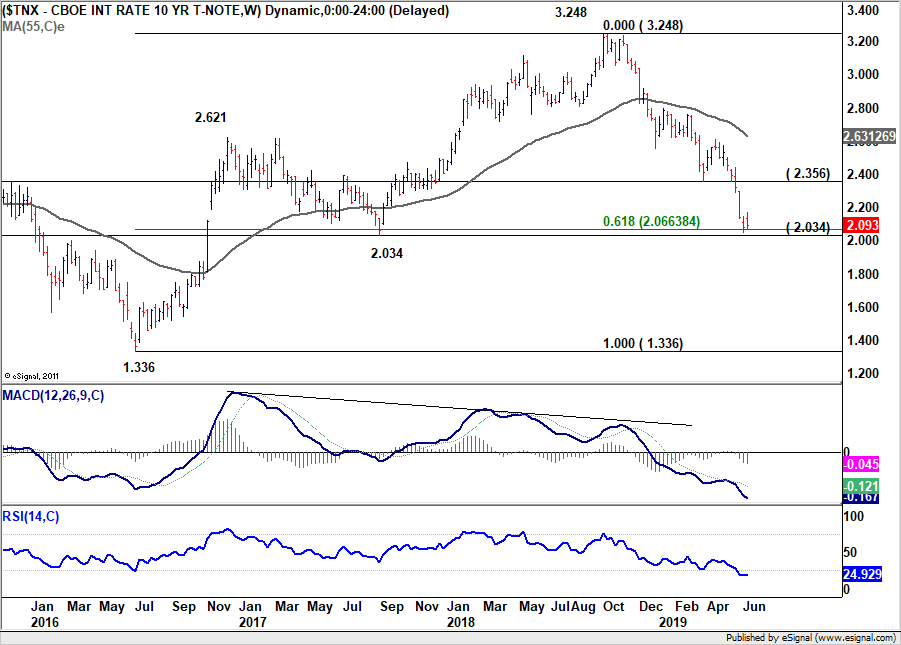
10-year yield had a rather weak recovery last week but quickly retreated. Nevertheless, downside momentum has been diminishing with daily MACD crossed above signal line. Also, it's now close to 2.034 and 61.8% retracement of 1.336 to 3.248 at 2.066. We do not expect firm break of this support zone, at least with the current attempt. Thus, even if another fall might be seen, downside should be limited. Break of last week's high at 2.174 would indicate short term bottoming and bring rebound back towards 2.356 key resistance. Such development would help rally in Dollar, in particular USD/JPY.
AUD/USD Weekly Outlook
AUD/USD's decline last week suggested that corrective recovery from 0.6864 has completed 0.7022, after rejection by 55 day EMA. Late breach of 0.6864 support argues that fall from 0.7295 is resuming. Initial bias stays on the downside this week. Sustained trading below 0.6864 will pave the way to 0.6722 low. On the upside, break of 0.6918 will delay the bearish case and turn intraday bias neutral first.
In the bigger picture, with 0.7393 key resistance intact, medium term outlook remains bearish. The decline from 0.8135 (2018 high) is seen as resuming long term down trend from 1.1079 (2011 high). Decisive break of 0.6826 (2016 low) will confirm this bearish view and resume the down trend to 0.6008 (2008 low). However, firm break of 0.7393 will argue that fall from 0.8135 has completed. And corrective pattern from 0.6826 has started the third leg, targeting 0.8135 again.
In the longer term picture, prior rejection by 55 month EMA maintained long term bearishness in AUD/USD. That is, down trend from 1.1079 (2011 high) is still in progress. Sustained break of 0.6826 will target 0.6008 low and then 61.8% projection of 1.1079 to 0.6826 from 0.8135 at 0.5507.
Summary 6/17 – 6/21
Monday, Jun 17, 2019
[php_everywhere instance="1"]
Tuesday, Jun 18, 2019
[php_everywhere instance="2"]
Wednesday, Jun 19, 2019
[php_everywhere instance="3"]
Thursday, Jun 20, 2019
[php_everywhere instance="4"]
Friday, Jun 21, 2019
[php_everywhere instance="5"]
Weekly Economic and Financial Commentary: Inflation Continues to Come in Below Expectations
U.S. Review
Inflation Continues to Come in Below Expectations
- The Producer Price Index, Import Price Index and the Consumer Price Index came in slightly below expectations this week, which provides the Fed cover to ease if it feels it needs to.
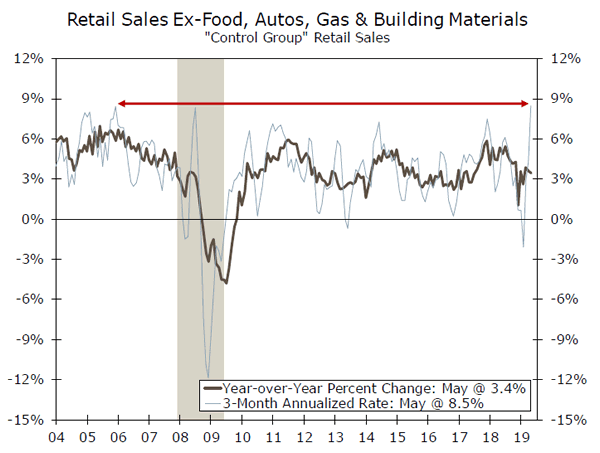
- Retail sales bounced back in May, with the headline index climbing 0.5% and the core control group category, rising 0.5%. Motor vehicle dealer sales rose 0.7%.
- Industrial production rebounded 0.4% in May, following a revised 0.4% drop the prior month.
- The early June read on Consumer Sentiment fell 2.1 points to 97.9, likely reflecting concerns about possible Mexican tariffs.
The Economy Has a Real Good Poker Face
The Fed is likely having a hard time reading the economy's strength and momentum. Taken at face value, last Friday's weaker employment report, which showed a net gain of just 75,000 jobs in May and revised down the two previous months' gains 75,000 jobs, suggests employers have become more cautious about adding workers. May's smaller than expected gain might simply be a bluff, however, particularly as it followed such large gains in April.
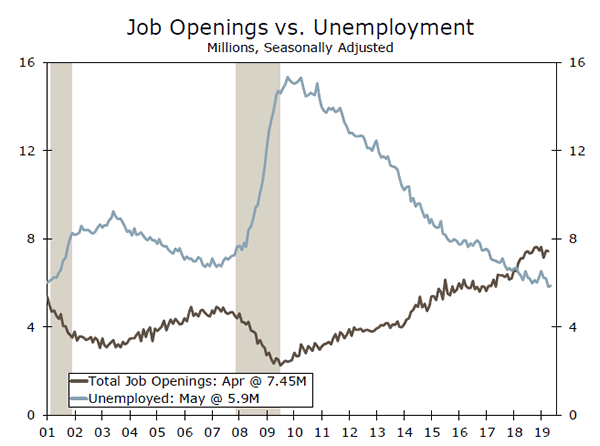
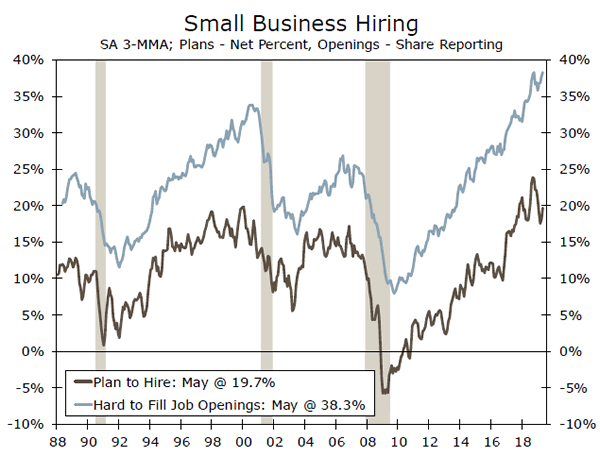
Most other employment indicators continue to show a great deal of strength, including the latest JOLTS data and the weekly initial unemployment claims, which rose this past week but remain near historic lows. The JOLTS survey noted that hires rose slightly to 5.9 million in April, while separations were essentially unchanged at 5.6 million. There were 7.5 million job openings, against just 5.8 million unemployed, marking the 14th month in a row job openings exceeded the number of unemployed. The latest NFIB Survey showed the share of small businesses that tried to hire workers the past three months rose five points to 62% in May. Of those hiring, 54% reported few or no qualified applicants.
This past month's inflation data also suggest the Fed is holding some pretty good cards. All three of the price indices released this week showed prices rising slightly less than consensus estimates. Once again, extenuating circumstances could prove that the lower inflation data are nothing more than a feint.
The headline Producer Price Index (PPI) rose just 0.1% in May, while prices excluding food and energy products, rose 0.2%. Year-over-year changes in both series moderated slightly, with the headline index sliding 0.4 percentage points to 1.8% and core PPI inflation falling 0.1 percentage point to 2.3%. While good news, the PPI has not provided all that much insight into inflationary trends.
The CPI came in better than expected, with both the headline and core price measures rising just 0.1%. Falling gasoline prices helped hold down the headline measure, while another large drop in used car prices helped contain the core CPI. Residential rent also moderated, following some larger increases in prior months. Excluding the drop in used car prices, which should prove transitory, the core CPI would be close to 2% year-over-year.
As for the impact of tariffs, it is hard to see in the import data. Import prices fell 0.3% in May, on an overall basis and excluding petroleum products. On a year-over-year basis import prices are down 1.5%. While tariffs are not directly reflected in import prices, the continued slide adds credence to reports that Chinese suppliers have been absorbing much of the tariff so far. Retaliatory tariffs and slower global economic growth might also explain the larger drop in export prices, which are now down 0.7% year-over-year.
Regardless of what cards remain to be dealt, the Fed is holding a pretty strong hand. The preponderance of employment data suggest the Fed is meeting its mandate of achieving maximum employment, while inflation is running below expectations. The Fed has room to ease pre-emptively to head off a more substantial pullback in domestic demand and untoward deceleration in inflation.
U.S. Outlook
Housing Starts • Tuesday
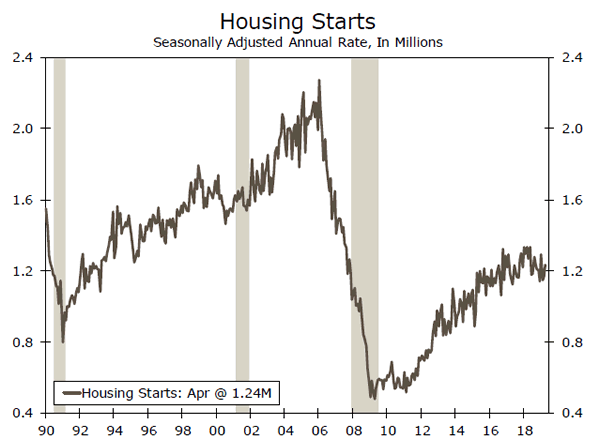
More favorable buying conditions and relatively lower building costs have led to strengthening new residential construction in recent months. Total housing starts jumped 5.7% during April, boosted by a sturdy 6.2% rise in single-family and a 4.7% increase in multifamily starts. That said, homebuilding continues to be sluggish so far this year. Total starts are running 7.2% below last year's level on a yearto- date basis.
Building permits rose a more modest 0.6% last month. The recent trend of number of permits issued running well ahead of actual starts is a sign that residential activity will remain fairly subdued in coming months. Residential building appears to have topped out in early 2018, which means year-over-year comparisons will get easier moving forward. Looking ahead, we expect residential construction to gradually march higher, but a surge in activity is unlikely.
Previous: 1.23M Wells Fargo: 1.237M Consensus: 1.240M
FOMC Rate Decision • Wednesday
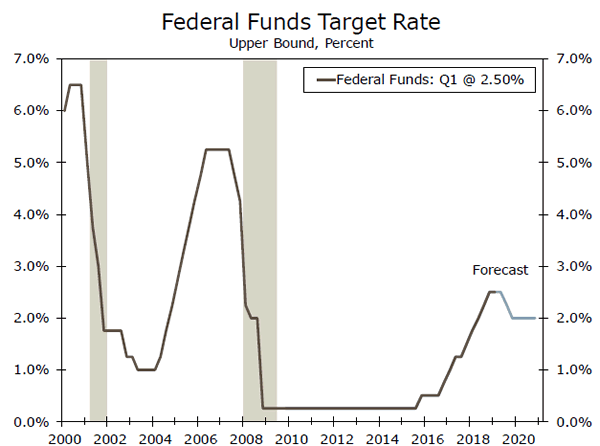
We expect Fed officials will vote to leave the target federal funds rate unchanged at the June 18-19 FOMC meeting. That noted, we do anticipate some forthcoming adjustments to monetary policy in the months ahead. We look for the Fed to trim rates 25 bps in Q3 and another 25 bps in Q4, likely at the July and October meetings.
Our view that the FOMC will move rates down 50 bps in total later this year comes amid tepid inflation and continued uncertainty surrounding trade policy, which appears to be indirectly slowing business investment and economic growth more broadly. Furthermore, with few inflationary pressures and only 225 bps of potential rate cuts as ammunition, the FOMC may deem it prudent to have an "insurance cut" to head off slower economic growth at the pass. We have also downgraded our real GDP forecast from 2.8% to 2.6% for 2019.
Previous: 2.50% Wells Fargo: 2.50% Consensus: 2.50%
Existing Home Sales • Friday
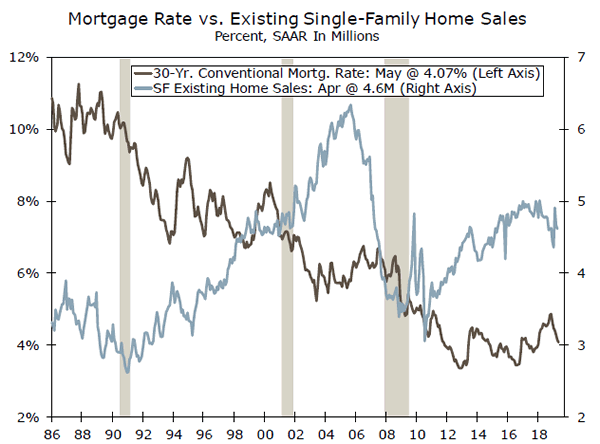
Improved buying conditions have helped to ameliorate the sharp pullback in resales but clearly not reversed it. During April, sales fell 0.4% to a 5.19 million unit pace. With the exception of February, existing home sales have declined on a monthly basis every month so far this year. The continuing mismatch between strengthening entry level demand and scarce entry level supply is playing an outsized role in the lethargic pace of sales this year.
Still, even at an underwhelming pace, sales should remain fairly solid. Home price appreciation continues to ease, which should help address the affordability issues currently plaguing the housing market. Mortgage rates also continue to track lower, which has led to an upturn in mortgage applications. More favorable buying conditions should support existing home sales and we expect modest gains in coming months.
Previous: 5.19M Wells Fargo: 5.33M Consensus: 5.30M
Global Review
Global Growth: Steady Start, Softer Finish
- This week saw confirmation that the global economy began 2019 on better footing. GDP for the G20 economies rose 0.8% quarter-over-quarter and held steady at 3.3% year-over-year. There are questions, however, as to whether solid growth can be sustained, both for the U.S. and internationally.
- U.K. April data were especially soft, with large drops in both GDP and manufacturing output. Eurozone industrial output also fell in April, while China's May economic data were mixed.
- Given signs of slowing activity, we forecast noticeably lower global GDP growth for 2019 of 3.2%, down from 3.6% growth seen in 2018.
Hopes for a Chinese Upturn Diminishing
This week's data offered the latest reading on the health of the Chinese economy. After some encouraging signs during the first quarter of 2019, growth appears to have softened a touch in Q2. May retail sales firmed to 8.6% year-over-over, a rebound from the sharply slower growth reported for April. However, May industrial output slowed to 5.0% year-over-year, the smallest gain since 2002, while fixed asset investment for the January-May period also slowed to 5.6% year-over-year.
The diffident nature of Chinese data is of some concern, especially considering the more recent escalation in trade tensions between China and the United States. For May, the 7.7% year-over-year gain in exports in local currency terms looks to us more like temporary relief than a sustained improvement. While Chinese authorities will no doubt continue to use monetary and fiscal policy tools to cushion the growth slowdown, our 2019 GDP growth of 6.1% would be well below the 6.6% gain registered in 2018.
U.K. Suffering Growth Hangover in Q2
After a solid start to the year, the U.K. economy has lost momentum heading into Q2. For April, GDP contracted 0.4% month-over-month, after a 0.1% fall in March. Services output was flat in April, but it was the manufacturing sector in particular where the weakness was concentrated. April industrial output declined 2.7% month-over-month, including a sharp 3.9% fall in manufacturing output. Reports suggested U.K. companies had built up inventories significantly ahead of the expected March Brexit deadline, and the sharp drop in April output is very much in line with that view.
Separately, the U.K. labor market was not particularly strong but not especially soft either. Average weekly earnings slowed to 3.1% year-over-year in the three months through April, while job growth also slowed, albeit by less than expected, with employment up 32,000 for February-April compared to the November-January period. Altogether, this week's data suggest a slowdown in U.K. Q2 GDP, which we currently forecast to contract 0.1% quarter-over-quarter.
The Latest from Latin America
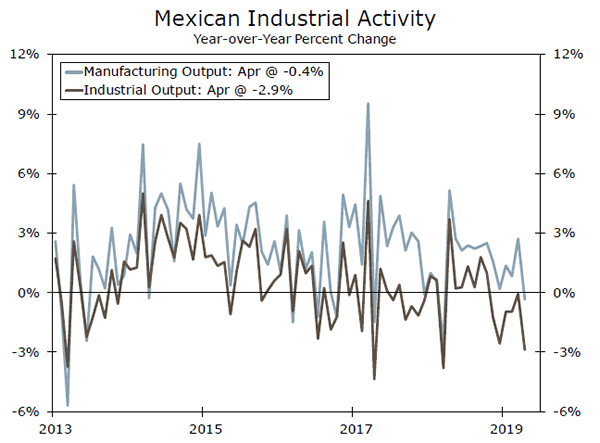
In Mexico, April industrial output rose 1.5% month-over-month, although that largely reversed a large March decline. Compared to April 2018, industrial output fell 2.9%, including a 0.4% fall in manufacturing output. The latter was the first fall in manufacturing output since March 2018, although base effects partly contributed to the fall. The figures suggest the suspension of U.S. tariffs on Mexico was something of a relief, with Mexico's industrial sector somewhat tentative even ahead of those proposed tariffs.
In Brazil, April economic figures were subdued, albeit less so than March. April retail sales returned to modestly positive territory with a 1.7% year-over-year gain, but with industrial output falling, April economic activity fell 0.6% year-over-year. Brazil's recovery remains gradual and unsteady, and we view it as too soon to confirm that a sustained upswing is underway.
Global Outlook
Bank of England Decision • Thursday
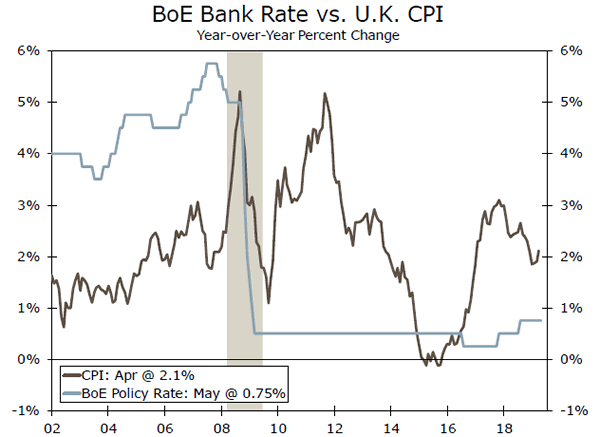
The Bank of England makes its latest monetary policy announcement next week and is widely expected to hold its Bank Rate steady at 0.75%. U.K. inflation has been relatively contained— the May CPI is also released next week and the core CPI is forecast to ease to 1.7% year-over-year, slightly below the midpoint of the central bank's inflation target. May retail sales are also due and are expected to fall 0.4% month-over-month. Combined with the reported drop in April GDP, the mix of slower economic growth, benign inflation and still unresolved Brexit uncertainties are likely to keep Bank of England policy on hold for an extended period.
In fact, given the persistent Brexit uncertainty and slowing U.K. growth, we have further pushed back our forecast timing for Bank of England rate hikes. We see no move this year, while in 2020 we expect the central bank to raise rates twice—in Q2 and Q4.
Previous: 0.75% Wells Fargo: 0.75% Consensus: 0.75%
Eurozone PMIs • Friday
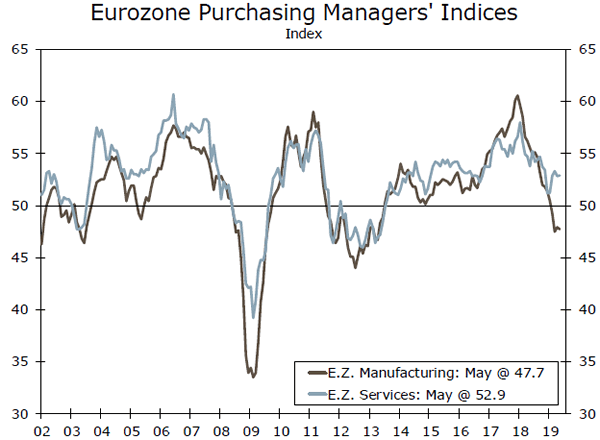
After Eurozone Q1 GDP grew a respectable 0.4% quarter-overquarter (a noticeable pickup from the pace during the second half of last year), concerns have persisted about the steadiness and sustainability of the economic expansion. April industrial output fell 0.5% month-over-month, a second straight decline, while in May the services PMI essentially held steady and the manufacturing PMI eased. With Eurozone core CPI inflation running at just 0.8% year-over-year, the European Central Bank has adjusted its forward guidance in a dovish direction, now signaling that interest rates will remain at their present level until at least mid-2020.
The Eurozone PMIs are closely monitored as a timely indicator on the health of the Eurozone economy. For June, the services PMI is expected to edge up to 53.0. The manufacturing PMI is also expected to rise to 47.9, though remaining in contraction territory for the fifth month in a row.
Previous: 47.7 (Manufacturing), 52.9 (Services) Consensus: 47.9 (Manufacturing), 53.0 (Services)
Canada Retail Sales • Friday
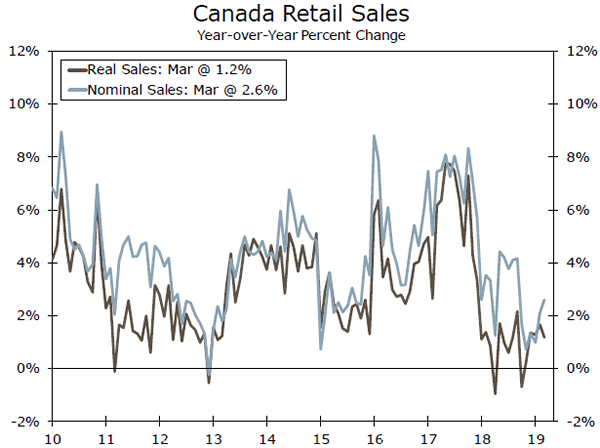
Canadian economic growth was especially soft to start the year, with GDP growing at an annualized 0.4% pace over the past two quarters. However, Q1 GDP included some encouraging details, most notably solid consumer and investment spending and final domestic demand. Monthly GDP also finished the first quarter on a solid note, with March GDP rising 0.5% month-over-month.
We view this soft growth patch as somewhat transitory, and see quarterly growth improving as 2019 progresses. With Canada's core CPI close to target, that pickup in growth is an important element of our Bank of Canada rate view. Should Canada's economy show more solid trends, that should be enough for the central bank to keep rates steady both this year and next. In this context, next week's April retail sales data should attract attention. The consensus forecast is for a 0.3% month-over-month sales gain, which would come after large February and March increases.
Previous: 1.1% (Month-over-Month) Consensus: 0.3% (Month-over-Month)
Point of View
Interest Rate Watch
Fifty bps of Easing in Our Forecast
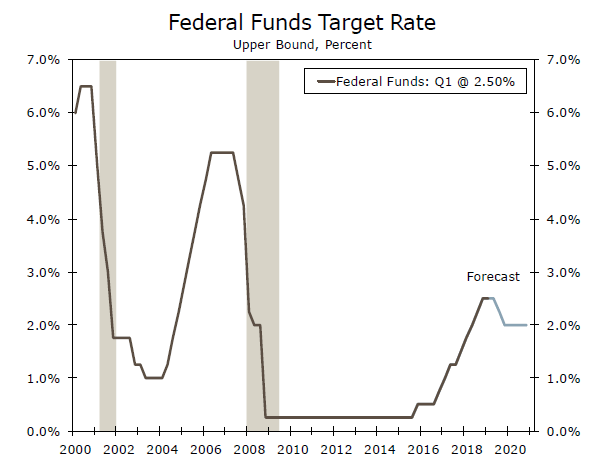
We recently changed our outlook for Fed policy to include two rate cuts in 2019 (see our Monthly Economic Outlook for details). Specifically, we now think it is likely that the Federal Open Market Committee (FOMC) will cut rates by 25 bps at its July 31 meeting and by another 25 bps in Q4, probably at the October 30 meeting (top chart).
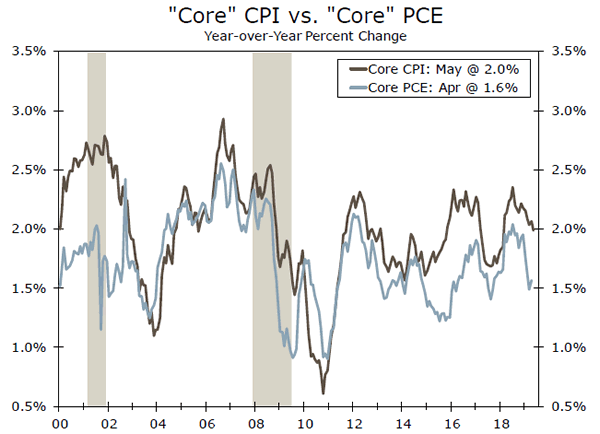
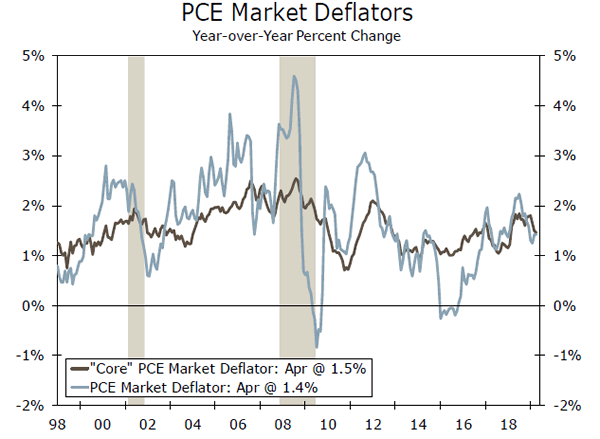
We base our revised Fed outlook largely on two considerations. First, the Fed has not had much success achieving its 2% inflation target recently. Indeed, the rate of PCE inflation, the FOMC's preferred measure of consumer price inflation, has generally fallen short of 2% in the last five to six years (middle chart). In an effort to show that its inflation target is "symmetric" and to raise inflation expectations, the FOMC may be willing to tolerate an inflation rate that exceeds 2% for a while. More accommodative monetary policy would help to achieve that objective. Second, the FOMC has only 225 bps of conventional "ammunition" at this time. Therefore, it may be prudent to undertake an "insurance" rate cut or two in coming months to head off any economic trouble before it materializes.
As we noted in our monthly report and its companion piece, our base case view of 50 bps of rate cuts depends crucially on the assumption we have made regarding trade policy. However, if the U.S and China agree to a trade deal and uncertainty dissipates, then the economic outlook would improve and the case for Fed easing at this time would be less compelling. On the other hand, a full-blown trade war between the world's two largest economies likely would lead to more than 50 bps of Fed easing.
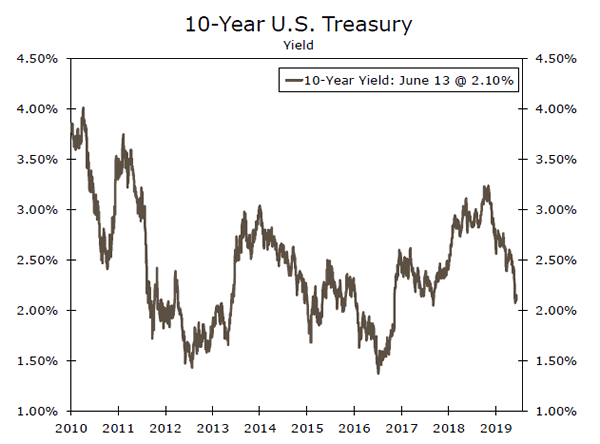
Pricing in the bond market suggests that market participants expect the FOMC will slash rates 75 bps by early next year. Therefore, we have less easing in our forecast than currently priced into markets. Consequently, we forecast that yields on longer-dated Treasury securities will rise modestly in coming months. For example, we look for the yield on the 10-year Treasury note, which has receded from 2.60% in mid- April to around 2.10% at present (bottom chart) will drift up to 2.30% by year-end. Stay tuned.
Credit Market Insights
Falling Consumer Inflation Expectations Support Case for Rate Cuts
Consumer inflation expectations continue to fall, reaching the lowest level since late 2017 in May, according to the New York Fed's Survey of Consumer Expectations. Other responses point to the broad-based strength in the labor market, with 2.5% earnings growth expected over the next year as the unemployment rate holds at a 50-year low of 3.6%. The reported probability of being able to find a new job if one's current job were lost rose to a record high since the question was first asked in 2013. Yet the survey responses regarding expectations of future prices add to the growing concerns over the downward drift in inflationary pressure.
Indeed, market-implied average inflation rates over the next five years have fallen around 20 bps since the end of April, while realized inflation has persistently undershot the Fed's 2% target, and by an increasing margin of late. As noted in the column to the left, we see the Fed's desire to boost inflation and inflation expectations as a major justification to ease, notwithstanding any trade-related uncertainty. In Powell's last public comments before the June FOMC meeting blackout period, he stated the Fed must "take seriously the risk that inflation shortfalls that persist even in a robust economy could precipitate a difficult-toarrest downward drift in inflation expectations." The latest survey data point to this being the case and support our view that the Fed will cut rates 25 bps in July.
Topic of the Week
Will "Insurance" Cuts Solve Inflation's Shortfall?
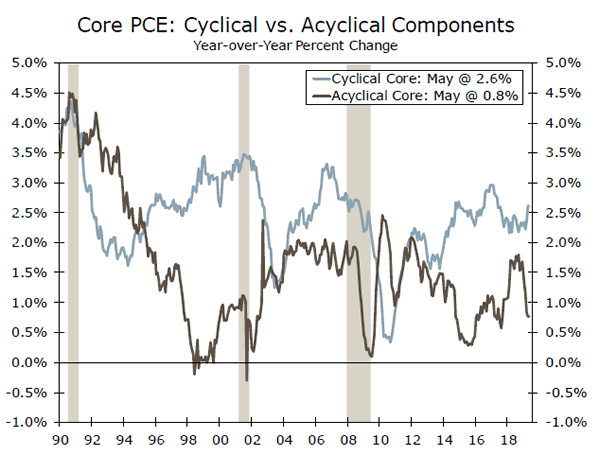
As we discussed in our Interest Rate Watch on the previous page, we now expect the FOMC to cut the fed funds rate by 50 bps in the second half of this year, partly for "insurance" reasons but also in an effort to shore-up inflation. Core PCE inflation briefly brushed the FOMC's 2% target a few months last year, but has subsequently fallen back to 1.6%—the average of the current cycle.
More accommodative policy would help support growth and hiring, putting pressure on remaining resource capacity in the economy and leading firms to raise prices. That would help drive inflation in cyclically sensitive categories higher, all else equal, and help to chip away at core inflation's current shortfall.
Slack is not the only driver of inflation, however, and is a relatively small one at that. Inflation expectations bear significantly greater explanatory power in models of inflation, while secular trends in technology, globalization and public policy are also influential.
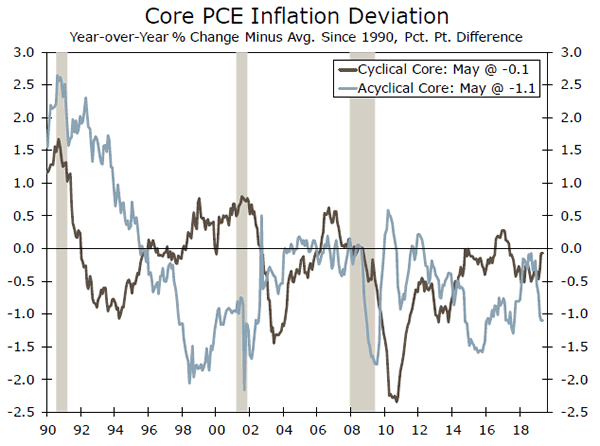
At issue for the FOMC is that slack is the part of the inflation equation that the committee can influence in the short term. Prices in acyclical inflation categories have been running lower than cyclical areas in recent years, and are materially weaker compared to historic trends (top chart). Relative to each category's average since 1990 (how far back you need to go for total core inflation to average 2.0%), cyclical inflation is just a tick below its historic average (bottom chart). Most of the shortfall from the Fed's 2% target can be traced to acyclical categories, which is more than a full percentage point below its long-run trend.
On net, we would expect Fed easing in the coming months to support higher inflation by driving the cyclicallysensitive areas of inflation higher. Yet, with acyclical categories responsible for the bulk of the undershoot, rate cuts are unlikely to solve inflation's persistent shortfall on their own. We look for core inflation to continue to run below 2% through the second half of the year, even as the Fed likely provides some additional policy support. Please see our special report.