Sample Category Title
GOLD Price And Crude Oil Price Facing Uphill Task
Gold price started a downside correction after it climbed towards the $1,360 resistance area. Crude oil price seems to be forming a breakout pattern and is preparing for the next break.
Important Takeaways for Gold and Oil
- Gold price started a downside correction after trading as high as $1,258 against the US Dollar.
- There was a break below a key bullish trend line with support at $1,342 on the hourly chart of gold.
- Crude oil price recovered recently and traded above the $52.00 resistance area.
- There is a major contracting triangle forming with resistance near $53.00 on the hourly chart of XTI/USD.
Gold Price Technical Analysis
Gold price found support near the $1,320 level and climbed above the $1,340 resistance area against the US Dollar. The price even broke the key $1,350 resistance area to climb further higher.
The upward move was strong as the price traded close to the $1,360 level. A swing high was formed near $1,358 on FXOpen before the price started a major downside correction.
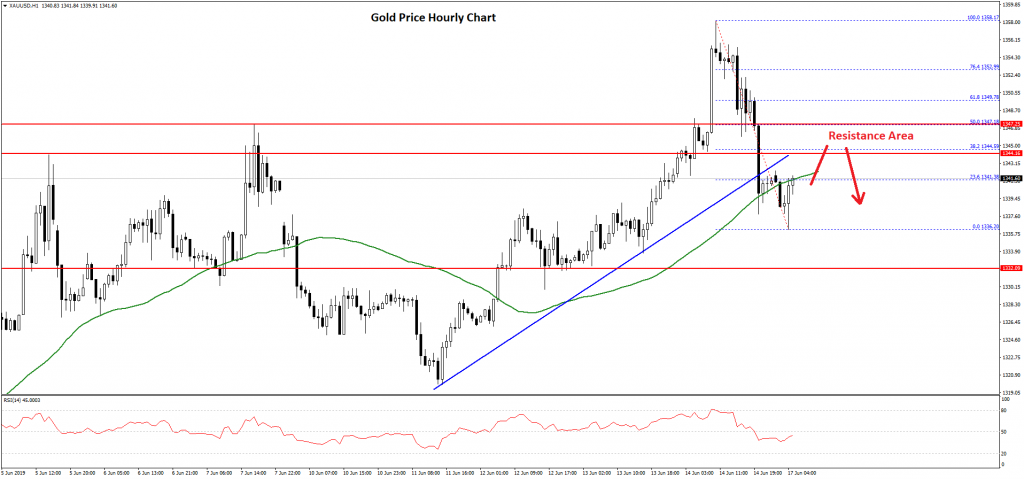
It broke the $1,355 and $1,350 support levels to move into a short term bearish zone. Moreover, there was a break below a key bullish trend line with support at $1,342 on the hourly chart of gold.
Finally, the price spiked below the $1,340 level and the 50 hourly simple moving average. A swing low was formed at $1,336 and the price is currently recovering higher.
It is trading near the $1,342 level, the 50 hourly simple moving average, and the 23.6% Fib retracement level of the recent decline from the $1,358 high to $1,336 swing low.
On the upside, there are many hurdles near the $1,344 and $1,347 levels. The main resistance is near the $1,347 level plus the 50% Fib retracement level of the recent decline from the $1,358 high to $1,336 swing low.
A successful close above the $1,347 and $1,348 levels might start a fresh increase towards the $1,355 and $1,360 resistance levels. Conversely, if the price fails to climb above $1,344 and $1,347, it could decline again below $1,340 and $1,335.
Oil Price Technical Analysis
After a steady decline, crude oil price found support near the $51.00 level against the US Dollar. The price started a slow and steady rise above the $5,120 and $51.50 resistance levels.
The price even managed to recover above the $52.00 barrier and the 50 hourly simple moving average. The recent swing high was formed at $53.21 before the price corrected lower.
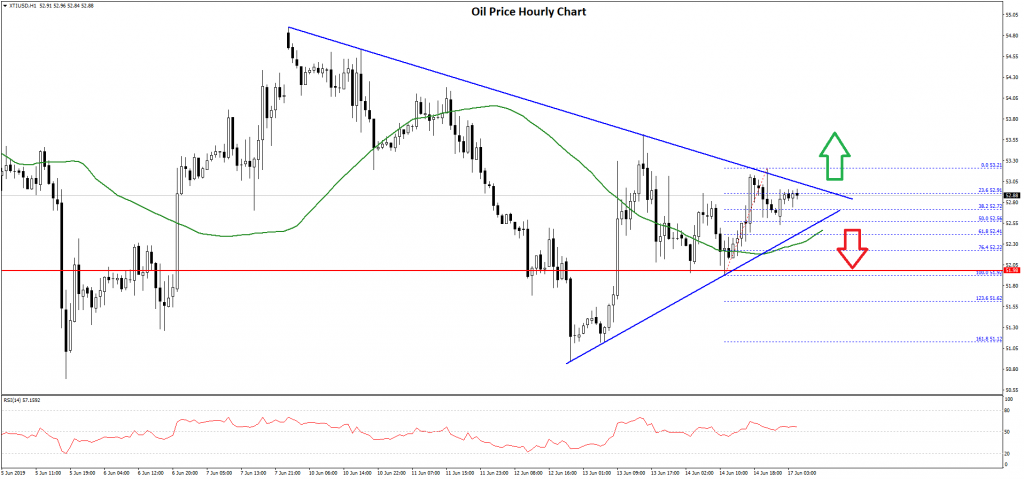
It traded below the $53.00 level and the 23.6% Fib retracement level of the recent wave from the $51.92 low to $53.21 high.
However, the decline was protected by the $52.50 level plus the 50% Fib retracement level of the recent wave from the $51.92 low to $53.21 high. The price is now moving higher and is trading near the $52.90 and $53.00 resistance levels.
Moreover, there is a major contracting triangle forming with resistance near $53.00 on the hourly chart of XTI/USD. If there is an upside break above the $53.00 barrier, the price could continue higher towards $53.20 and $53.50.
On the downside, the main support is near the $52.40 level, below which crude oil price might start a fresh decline below the $52.00 support area.
EUR/USD Retreats From Highs, Can It Bounce Back?
Key Highlights
- The Euro failed to gain momentum above 1.1350 and trimmed most gains against the US Dollar.
- EUR/USD traded below a connecting bullish trend line with support near 1.1280 on the 4-hours chart.
- The US Industrial Production in May 2019 increased 0.4% (MoM), more than the +0.2% forecast.
- The NY Empire State Manufacturing Index in June 2019 could decline from 17.80 to 12.75.
EURUSD Technical Analysis
The Euro traded close to the 1.1350 resistance area against the US Dollar. However, the EUR/USD pair failed to remain in the positive zone and started a major drop below the 1.1300 level.
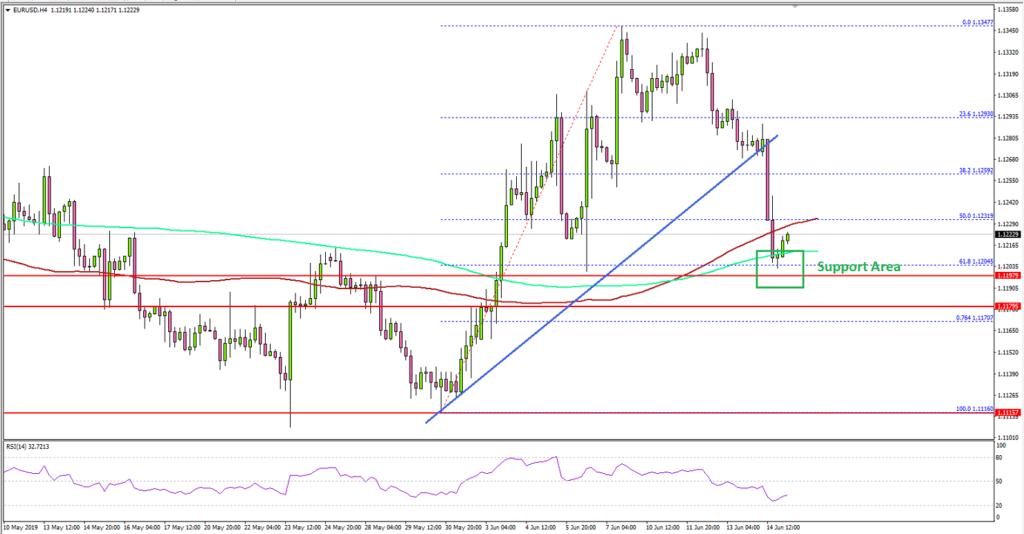
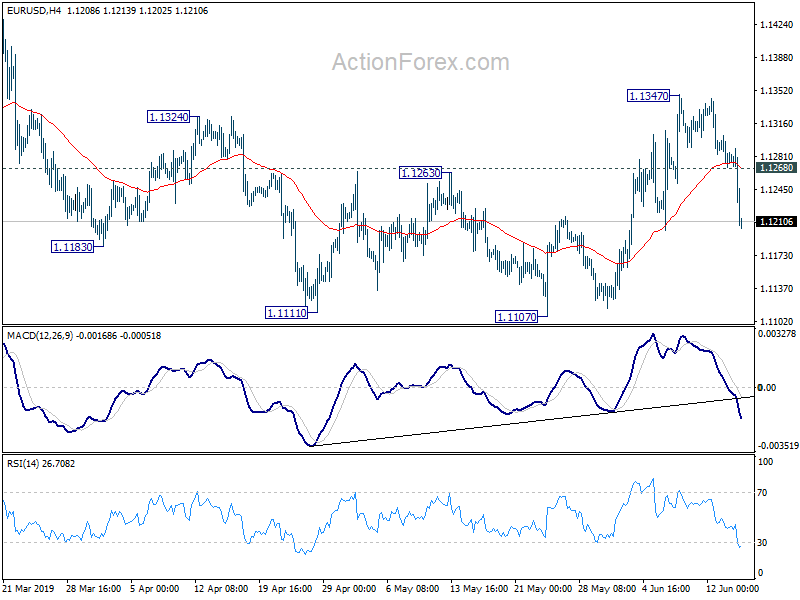
Looking at the 4-hours chart, the pair topped near 1.1347 and declined below the 50% Fib retracement level of the upward move from the 1.1116 swing low to 1.13487 high.
Moreover, the pair traded below a connecting bullish trend line with support near 1.1280 on the same chart. The pair even broke the 1.1250 support level and the 100 simple moving average (red, 4-hours).
It tested the 1.1200 support area and the 61.8% Fib retracement level of the upward move from the 1.1116 swing low to 1.13487 high. If the pair settles below 1.1200, there are chances of a sharp decline below the 1.1180 and 1.1170 support levels.
The next key supports are near 1.1150 and 1.1140. Conversely, if the pair stays above 1.1200, it could consolidate in the short term before a fresh increase.
An initial resistance is near the 1.1240 level. If there is a successful close above 1.1250 plus the 100 simple moving average (red, 4-hours), then the pair will most likely revisit the 1.1300 level.
Fundamentally, the US Industrial Production report for May 2019 was released by the Board of Governors of the Federal Reserve. The market was looking for a 0.2% rise in May 2019, compared with the previous month.
The actual result was above the market forecast, as there was a 0.4% rise in the US Industrial Production. Moreover, the last reading was revised up from -0.5% to -0.4%.
The report stated that:
The indexes for manufacturing and mining gained 0.2 percent and 0.1 percent, respectively, in May; the index for utilities climbed 2.1 percent. At 109.6 percent of its 2012 average, total industrial production was 2.0 percent higher in May than it was a year earlier.
Overall, EUR/USD is trading near the key 1.1200 support area. It could either start a fresh increase or decline further towards 1.1150 in the near term.
Economic Releases to Watch Today
- NY Empire State Manufacturing Index June 2019 – Forecast 12.75, versus 17.80 previous.
- NAHB Housing Market Index June 2019 – Forecast 66, versus 66 previous.
CFTC Commitments of Traders – Bets on USD Futures Trimmed Further Ahead of FOMC Meeting
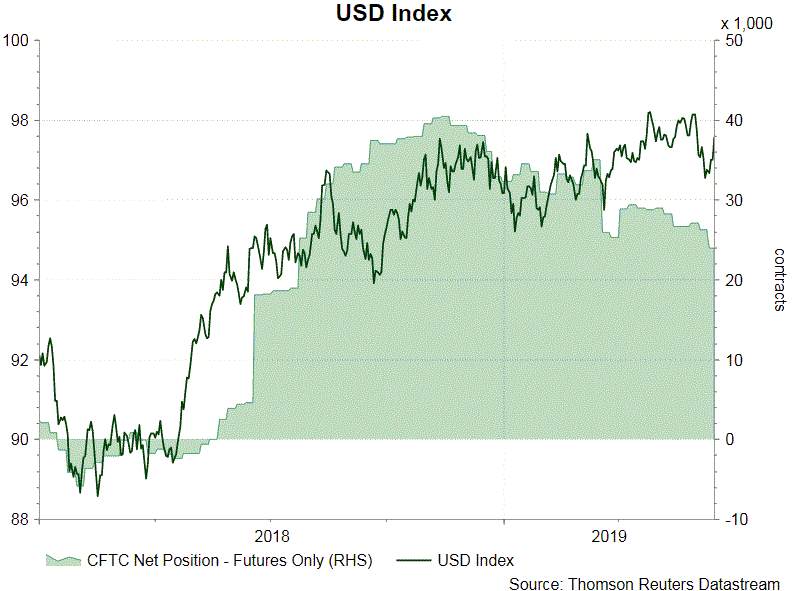
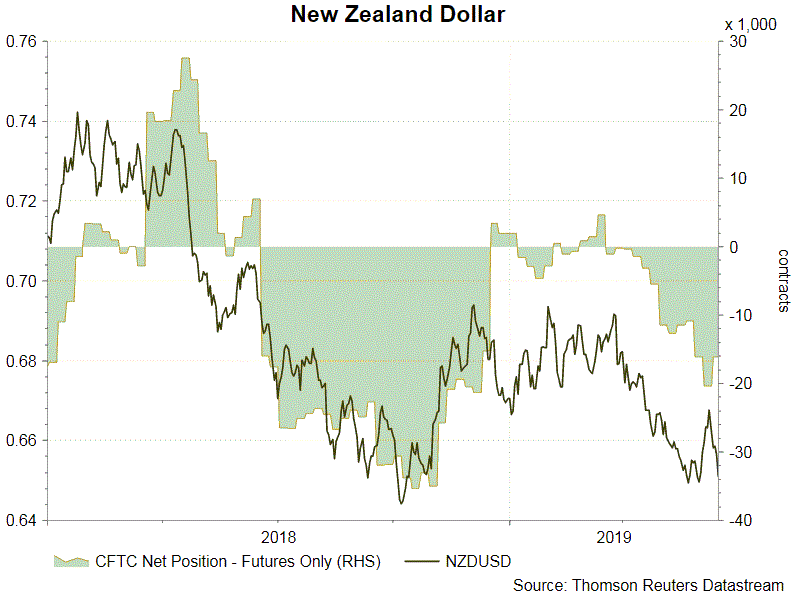
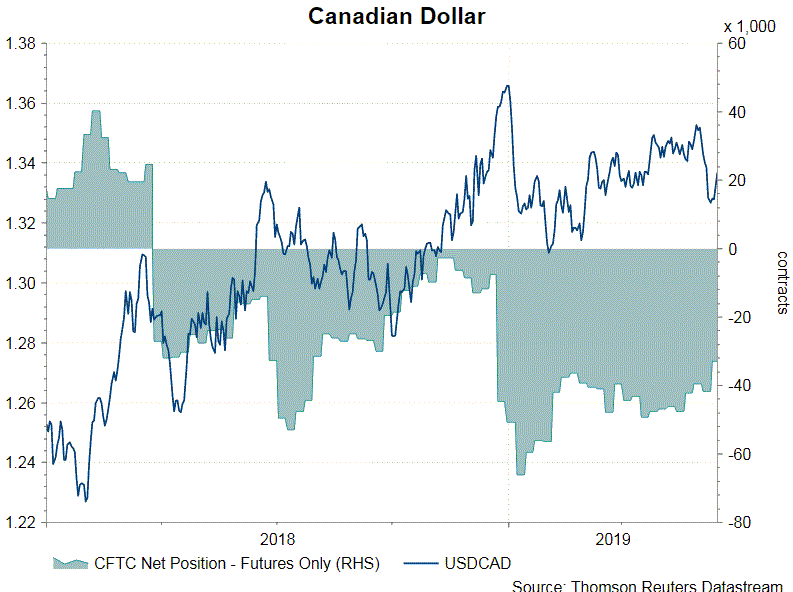
The CFTC Commitments of Traders report in the week ended June 11 suggests that bets for US dollar continued to fall on both long and short sides. NET LENGTH in USD Index dropped -2 245 contracts to 23 989. Both speculative long and short positions decreased during the week. Traders continued to trim their bets on USD as they awaited the FOMC meeting scheduled later this week (June 19). Although the Fed would likely keep its powder dry this week, it would likely send a more dovish message about the economic outlook. Rate cut later this year is almost fully priced in. All other major currencies stayed in NET SHORT positions.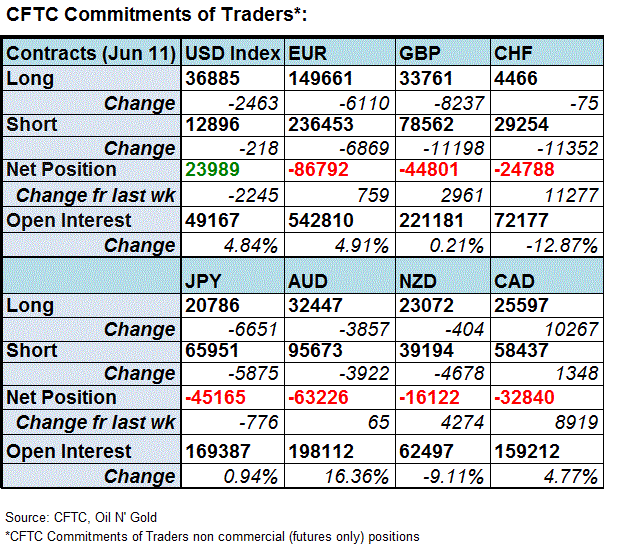
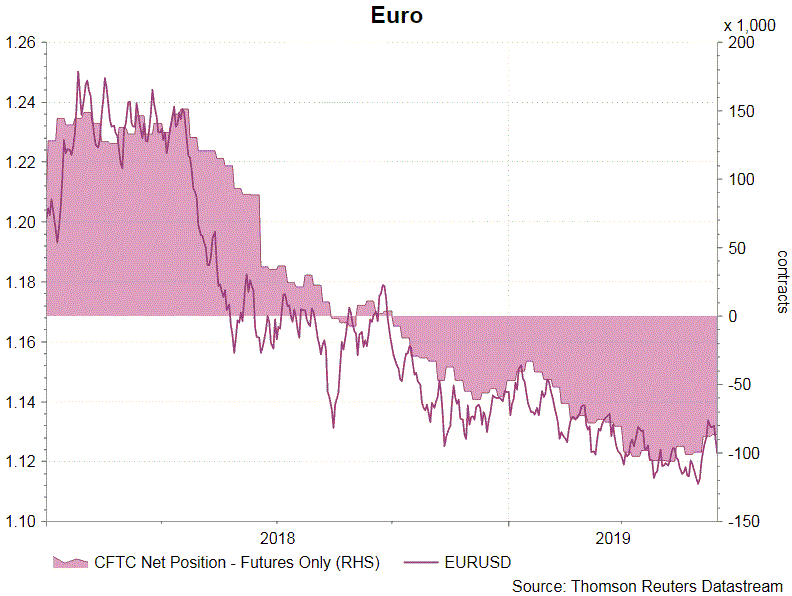
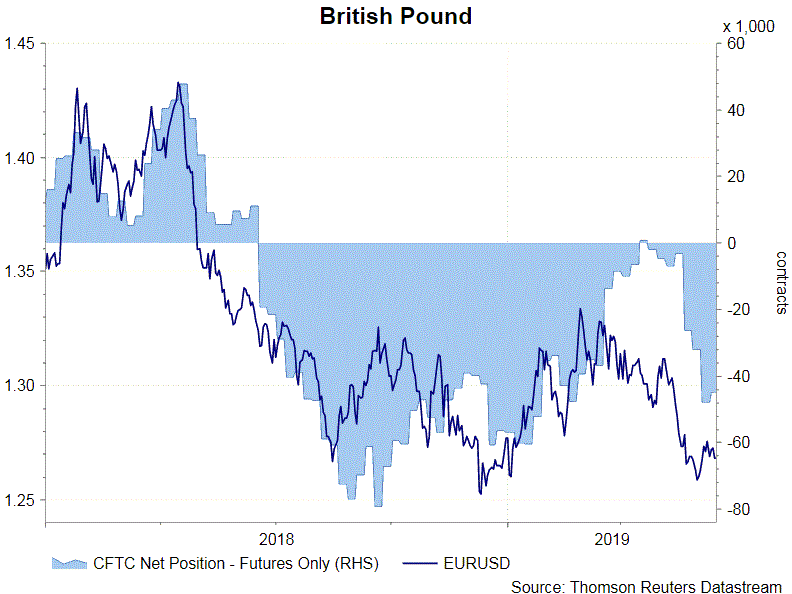
 Concerning European currencies, NET SHORT for EUR futures slipped -759 contracts to 88 762. ECB did not sound as dovish as market expectations. Yet, traders trimmed bets on both long and short positions as they gauged what the ECB would do as the economy deteriorates. NET SHORT for GBP futures dropped -2 961 contracts to 44 801. Speculative long positions fell -8 237 contracts while speculative shorts declined -11 198 contracts for the week.
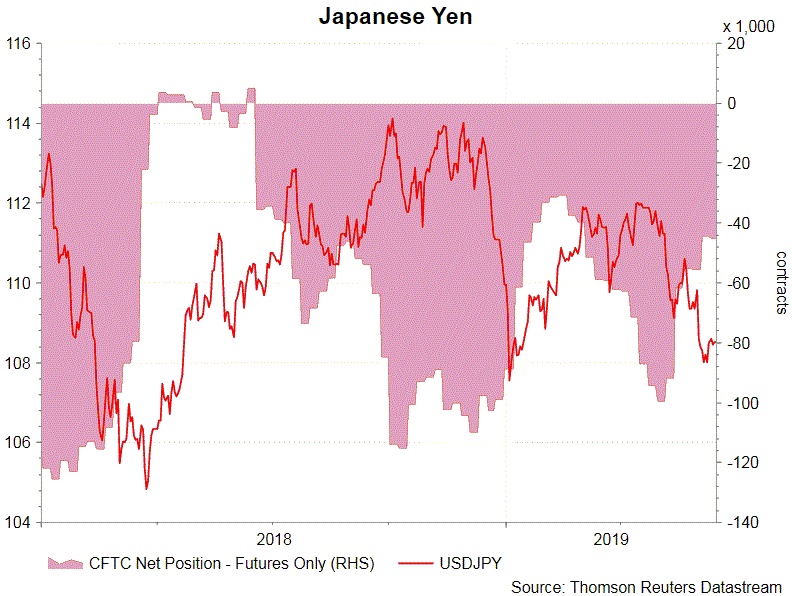
On safe-haven currencies, Net SHORT for CHF futures plunged -11 277 contracts to 24 788. NET SHORT for JPY futures gained +776 contracts to 45 165 during the week. Speculative long positions fell -6 651 contracts while shorts also decreased -5 875 contracts.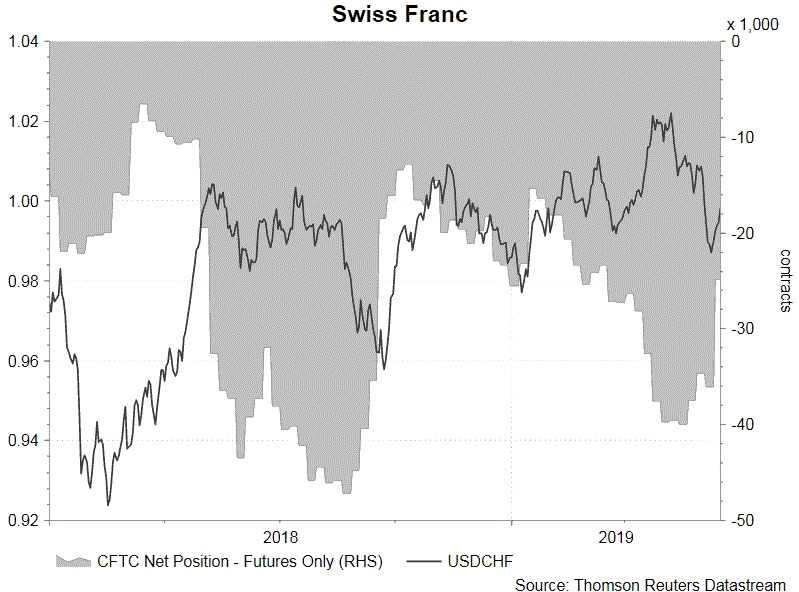
On commodity currencies, NET SHORT for AUD futures slid -65 contracts to 63 226. Speculative long positions dropped -3 857 contracts while shorts fell -3 922 contracts. The market had well- expected RBA's rate cut last week. Separately, NET SHORT for NZD fell -4 274 contracts to 16 122 contracts last week. NET SHORT for CAD futures fell -8 919 contracts to 32 840. 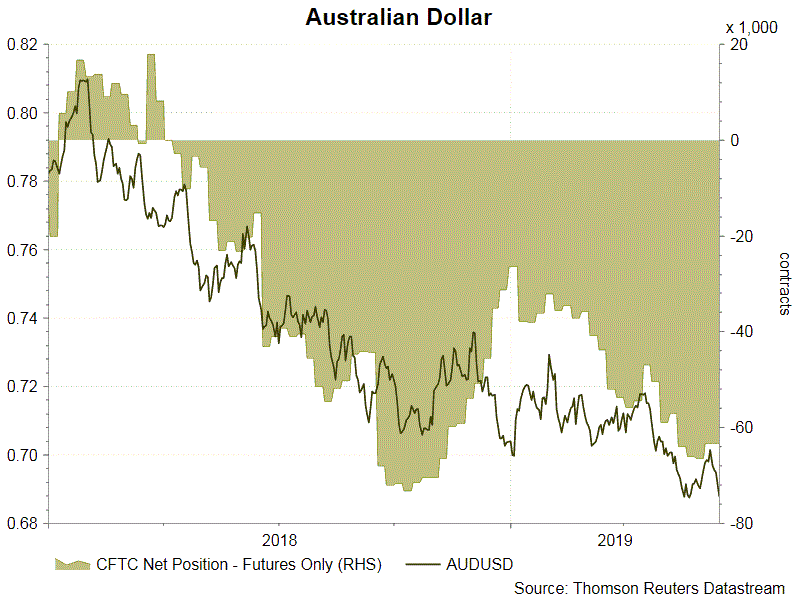
CFTC Commitments of Traders – Net Speculative Length for Crude Oil Futures Declined for Seven Weeks In A Row
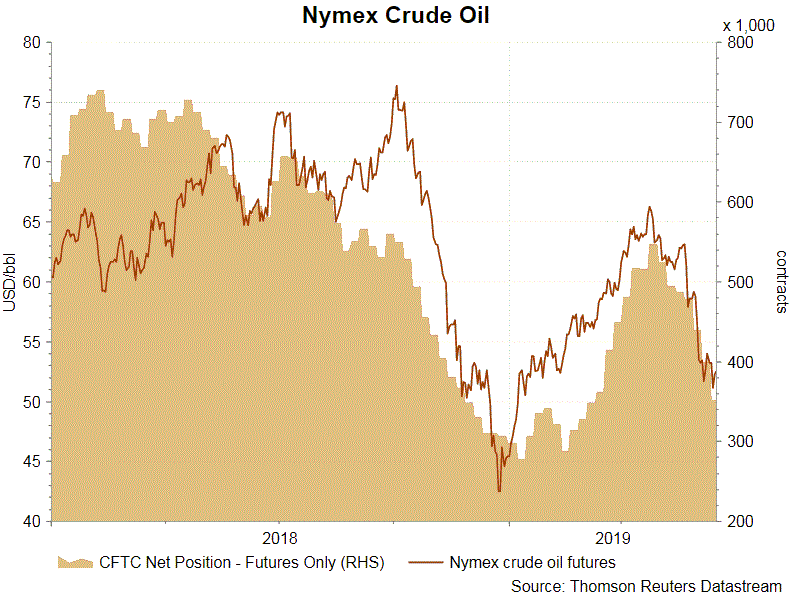
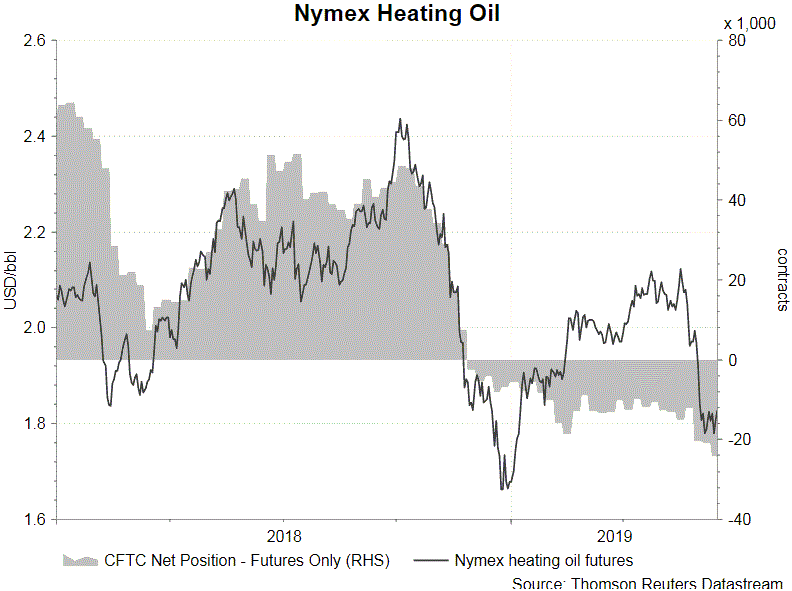
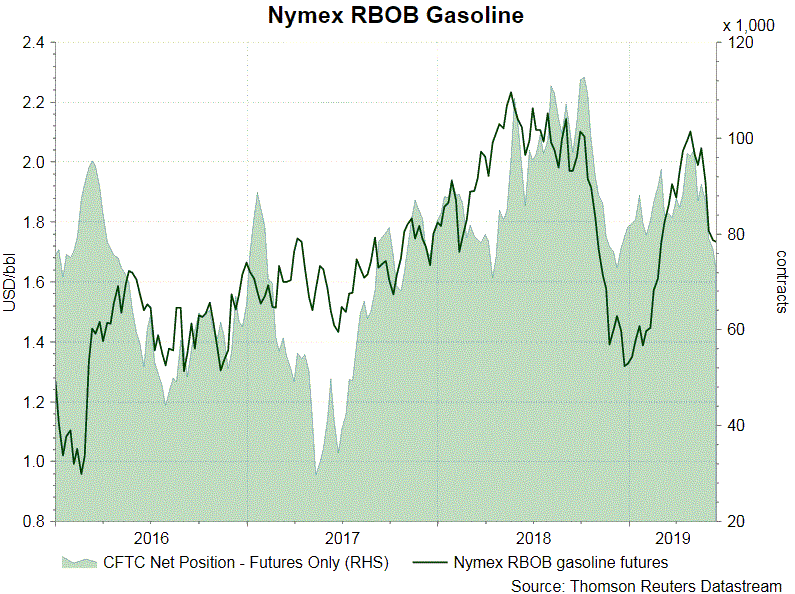
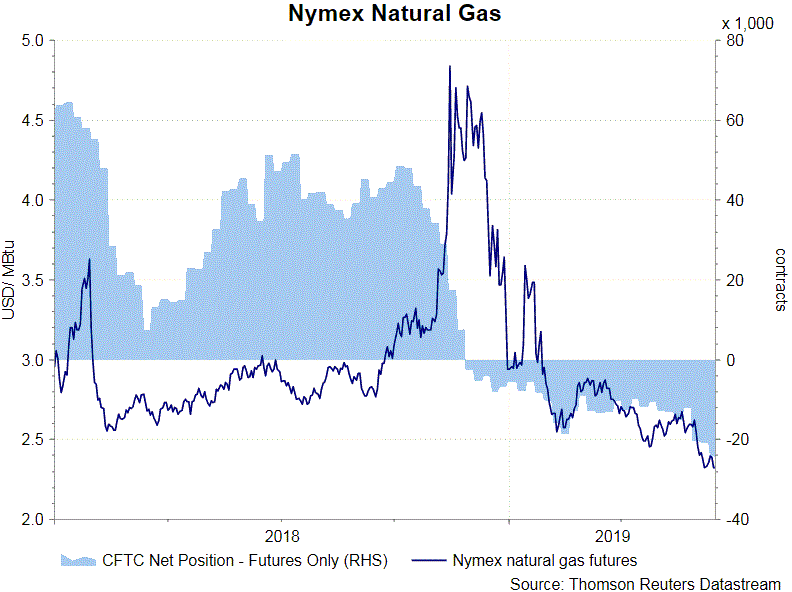
According to the CFTC Commitments of Traders report for the week ended June 11, NET LENGTH for crude oil futures dived -48 513 contracts to 351 655 for the week. Speculative long positions plunged -23 490 contracts while shorts jumped +25 023. More traders were speculating weaker oil prices ahead, due to rising concerns of global economic slowdown. For refined oil products, NET LENGTH for gasoline declined -4 610 contracts to 72 294, while NET SHORT for heating oil added +3 340 contracts to 24 056 for the week. NET SHORT for natural gas futures rose +22 443 contracts to 126 948 contracts for the week.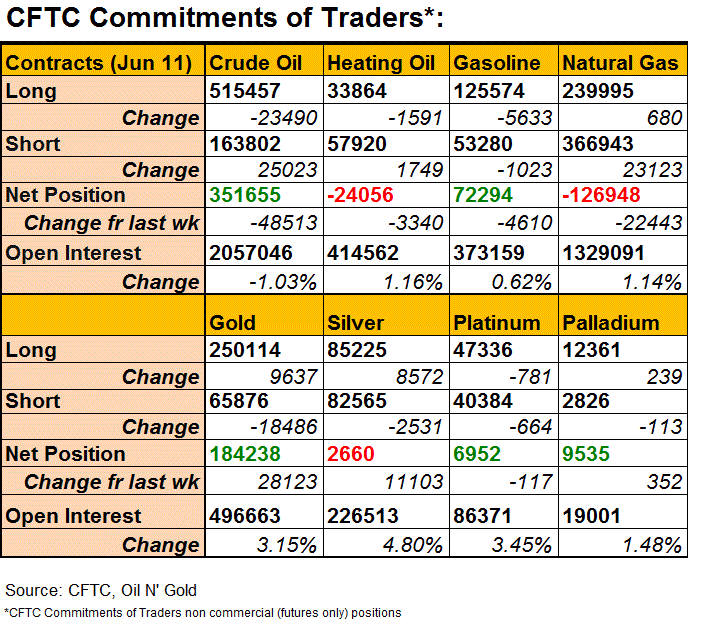
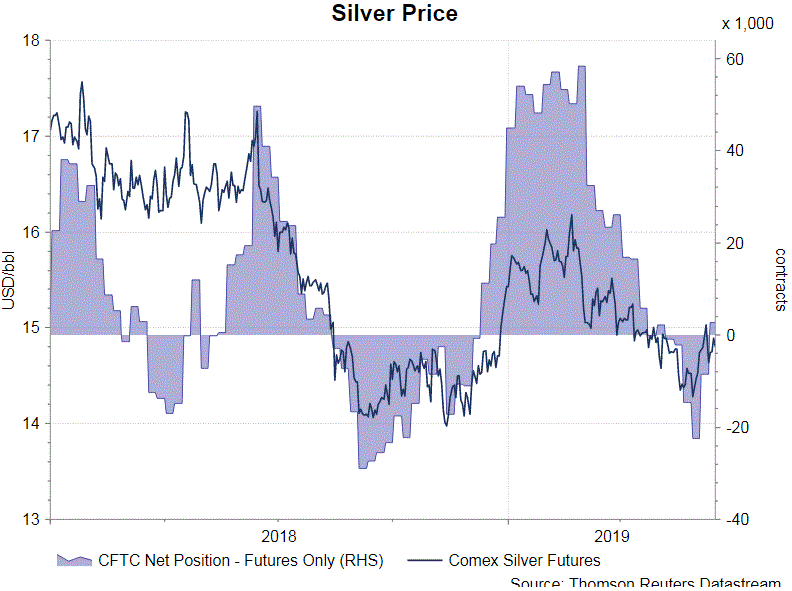
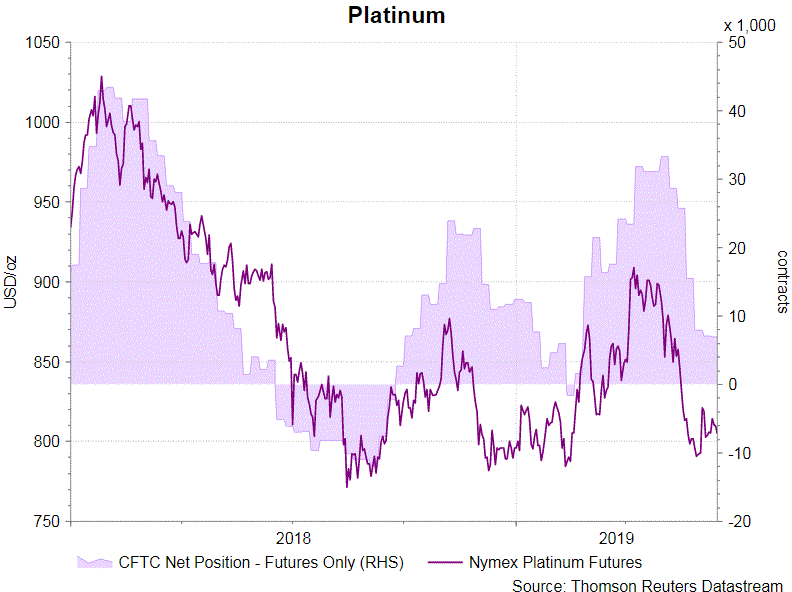
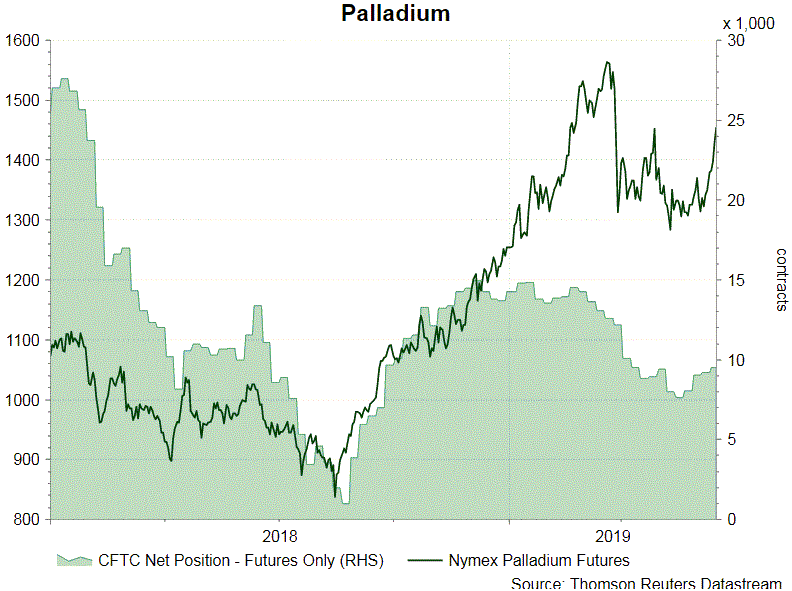
 Speculations for Fed funds rate cut in coming months continued to raise bets on higher gold price. NET LENGTH for gold futures rose +28 123 contracts to 184 238 last week. Speculative long positions gained +9 637 contracts, while shorts fell -18 486. For silver futures, speculative long positions gained +8 572 contracts while shorts dropped -2 531. These helped silver futures return to NET LENGTH of 2 660 contracts. For PGMs, NET LENGTH of Nymex platinum futures dropped -117 contracts to 6 952 while that for palladium increased +352 contracts to 9 535.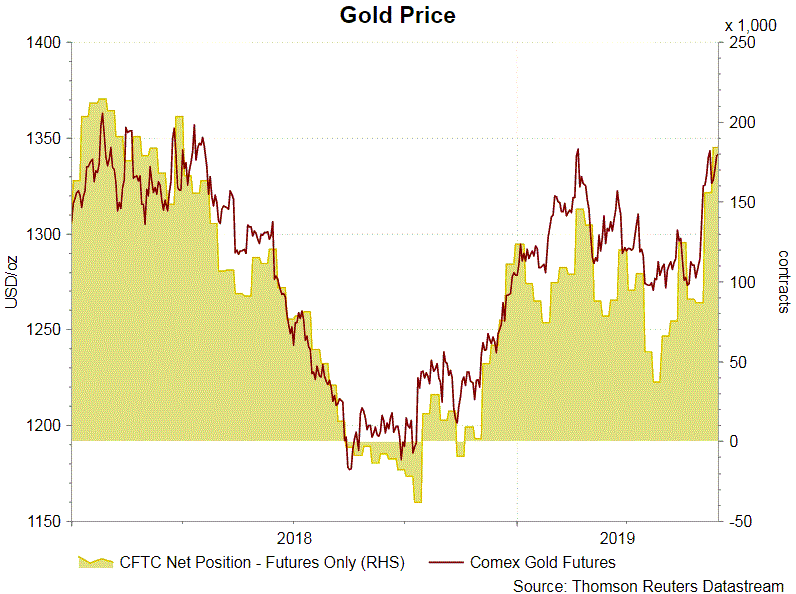
EURUSD Expects More Weakness On Bear Pressure
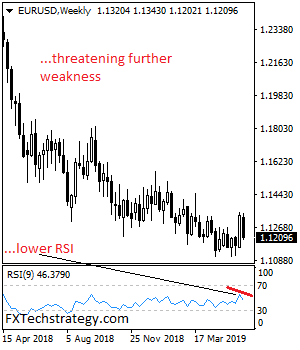
EURUSD expects more weakness on bear pressure as we enter a new week. Support comes in at the 1.1150 where a violation will turn risk to the 1.1100 level. A break below here will target the 1.1050 level. Further down, support sits at the 1.1000. Conversely, on the upside, resistance resides at 1.1250 level with a break through there opening the door for further upside towards the 1.1.1300 level. Further up, resistance comes in at the 1.1350 level where a violation will expose the 1.1400 level. All in all, EURUSD expects more weakness on bear pressure as we enter a new week.
USDCHF Recovery Threats Expected In The New Week
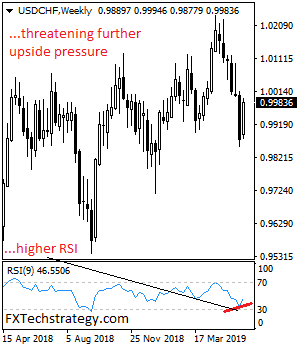
USDCHF recovery threats expected in the new week following its past week gain. Resistance resides at the 1.0000 level. Above here, resistance lies at the 1.0050 level and then the 1.0100 level. Further out, resistance comes in at the 1.0150 level. Its weekly RSI is bullish and pointing higher suggesting further upside pressure. On the downside, support is seen at the 0.9950 level with a turn below here opening the door for more decline towards the 0.9900 level. And then the 0.9850 level. Further down, support resides at the 0.9800 level. All in all, USDCHF recovery threats expected in the new week on further correction.
Eco Data 6/17/19
[php_everywhere instance="1"]
EUR/USD Weekly Outlook
EUR/USD's sharp fall last week suggests that recovery from 1.1107 has completed at 1.1347. Initial bias is now on the downside for 1.1107 low first. We'd be cautious on strong support from there to bring rebound. On the upside, above 1.1268 minor resistance will turn bias back to the upside for 1.1347 again.
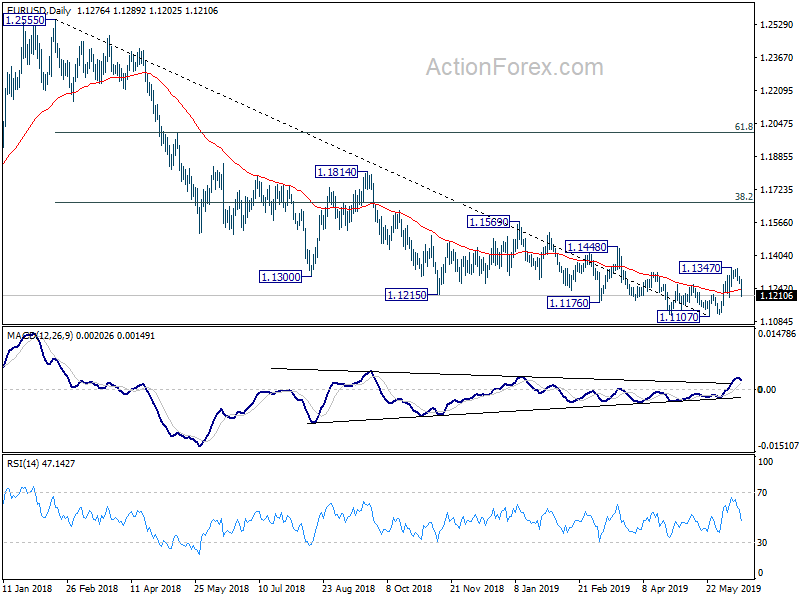
In the bigger picture, considering bullish convergence condition in daily and weekly MACD, a medium term bottom could be in place at 1.1107 after hitting 61.8% retracement of 1.0339 (2016 low) to 1.2555 (2018 high) at 1.1186. Hence, for now, risk will stay on the upside as long as 1.1107 low holds. Break of 1.12347 will extend the rebound towards 38.2% retracement of 1.2555 to 1.1107 at 1.1660. However, sustained break of 1.1107 will confirm resumption of down trend from 1.2555.
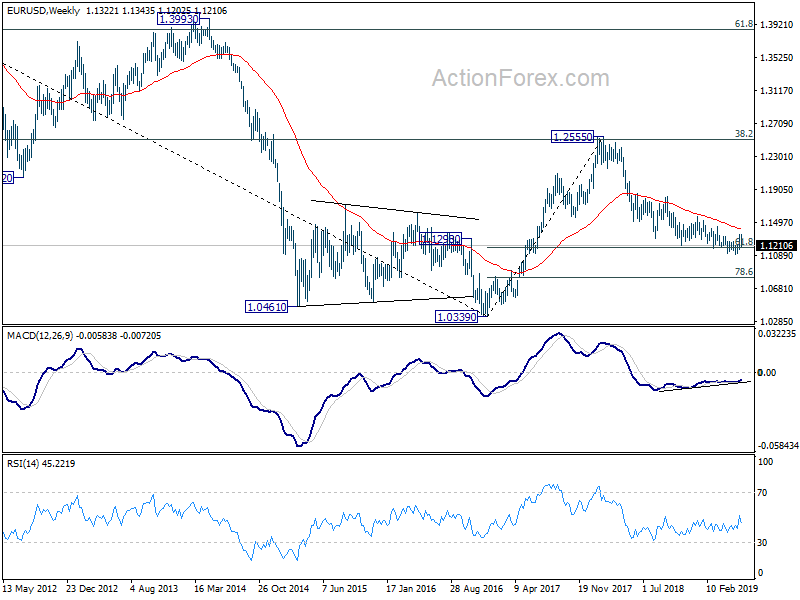
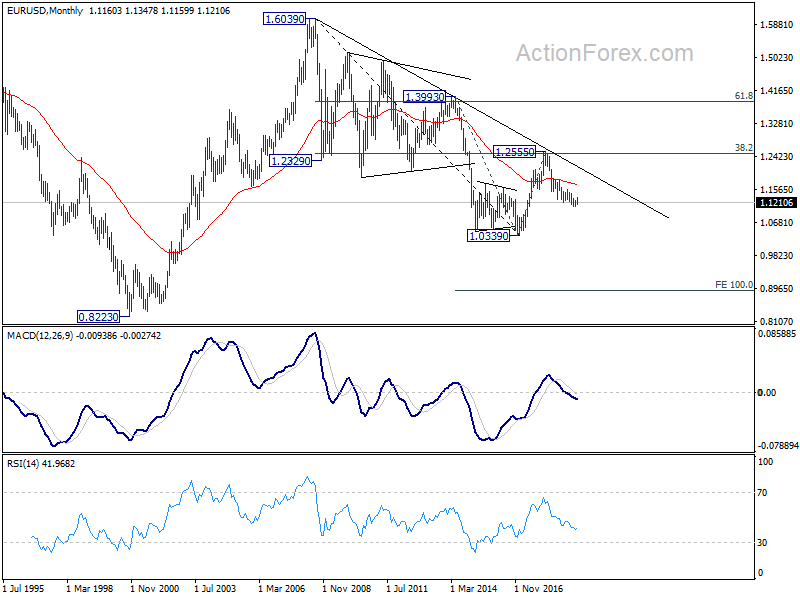
In the long term picture, the rejection from 38.2% retracement of 1.6039 to 1.0339 at 1.2516 argues that long term down trend from 1.6039 (2008 high) might not be over yet. EUR/USD is also held below decade long trend line resistance, 55 month and 55 week EMA. Break of 1.0339 will resume the down trend to 100% projection of 1.3993 to 1.0339 from 1.2555 at 0.9501
USD/JPY Weekly Outlook
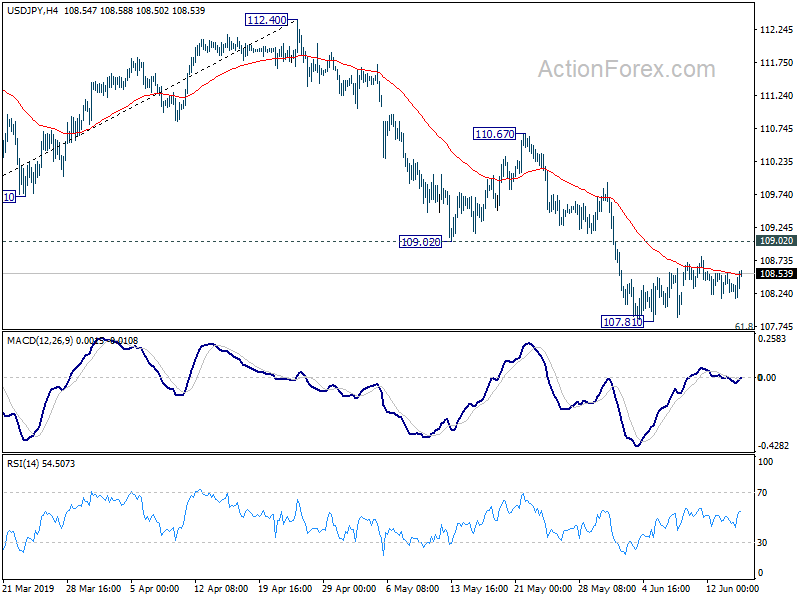
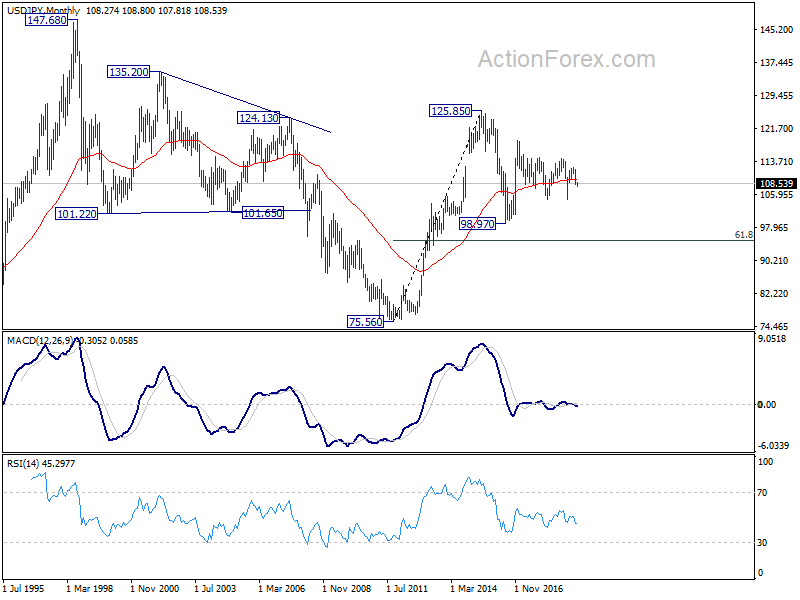
USD/JPY's consolidation from 107.81 continued last week and outlook is unchanged. Initial bias remains neutral first. In case of another rise, upside should be limited by 109.02 support turned resistance to bring fall resumption. On the downside, sustained break of 61.8% retracement of 104.69 to 112.40 at 107.63 will pave the way back to 104.62/9 key support However, break of 109.02 support turned resistance will indicate short term bottoming and bring lengthier consolidations first.
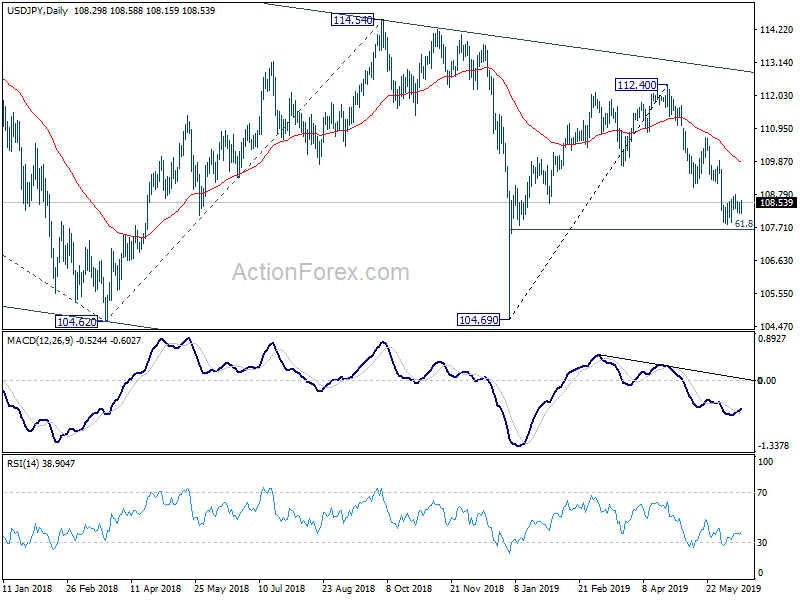
In the bigger picture, decline from 118.65 (Dec 2016) is still in progress, with the pair staying inside long term falling channel. Break of 104.62 will target 100% projection of 118.65 to 104.62 from 114.54 at 100.51. For now, we'd expect strong support above 98.97 (2016 low) to contain downside to bring rebound.
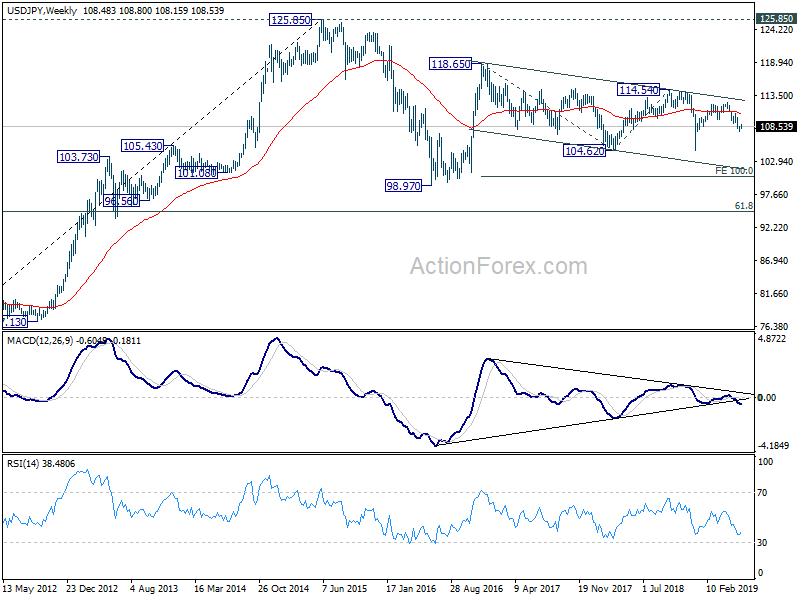
In the long term picture, the rise from 75.56 (2011 low) long term bottom to 125.85 (2015 high) is viewed as an impulsive move, no change in this view. Price actions from 125.85 are seen as a corrective move which could still extend. In case of deeper fall, downside should be contained by 61.8% retracement of 75.56 to 125.85 at 94.77. Up trend from 75.56 is expected to resume at a later stage for above 135.20/147.68 resistance zone.
GBP/USD Weekly Outlook
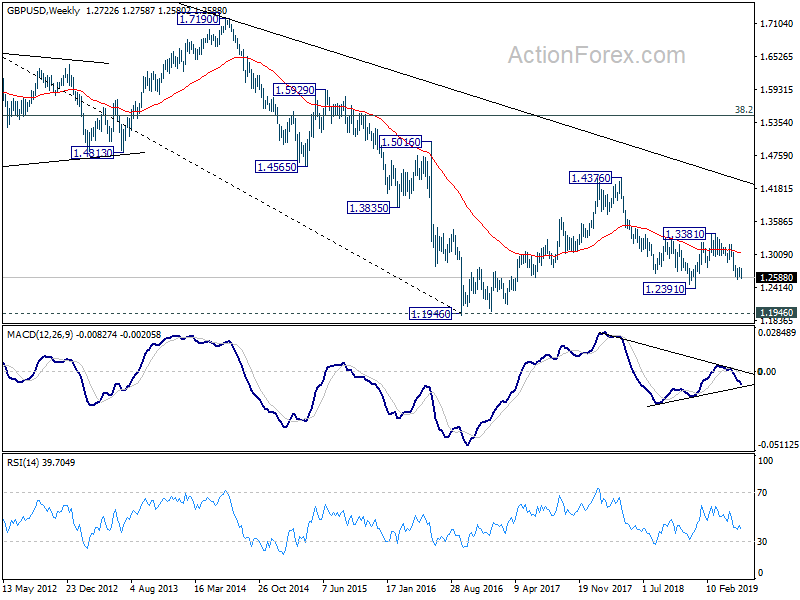
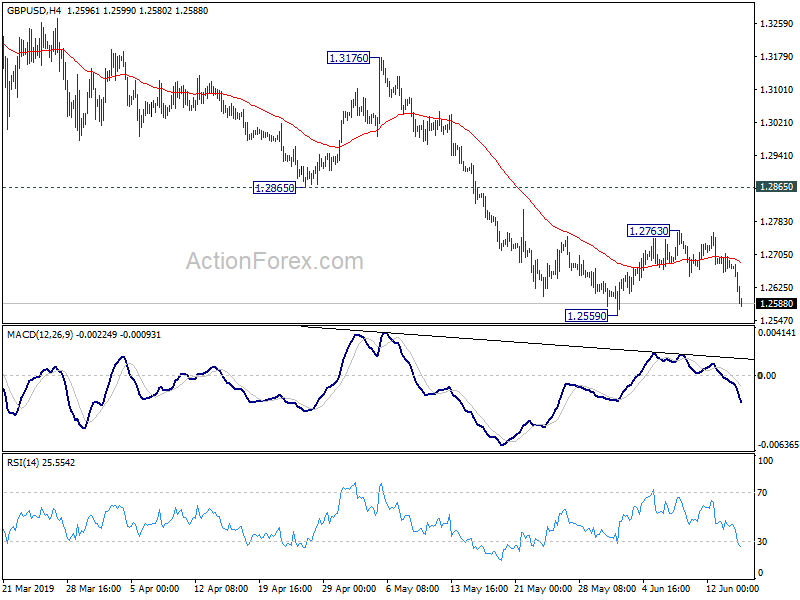
GBP/USD's sharp fall argues that corrective recovery from 1.2559 has completed at 1.2763 already. Initial bias remains on the downside this week for 1.2559 first. Break will resume the whole fall from 1.3381 and target 1.2391 low next. On the upside, in case of another recovery, upside should be limited by by 1.2865 support turned resistance to bring fall resumption eventually.
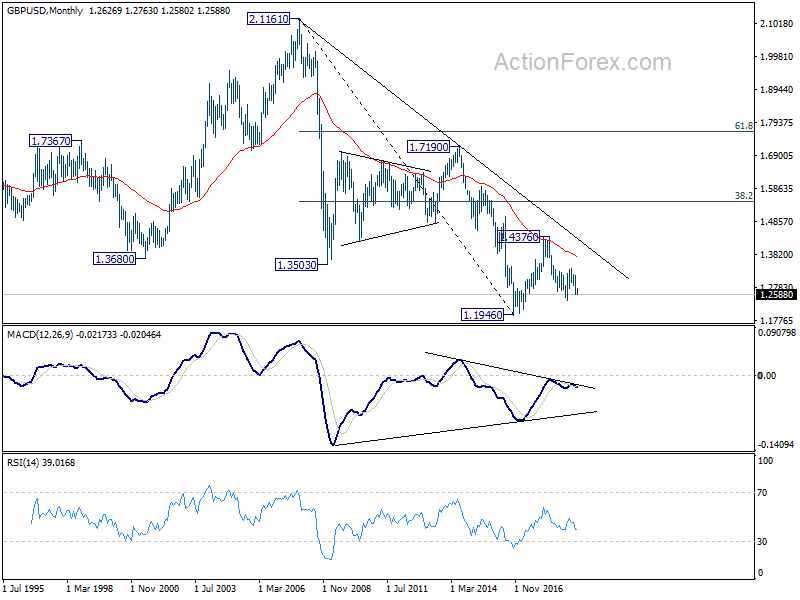
In the bigger picture, medium term decline from 1.4376 (2018 high) is possibly ready to resume. Decisive break of 1.2391 would target a test on 1.1946 long term bottom (2016 low). For now, we don't expect a firm break there yet. Hence, focus will be on bottoming signal as it approaches 1.1946. In any case, medium term outlook will stay bearish as long as 1.3381 resistance holds, in case of strong rebound.
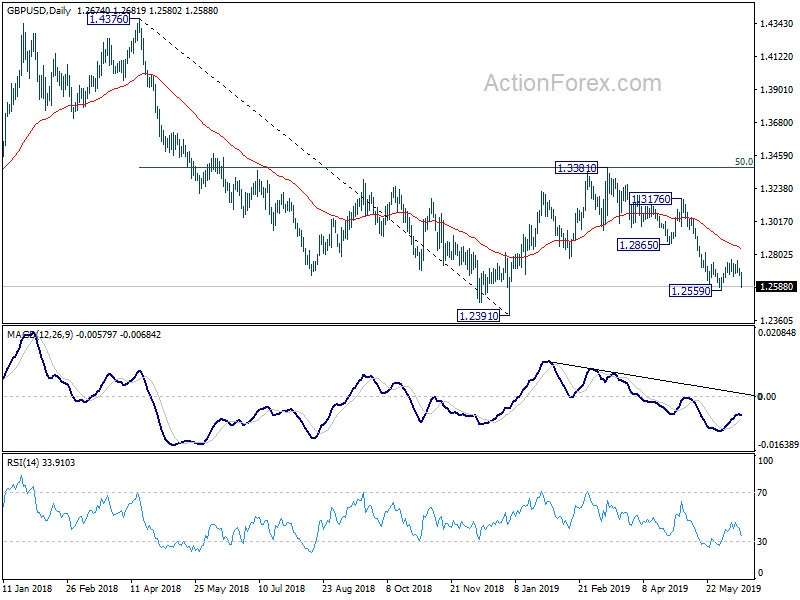
In the longer term picture, consolidative pattern from 1.1946 (2016 low) could still extend with another rising leg. But after all, decisive break of 38.2% retracement of 2.1161 (2007 high) to 1.1946 at 1.5466 is needed to indicate long term reversal. Otherwise, an eventual downside breakout will remain in favor.