Sample Category Title
US 500 Stock Index May Chart Another Pick Up
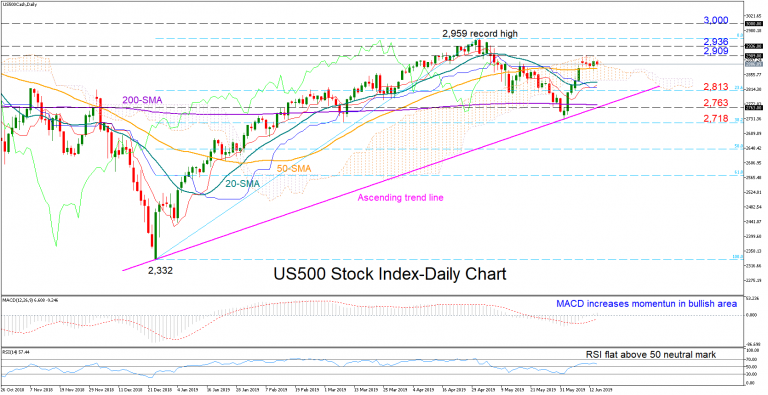
US 500 index showed little change after opening the week with a small positive gap above its 50-day simple moving average (SMA).
The distance between the MACD and its red signal line and the bullish momentum in the indicator suggests there is some room for improvement, but in the very short-term a consolidation phase may follow if the fast RSI continues to grind sideways.
A closing price above the 2,909-2,936 area and therefore on top of the Ichimoku cloud could trigger another bullish game more likely towards the all-time high of 2,959. Higher, the market would enter uncharted area, turning the spotlight to the 3,000 psychological mark.
Should the market correct to the downside, the 23.6% Fibonacci ratio of 2,813 of the upleg from 2,332 to 2,959, could provide nearby support, while lower, a more interesting battle could start near the ascending line drawn from the 2,332 bottom – around 2,763. Any decline below the line could feed speculation that a downward pattern may be on the way, with confirmation awaited around the 38.2% Fibonacci of 2,718.
Meanwhile, in the three-month time frame (medium-term), the outlook remains neutral as long as the price hovers within the 2,728-2,599 area.
The Analytical Overview Of The Main Currency Pairs
The EUR/USD currency pair
Technical indicators of the currency pair:
Prev Open: 1.12868
Open: 1.12761
% chg. over the last day: -0.08
Day's range: 1.12697 – 1.12823
52 wk range: 1.1111 – 1.2009
EUR/USD started to descend and set new local minimums. Right now the quotes are near the support level of 1.12650. The mirror resistance is at 1.13000. USD remains under pressure due to the expectations for Federal Reserve to increase the key interest rate in July. Today the investors are going to evaluate the retail sales report from US. Open positions from the key levels.
At 15:30 (GMT+3:00) the US will publish a real estate sales report.
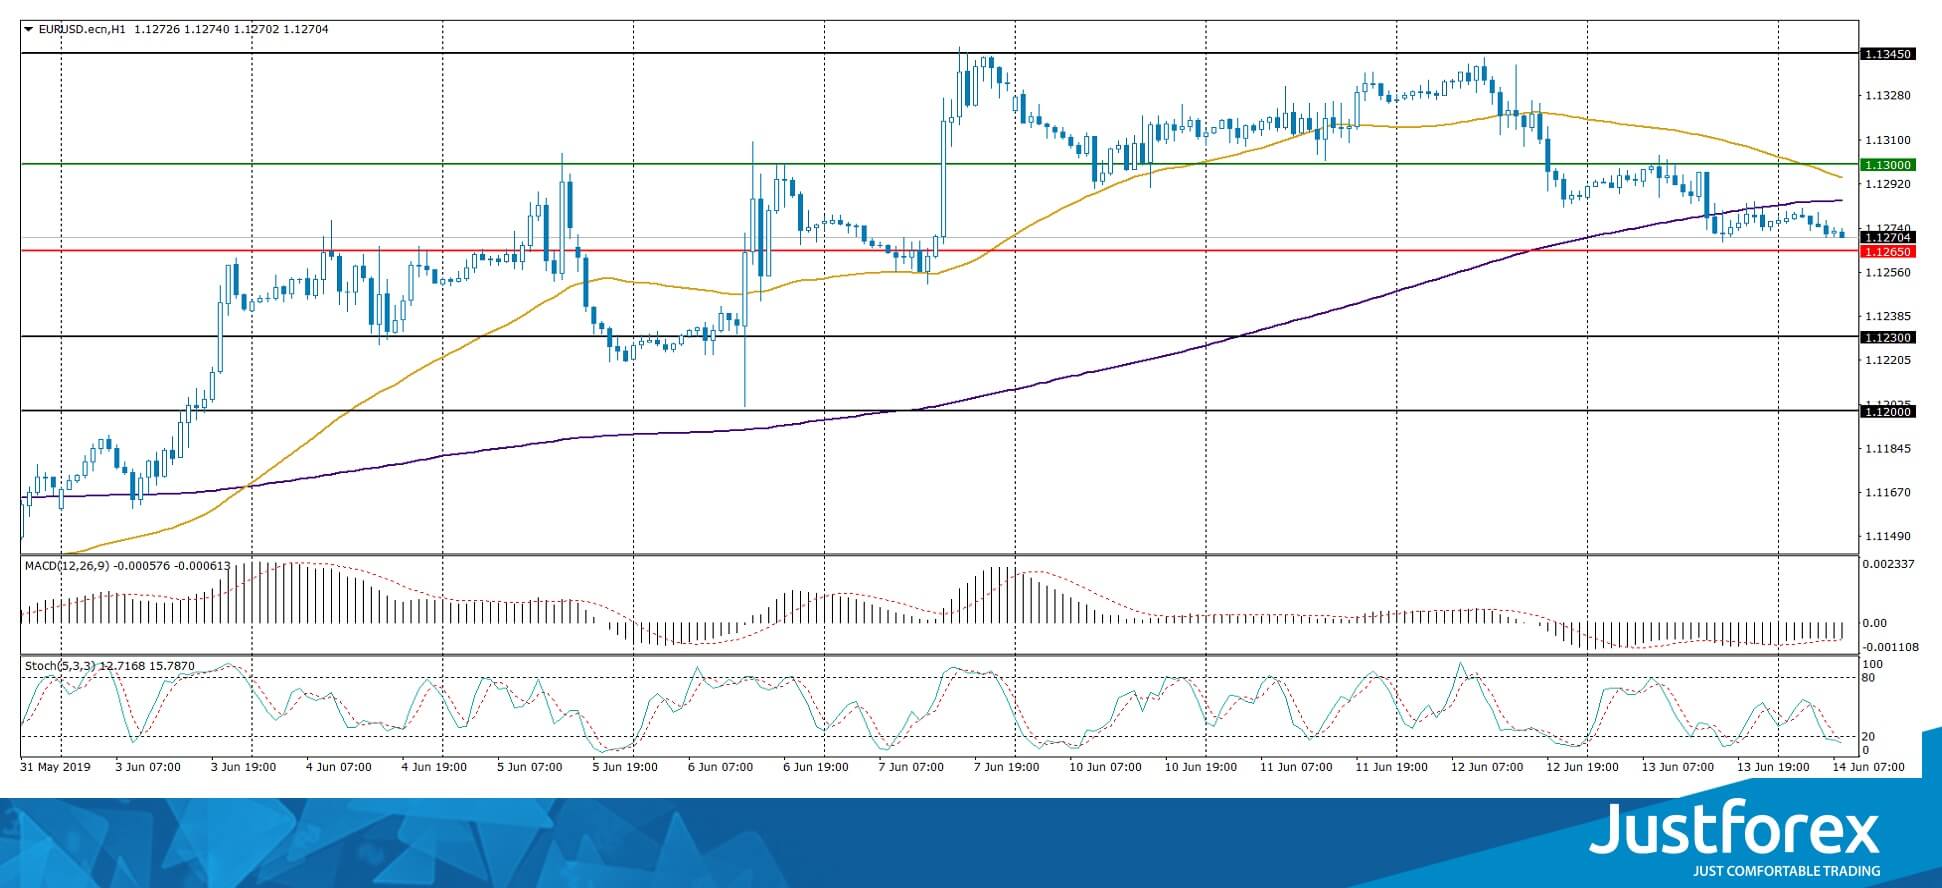
The indicators do not provide precise signals: 50 MA is crossing 200 MA.
The MACD histogram is in the negative zone and keeps falling which points to the bearish mood.
The Stochastic Oscillator is in the oversold zone, the %K line is below the %D line which gives a weak signal to sell EUR/USD.
Trading recommendations
Support levels: 1.12650, 1.12300, 1.12000
Resistance levels: 1.13000, 1.13450
If the price fixes below 1.12650, expect further correction towards 1.12300-1.12000.
Alternatively, the price can fix at 1.13300-1.13500.
The GBP/USD currency pair
Technical indicators of the currency pair:
Prev Open: 1.26844
Open: 1.26772
% chg. over the last day: -0.07
Day's range: 1.26704 – 1.26819
52 wk range: 1.2438 – 1.3631
The GBP/USD technical picture. GBP is consolidating, the local support and resistance are 1.26550 and 1.26900. The incestors are waiting for relevant info regarding Brexit. The leading candidate for the Britain PM position Boris Johnson mentioned that the country will leave the EU on October 31. The official also said that will force a review of the deal earlier negotiated with Brussel. You should open positions from the key levels,
The Economic News Feed for 14.06.2019 is calm.
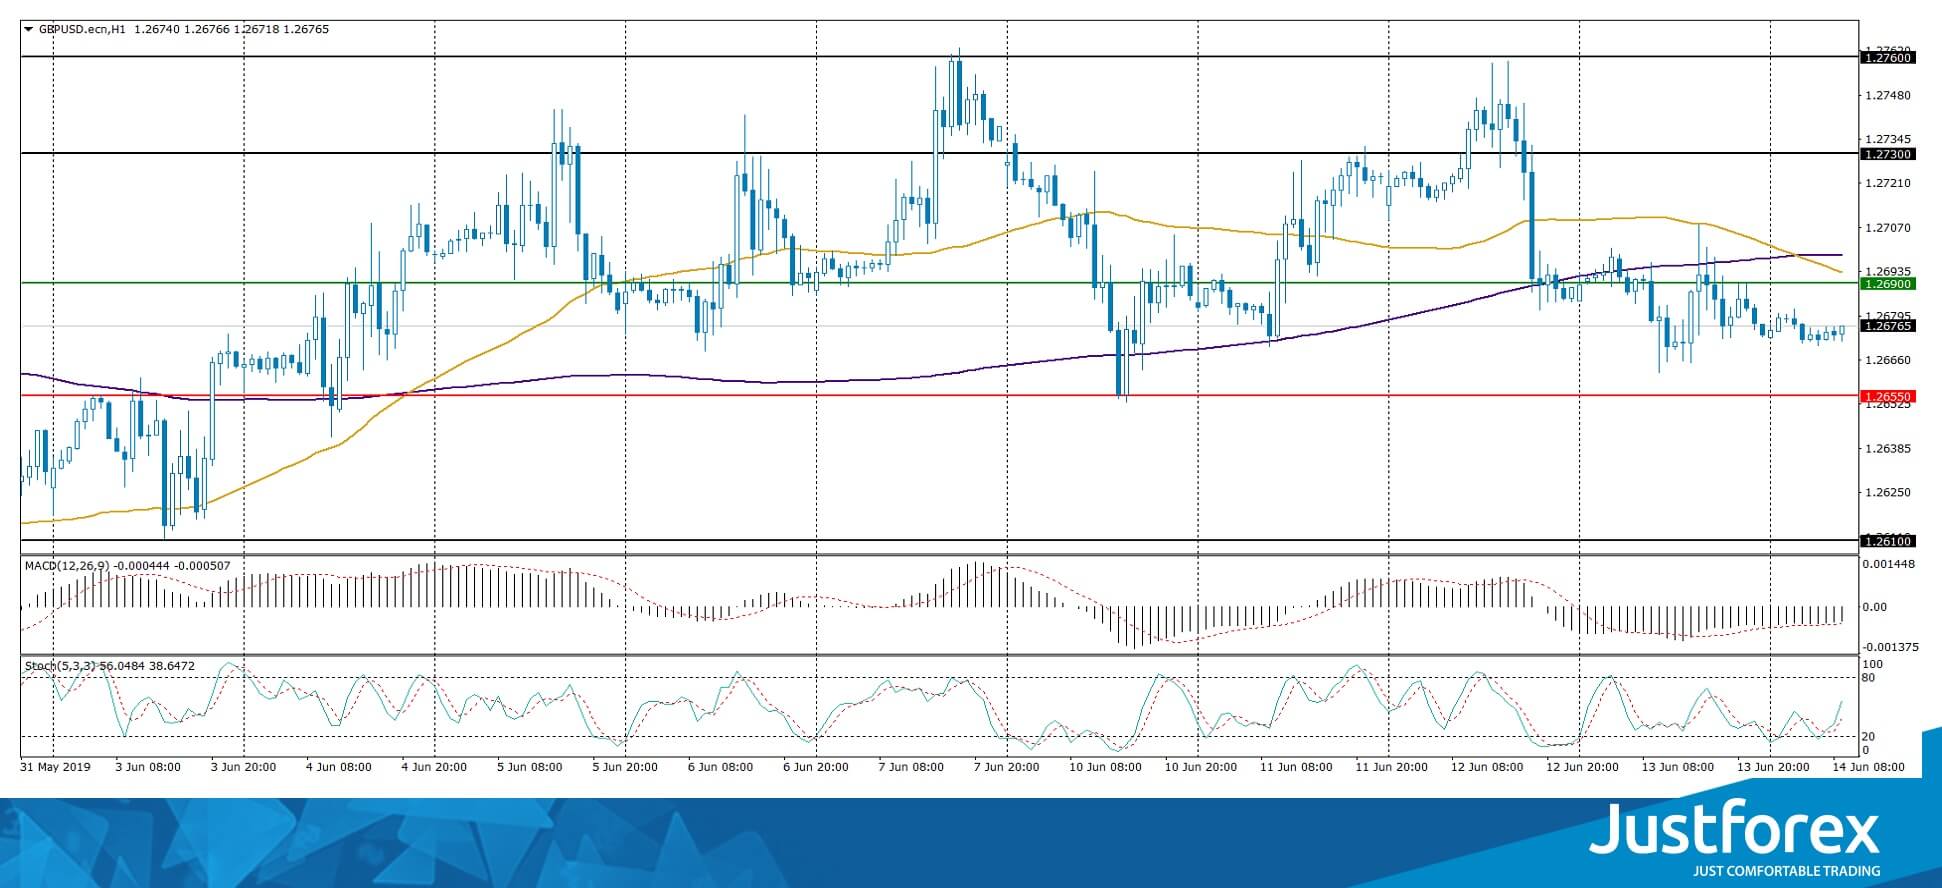
The indicators do not provide precise signals, 50 MA has crossed 200 MA.
The MACD histogram is in the negative zone but above the signal line which gives a singal to sell GBP/USD.
The Stochastic Oscillator is in the neutral zone, the %K line is above the %D line which points to the bullish mood.
Trading recommendations
Support levels: 1.26550, 1.26100
Resistance levels: 1.26900, 1.27300, 1.27600
If the price fixes below 1.26550, expect the quotes to descend towards 1.26200-1.26000.
Alternatively, the quotes can grow toward 1.27200-1.27500.
The USD/CAD currency pair
Technical indicators of the currency pair:
Prev Open: 1.33421
Open: 1.33263
% chg. over the last day: -0.12
Day's range: 1.33232 – 1.33461
52 wk range: 1.2727 – 1.3664
USD/CAD keeps recovering after a long fall. The trading instrument updated the local maximums. The USD/CAD quotes are testing the support zone at 1.33450-1.33650 with 1.33000 acting as a key resistance. USD/CAD can correct further. Keep an eye on the oil quotes and open positions from the key levels.
The Economic News Feed for 14.06.2019 is calm.
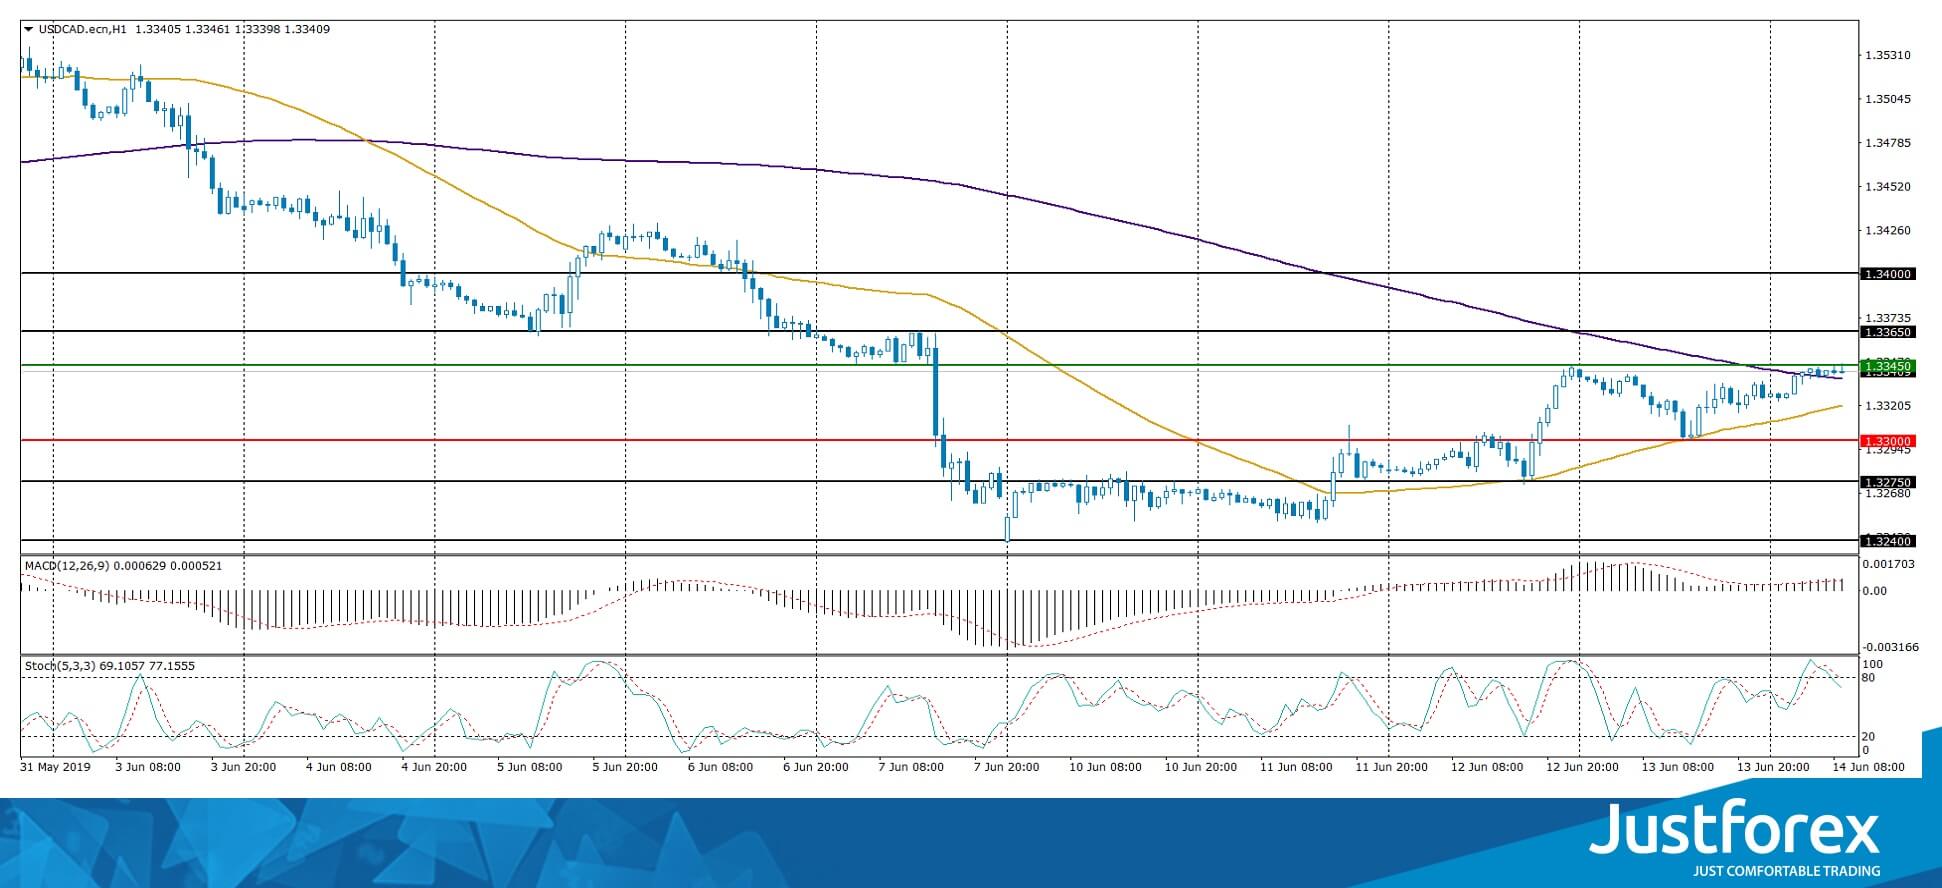
The indicators do not provide precise signals, 50 MA is crossing 200 MA.
The MACD histogram is in the positive zone and keeps rising which points toward further correction of USD/CAD.
The Stochastic Oscillator started to leave the overbought zone, the %K line is below the %D line which gives a signal to sell USD/CAD.
Trading recommendations
Support levels: 1.33000, 1.32750, 1.32400
Resistance levels: 1.33450, 1.33650, 1.34000
If the price fixes above 1.33450, expect further correction towards 1.33700-1.33400.
Alternatively, the quotes can descend towards 1.32700-1.32400.
The USD/JPY currency pair
Technical indicators of the currency pair:
Prev Open: 108.497
Open: 108.349
% chg. over the last day: -0.16
Day's range: 108.268 – 108.396
52 wk range: 104.97 – 114.56
USD/JPY keeps moving sideways. The technical picture is ambiguous. The key support and resistance levels are 108.250 and 108.500. The financial markets are waiting for the US retail sales report. Keep an eye on the US Treasury bonds` yield and open positions from the key levels.
The Economic News Feed for 14.06.2019 is calm.
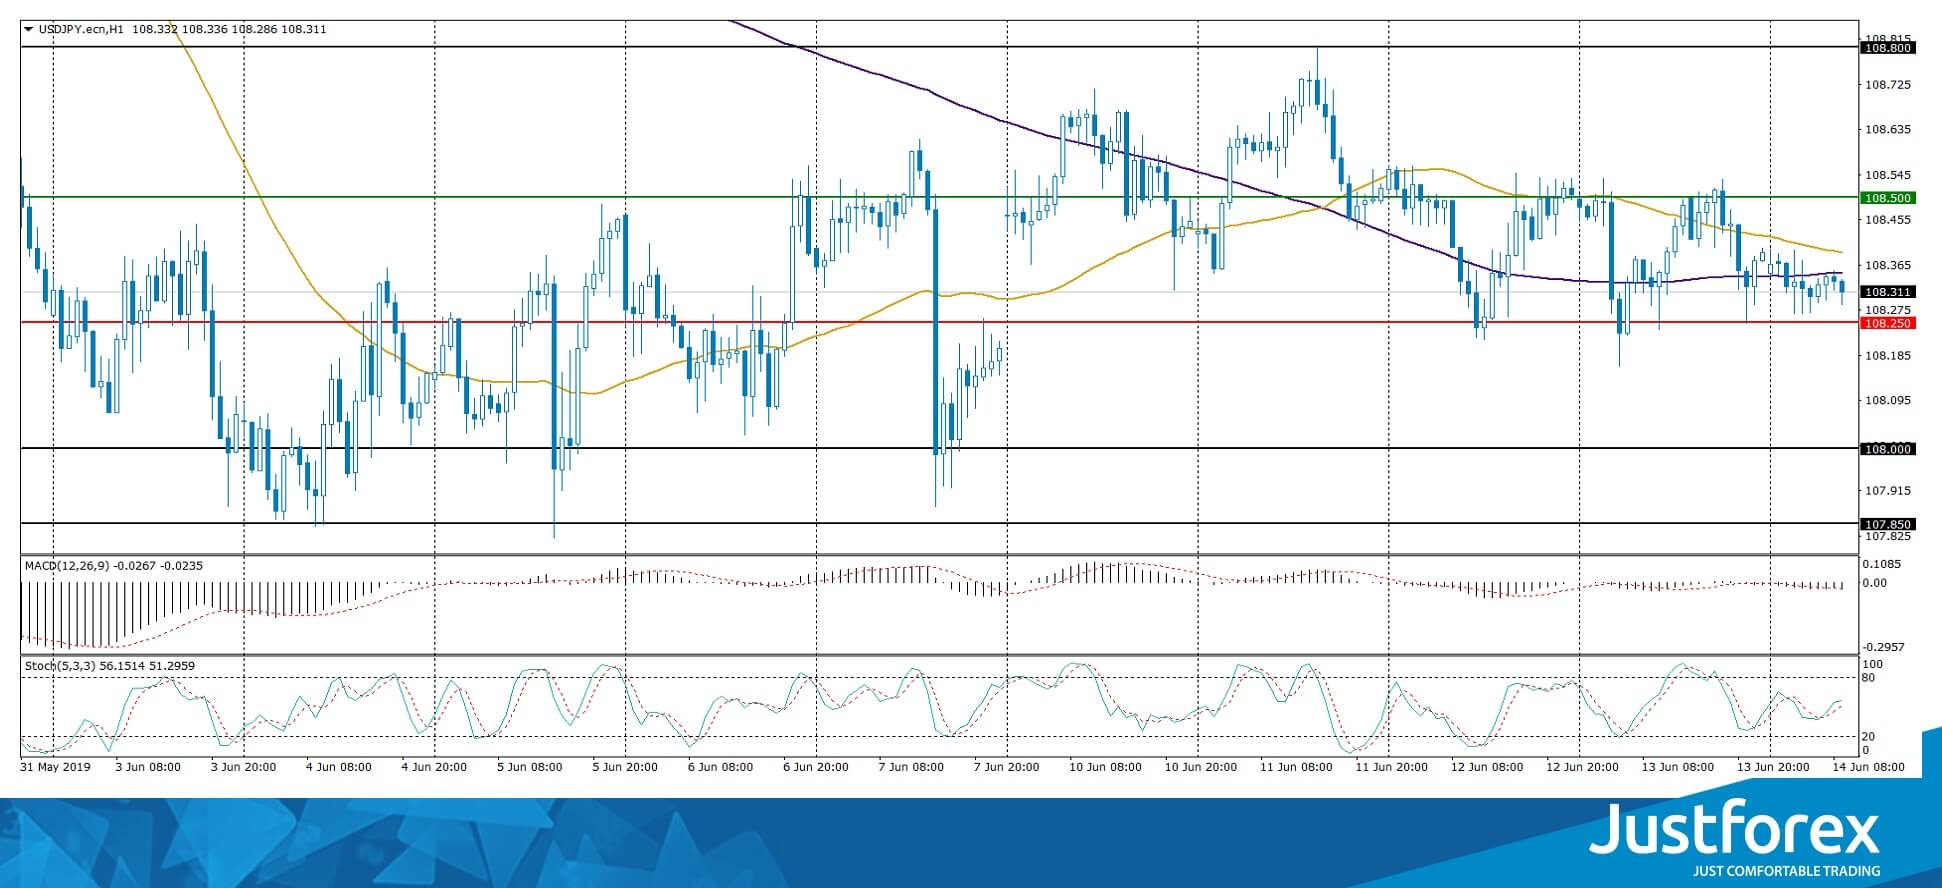
The indicators do not provide precise singals, the price has crossed 50 MA and 200 MA.
The MACD histogram is in the negative zone which points to the bearish mood.
The Stochastic Oscillator is in the neutral zone, the %K line is above the %D line which gives a signal to sell USD/JPY.
Trading recommendations
Support levels: 108.250, 108.000, 107.850
Resistance levels: 108.500, 108.800, 109.200
If the price fixes below 108.250, expect further descend towards 108.000-107.850.
Alternatively, the ptice can grow towards 108.700-109.000.
AUD/USD Is Supported At Daily Historical Levels And Needs A Retracement
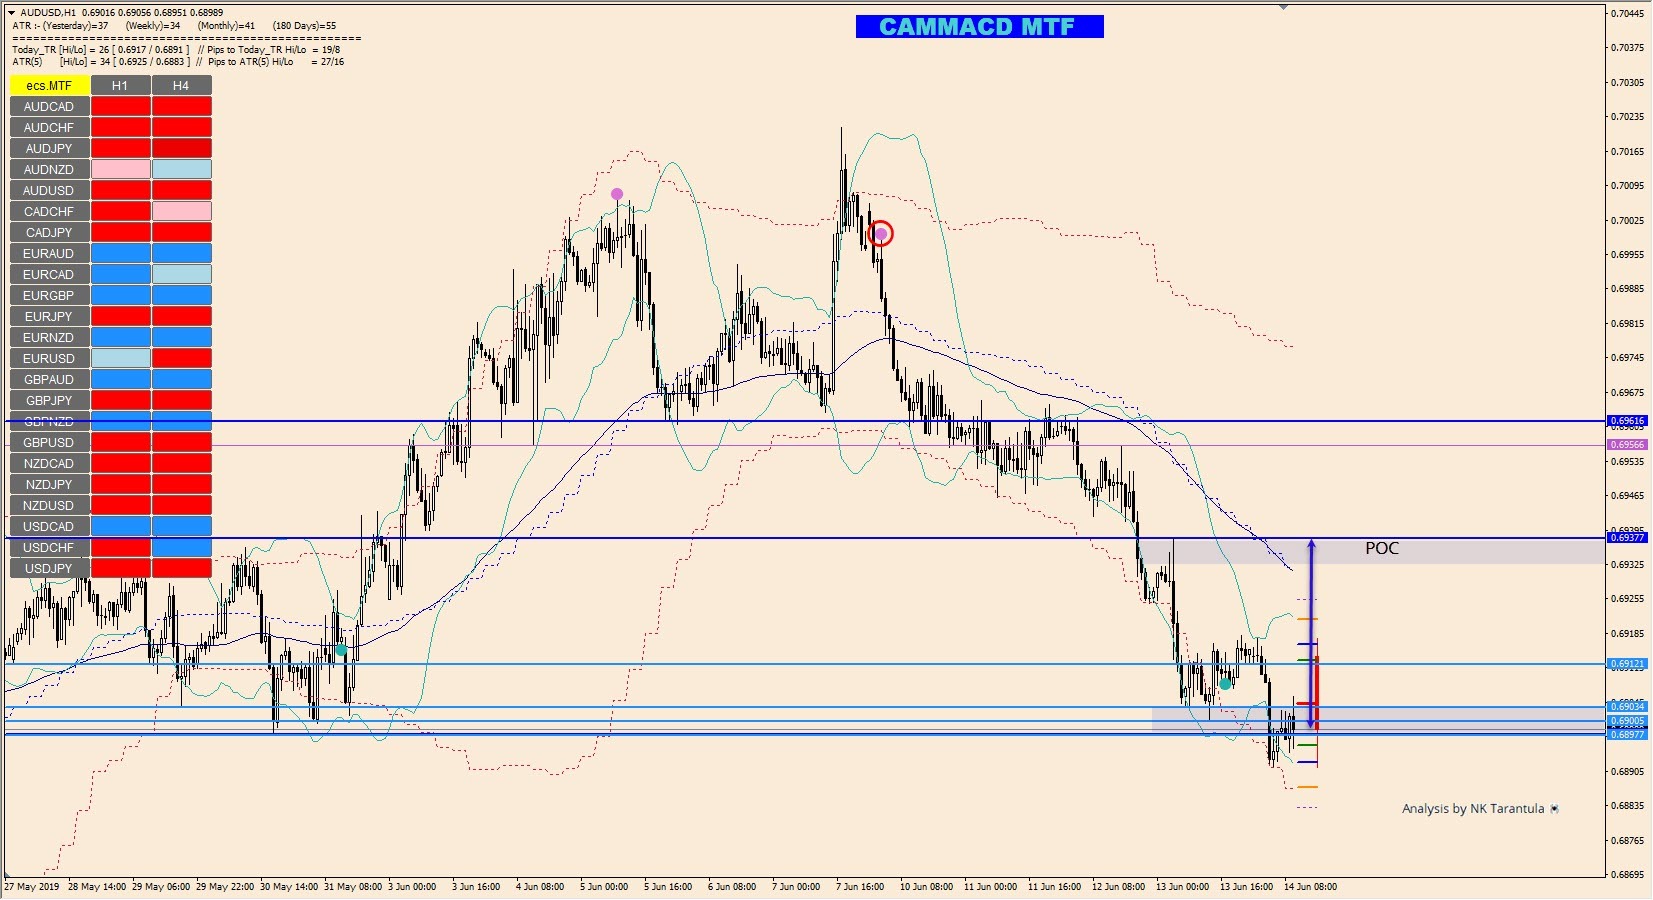
The AUD/USD has dropped to historical support levels zone 0.6890-0.6903. It needs a healthy retracemen to the upside.
0.6880 is the last chance for any bullish retracement on intraday timeframes. Unless it gets broken to the downside, bulls might try to get the price to the POC zone 0.6930-40 and 0.6660 if the bullish momentum persists and short traders close their trades. The interim range is 0.6890-0.6840. The price might reject from 0.6840 towards 0.6890 again if we see a retracement. If 0.6660 is reached then we might see a trend reversal and uptrend will start.
Cliff Notes: Conditions for Australian Business and Consumers Remain Challenging
Key insights from the week that was.
This week, updates for business conditions and consumer sentiment as well as the labour market highlighted how challenging Australia’s outlook is. Offshore, US trade relations and geopolitical tensions remained in focus ahead of the FOMC’s June meeting.
For the business sector, this was the first post-election reading for the NAB business survey, with interviewing beginning on 20 May, straight after the poll. Confidence certainly rallied on the election result and ahead of the June RBA cut, rising 7pts to +7 – a level just above the long-run average. By state and industry, the lift in sentiment was broad based with the exception of manufacturing, where sentiment was little changed. The two subsequent RBA rate cuts we see in August and November will provide support for confidence hence. However, this easing is occurring because the economy is weak. On this point, business conditions actually deteriorated in May, falling 2pts to +1 – a level well below the long-run average. The election may have biased this outcome down as elections can create a lull in new orders and activity while the sector awaits the result. That said, the weakness in conditions was broad based across the states and industry, and is consistent with other partial data to hand.
Turning to the consumer sector, the Westpac-MI consumer sentiment index fell 0.6% to 100.7 in June despite the RBA rate cut. From the detail of the report, it is apparent that household finances remain under significant pressure. While there is an expectation that rate and tax cuts will provide relief, it is difficult to foresee this benefit having a meaningful impact on consumers’ willingness to spend, with ‘time to buy a major household item’ well below average. A large portion of said benefit is instead expected to be saved, particularly if expectations around the labour market deteriorate.
On the housing market, price expectations certainly responded to the June rate cut and expectations of more to come. However, this index still remains well below average, and the response of ‘time to buy a dwelling’ to the rate cut was subdued versus history. This highlights that concerns over affordability and general uncertainty will remain lasting headwinds for housing.
Then to the labour market. The May labour force report was a real mixed bag. Employment exceeded expectations, rising 42k. However, hours worked contracted 0.3% in the month and the unemployment rate remained at 5.2%, the latter as a result of a further increase in participation. The important point to note here is that, if offset by an increase in participation, strong employment growth does nothing to reduce labour market slack. Notably, the underemployment rate (which measures the share of workers who are willing and able to work more hours) now sits at 8.6%, 1.1ppts above the level seen post-GFC.
This highlights the considerable challenge before the RBA as they seek to lift wages, and consequently GDP growth and inflation. To our call for two more rate cuts in this cycle, risks are clearly to the downside. While offshore in Europe and the UK, Westpac Chief Economist Bill Evans had extensive discussions with investors over these risks and the implications for policy, particularly the possible introduction of QE in Australia.
Looking offshore, our latest Market Outlook highlights the deterioration seen in trade and global growth over the past year, in large part because of US trade policy. This is a global headwind which is unlikely to dissipate anytime soon. While President Trump has “indefinitely suspended” his threat to tariff Mexico, we have since seen the President make new threats against Europe, while the US also continues to investigate other countries such as Japan and India. The good news is that monetary and fiscal policy can and will respond in the US and China respectively, and that these actions will most likely sustain robust growth. For Australia, the risk is that the two rate cuts we expect in the US to end-2019 reduce the effectiveness of the RBA’s own policy easing, limiting the downward pressure lower Australian rates have on our dollar. We still believe that the Australian dollar will fall to USD0.66, but now not until the first half of 2020, after the FOMC halts rate cuts and as domestic risks to Australia’s economy linger.
Middle East Tension Rises as US Blames Iran
It had been a fairly quiet week in financial markets right up until about 10am Thursday morning local time in Oman when news starled to filter through global media of a reported oil tanker fire in the Gulf between Iran and the UAE. When the press started to report that in fact two vessels were on fire, one of which had been hit by two shells, three hours apart, crude oil prices surged higher.
Brent crude jumped as much as 4.5% on the news, providing a stark reminder of the state of tension in the region. US Secretary of State Pompeo was quick to blame Iran on the basis of “intelligence, the weapons used, the level of expertise needed and recent similar Iranian attacks on shipping”.
Japanese PM was meeting Iranian supreme leader Ayatollah Khamenei at the time of the attack. After the meeting, the Iranian leader said he had “no trust in America”.
About 16.8mbpd of crude oil passes through the Straits of Hormuz per day, emphasising just how critical this ‘chokepoint’ is to the global economy. UN Secretary General Guterres quickly stated that he “strongly condemns any attack against civilian vessels”.
Away from crude markets, global market sentiment has been more upbeat this last week. The agreement between Mexico and the US to avert tariffs announced after the close Friday last week helped equity markets around the world gain ground, aided by rising expectations that the Fed will cut rates.
While money markets are pricing in more than 60bps of cuts by the Fed by year end, Westpac has changed its Fed forecast and is now forecasting two rate cuts, in September and December, meaning that next week’s FOMC meeting and press conference will be key for financial markets. We expect to see the Fed being open-minded toward cuts; “Patience” potentially replaced with a promise to “act as appropriate” and the so called ‘dots’ likely see a clear dovish tilt.
Here in Australia, we have had a wealth of information on the Australian economy. We saw a rather mixed result in the May NAB business survey, with confidence up post-election but trading conditions, forward orders and employment all soft. The Westpac June consumer sentiment was also quite patchy but overall disappointing, with the index down slightly, compared to the usual sharp bounce on a rate cut. Australian consumers seem understandably more concerned about why the RBA cut rates.
The eagerly awaited May labour force data also saw a mixed set of results. On the positive side, jobs growth beat consensus for the 3rd straight month, up 42k. Over the year, jobs growth continues to run faster than GDP, with full-time employment +3.1%yr. However, the jobs surge has encouraged more potential workers to return to the jobs market and thus a record high participation rate which kept the unemployment rate at 5.2%.
The RBA says it would like this to be nearer 4.5% so there is extra interest in Governor Lowe’s speech on “The Labour Market and Spare Capacity” next Thursday, two days after the RBA minutes from the June 4 meeting are released. Market pricing for a July rate cut rose to 75% as markets focused on the higher than expected jobless rate. Heightened expectations of RBA rate cuts added to the weaker price action in the Australian dollar, which hit two week lows at 0.6902 Thursday and dropped below 0.69 today.
This was despite renewed tightness in global iron ore markets which saw prices in Singapore futures hit fresh 5 year highs. Given the focus that Governor Lowe is likely to apply to ‘spare capacity,’ the A$ may continue the slide below 0.69 next week.
Aside from the RBA minutes, Lowe’s speech and the FOMC meeting next week, we also have the Bank of Japan and Bank of England policy meetings on Thursday too. Neither central bank will touch policy, though comments from Governor Carney will be closely watched coming as the Tory leadership process continues.
Boris Johnson saw a commanding lead in the first round, adding to risks of further confrontation between the UK and Europe on Brexit. And finally, of course, Trump and Xi will be watched closely through the coming week for signs that they will or will not meet at the following week’s G20 meeting. Trump yesterday said he expected to meet Xi in Osaka; he did describe trade relations at the moment as a “bit testy”.
Event risk: US Jun NY Fed Empire State manufacturing survey (Mon), RBA Board Jun minutes (Tue), UK May CPI (Wed), US Fed policy decision (Wed local, 4am Thu AEST), NZ Q1 GDP, RBA governor Lowe speaks, Policy decisions in Japan, Indonesia, Philippines, Taiwan, UK May retail sales, Bank of England MPC meeting (Thu), Japan May CPI (Fri)
GBP/USD Outlook: Cable Holds Near Week’s Lows As Brexit Concerns Continue To Weigh
Cable stands at the back foot on Friday, holding in red for the third consecutive day, weighed by rising expectations that Boris Johnson will be UK's next Prime Minister.
Johnson supports the idea that Britain needs to leave the EU on 31 Oct, with or without deal that maintains strong fear about disorderly Brexit and pressures pound.
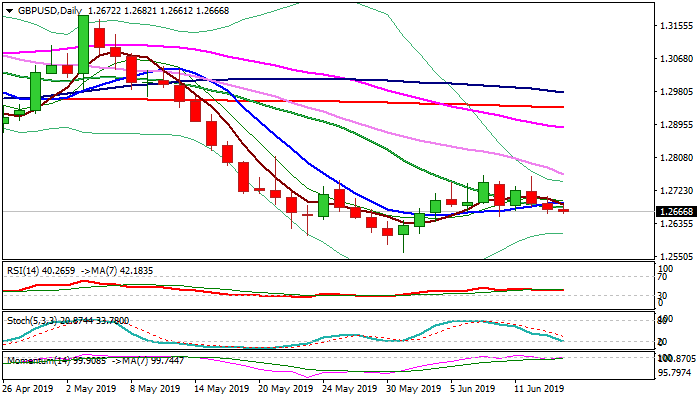
Fresh weakness pressures pivotal supports at 1.2660 zone (lows of recent congestion/50% retracement of 1.2559/1.2762 recovery leg/base of thick 4-hr cloud) with sustained break here to turn near-term bias lower and risk further weakness.
Thursday's close below 20SMA (which reverted to resistance and caps today's action) was bearish signal, however, flat momentum at the centerline, lacks firmer signal and slows bears.
Extension of sideways mode remains as possible scenario, however, bearish bias is expected to persist as long as price action holds below falling 30SMA (1.2765). The pair is also on track for bearish weekly close that adds to negative outlook. US retail sales data and speech of BoE governor Carney are in focus today and would provide fresh direction signals.
Res: 1.2678, 1.2686, 1.2702, 1.2713
Sup: 1.2653, 1.2642, 1.2610, 1.2580
EUR/USD Daily Outlook
Daily Pivots: (S1) 1.1259; (P) 1.1282; (R1) 1.1299; More......
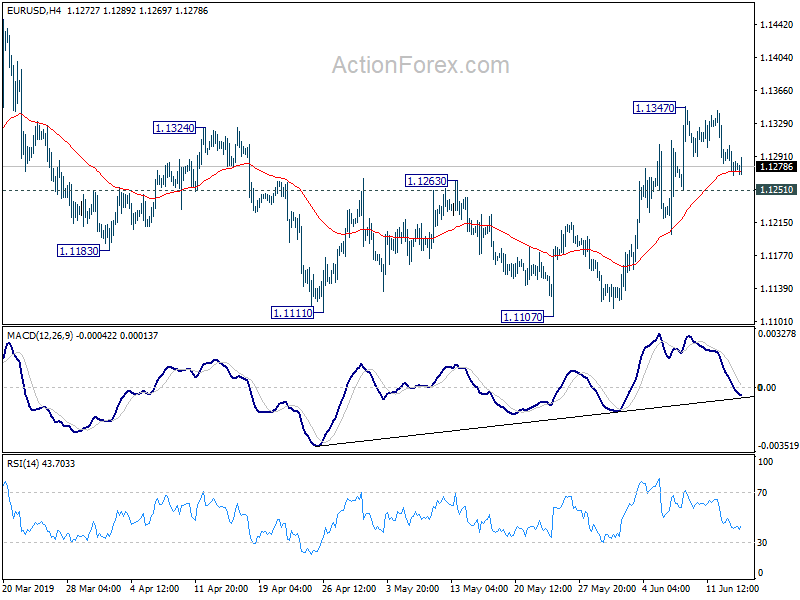
Intraday bias in EUR/USD remains neutral for the moment. With 1.1251 minor support intact, further rise is still mildly in favor. On the upside, above 1.1347 will target 1.1448 key resistance next. Decisive break there will carry larger bullish implications. On the downside, break of 1.1251 minor support will suggest that recovery from 1.1107 has completed. Intraday bias will be turned back to the downside for retesting 1.1107 low.
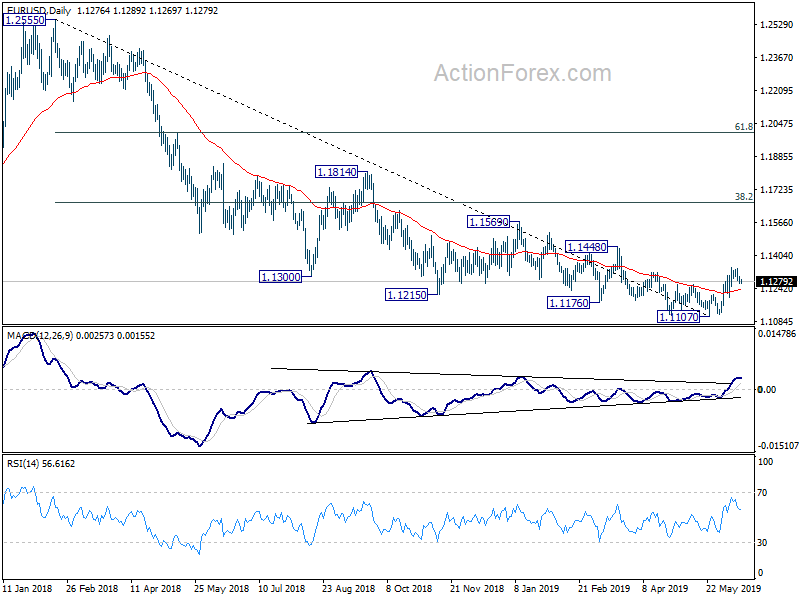
In the bigger picture, current development argues that a medium term bottom could be in place at 1.1107, on bullish convergence condition in daily MACD. Decisive break of 1.1448 resistance would confirm this case. And stronger rebound would be seen to 38.2% retracement of 1.2555 to 1.1107 at 1.1660. At this point, it's early to judge whether rise from 1.1107 is a corrective move or the start of an medium term up trend. We'd look at the structure of the rebound to decide later. But in any case, for now, risk will remain on the upside as long as 1.1107 low holds.
Oil, Gold Up On Middle East Tensions, Dollar Steady Ahead Of US Retail Sales
- Brent crude extends gains following tanker attack in Gulf of Oman; gold lifted too
- Dollar heads for weekly gains as US retails sales and Fed meeting eyed
- Aussie and kiwi sag on growing rate cut bets
Oil jumps on renewed tensions in Middle East
Market sentiment was mixed on Friday as ongoing trade uncertainty and a flare up in Middle East tensions were partly offset by growing expectations that the Fed will come to the rescue of a weakening economic outlook and cut rates.
Stocks around the world were on track for modest weekly gains even as investors fret over a deteriorating growth outlook. Major indices were boosted by energy shares as oil prices rallied following the attack on two oil tankers in the Gulf of Oman on Thursday.
The United States is blaming Iran for the attacks and says it has video evidence of Iran's Revolutionary Guard's involvement in the incident. However, the Iranian government has rejected the US accusation and fears are running high of a possible major conflict in one of the world's busiest oil routes.
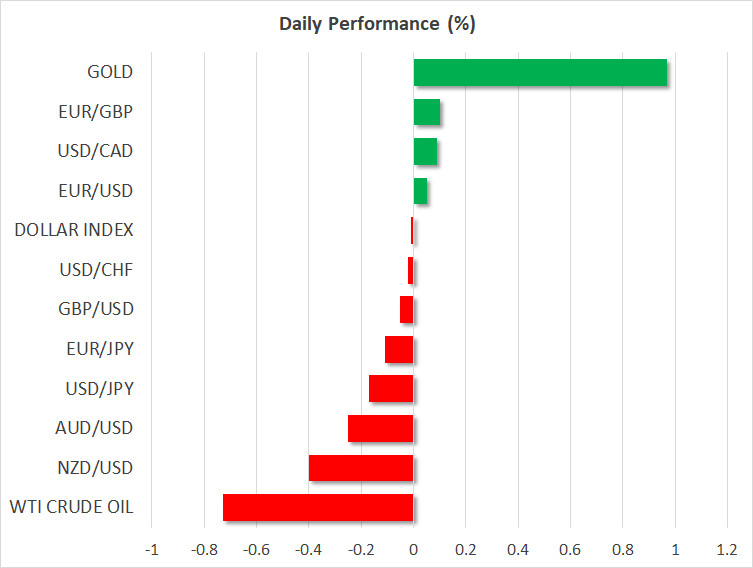
WTI and Brent crude prices surged by more than 2% on Thursday, with WTI falling back today, though Brent extended its gains to around $61.50 a barrel. The increases were relatively contained, however, considering the recent sharp decline in prices and the risk of a severe disruption to oil supply.
Any indication that the recent attacks in the region are fast developing into a wider military conflict could see oil prices posting substantially bigger gains. The escalation also lifted gold, which tends to benefit from geopolitical tensions. Gold prices hit a 14-month high of $1358 an ounce today, with Fed rate cut expectations also supporting the precious metal.
Dollar looks to US retail sales for direction
The US dollar was broadly steady on Friday, though was struggling a bit against the safe-have yen, easing to around 108.15. Speculation about what message the Federal Reserve will communicate next week at its policy meeting is the main concern for traders as the week draws to a close. Retail sales numbers due out of the US later today could provide come clues as to what to expect.
A strong retail sales report for May is likely to keep the Fed in wait-and-see mode. However, disappointing figures, on top of the soft jobs report, would heighten the odds of the Fed cutting rates in the coming months as well as weigh on the greenback.
Aussie and kiwi slide to fresh lows
The dollar's weekly advance means other majors were headed for losses. The euro, pound and the antipodean pairs all remained on the backfoot on Friday. The Australian and New Zealand dollars were on track to be the week's worst performers as rising expectations that the RBA and RBNZ will be forced to make additional rate cuts weighed on the two risk-sensitive currencies.
Global trade frictions and slowing growth in most advanced economies is making it difficult for the Australian and New Zealand central banks to lift inflation to their target, prompting them to cut rates in recent weeks. But investors are increasingly certain that neither the RBA or RBNZ are done with easing just yet and that more is on the way.
Weaker-than-expected industrial production data out of China today and a disappointing manufacturing PMI in New Zealand only added to the growth worries. The aussie slid to a 3-week low $0.6889 earlier today, while the kiwi touched a 1½-week trough of $0.6525.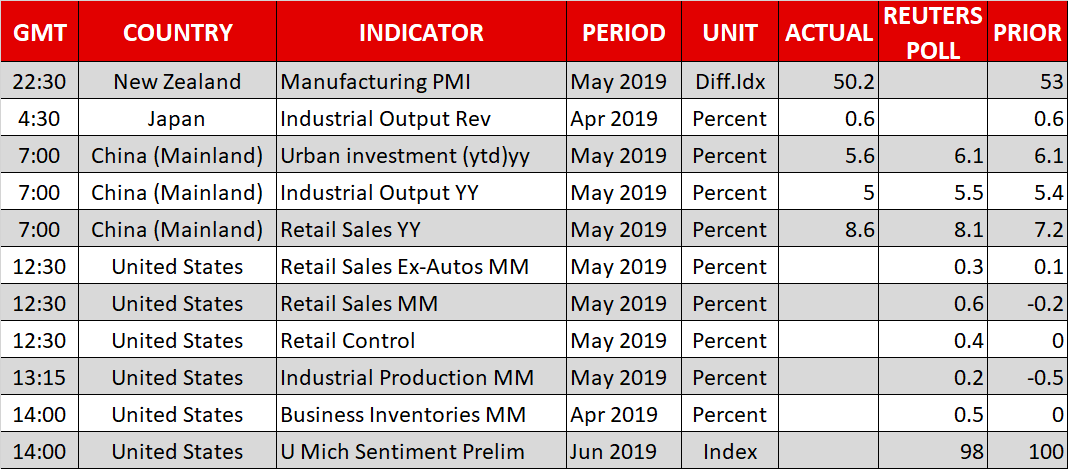
GBP/USD Daily Outlook
Daily Pivots: (S1) 1.2654; (P) 1.2681; (R1) 1.2700; More....
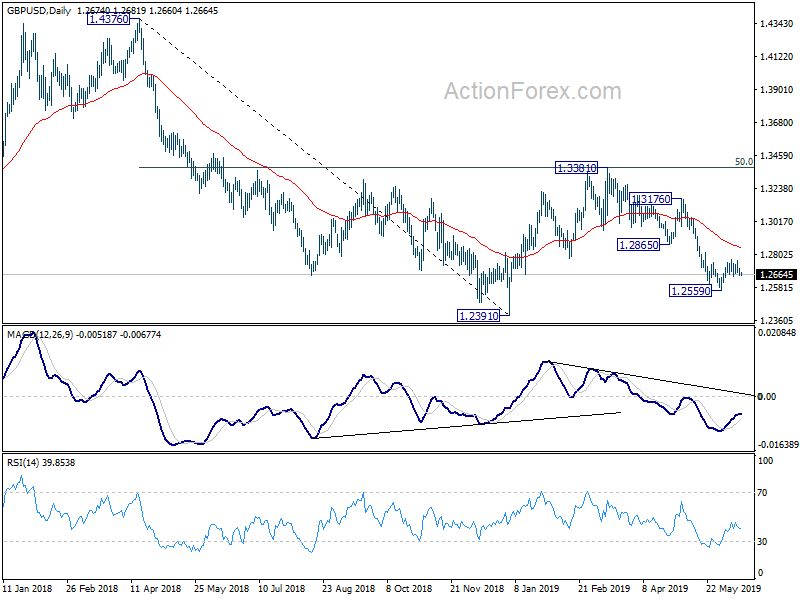
No change in GBP/USD's outlook as consolidation from 1.2559 is extending. Another rise cannot be ruled out but upside should be limited by by 1.2865 support turned resistance to bring fall resumption eventually. On the downside, break of 1.2559 low will extend the decline from 1.3381 for 1.2391 low first.
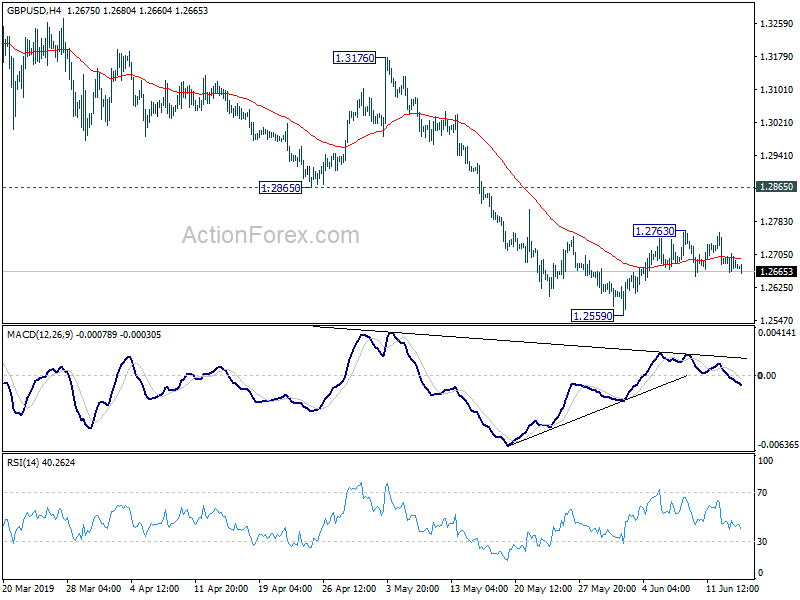
In the bigger picture, medium term decline from 1.4376 (2018 high) is possibly ready to resume. Decisive break of 1.2391 would target a test on 1.1946 long term bottom (2016 low). For now, we don't expect a firm break there yet. Hence focus will be on bottoming signal as it approaches 1.1946. In any case, medium term outlook will stay bearish as long as 1.3381 resistance holds, in case of strong rebound.
USD/CHF Daily Outlook
Daily Pivots: (S1) 0.9916; (P) 0.9938; (R1) 0.9960; More...
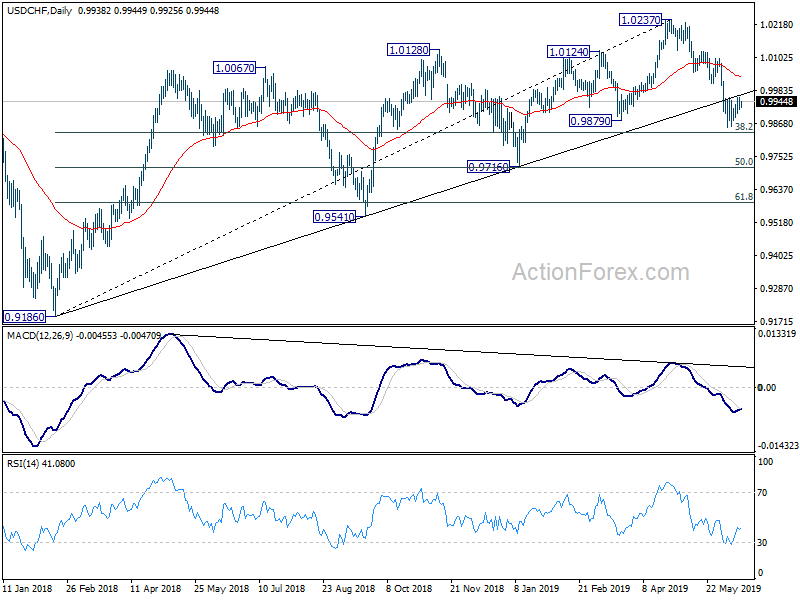
Intraday bias in USD/CHF remains neutral for the moment and consolidations from 0.9854 might extend. In case of another recovery, upside should be limited by 1.0008 support turned resistance and bring fall resumption. On the downside, break of 0.9854 will extend the decline from 1.0237 to 0.9716 cluster support (50% retracement of 0.9186 to 1.0237 at 0.9712).
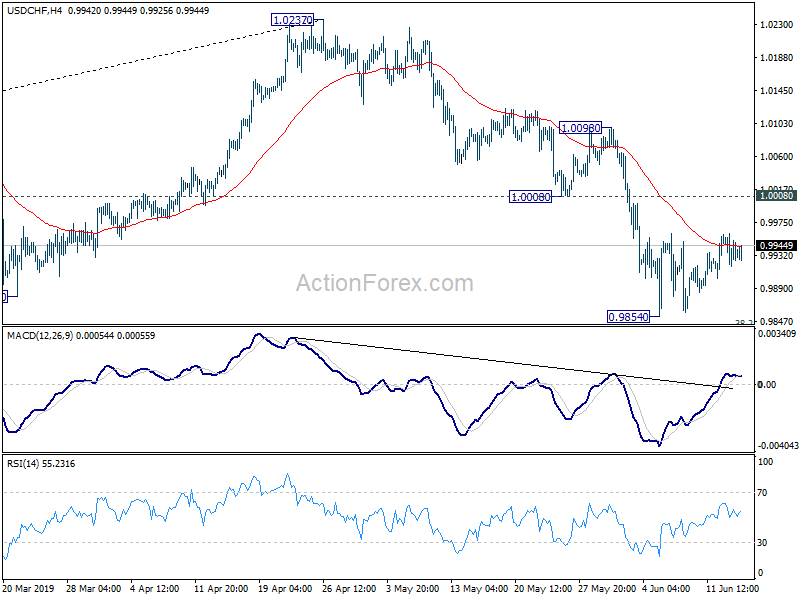
In the bigger picture, USD/CHF's break of long term trend line support is the first indication of medium term reversal. Focus is now back on 0.9879 support. Sustained break should confirm that medium term up trend from 0.9186 has completed at 1.0237 already. Further fall should be seen to 0.9716 cluster support (50% retracement of 0.9186 to 1.0237 at 0.9712) next. Break will target 61.8% retracement at 0.9587.