

Sample Category Title
Canada’s New Housing Price Index Advanced As Estimated In April
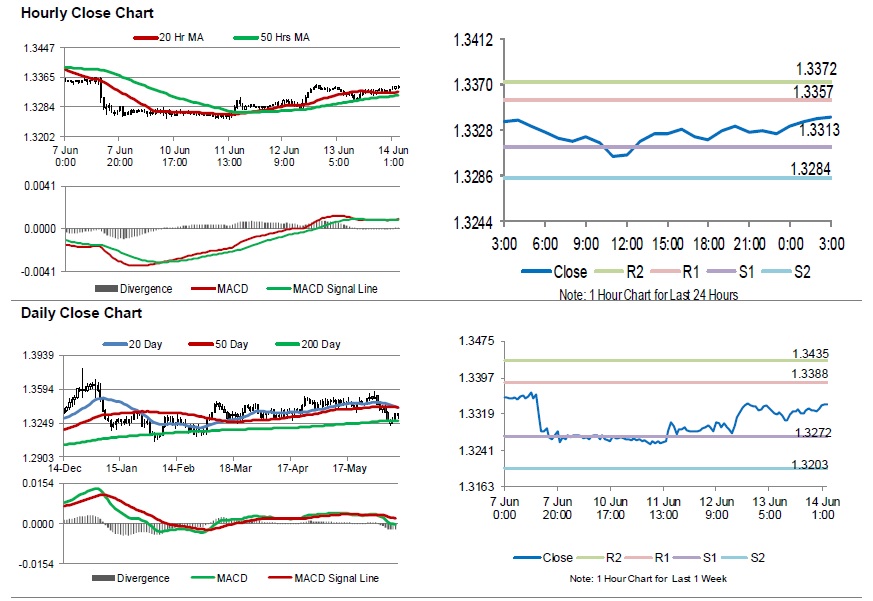
For the 24 hours to 23:00 GMT, the USD declined 0.08% against the CAD and closed at 1.3325.
Data showed that Canada's new housing price index rose 0.1% on a yearly basis in April, meeting market consensus. In the preceding month, the index had recorded a similar rise.
In the Asian session, at GMT0300, the pair is trading at 1.3341, with the USD trading 0.12% higher against the CAD from yesterday's close.
The pair is expected to find support at 1.3313, and a fall through could take it to the next support level of 1.3284. The pair is expected to find its first resistance at 1.3357, and a rise through could take it to the next resistance level of 1.3372.
Moving ahead, investors would closely monitor Canada's manufacturing shipments, existing home sales and consumer price index, slated to release next week.
The currency pair is trading above its 20 Hr and 50 Hr moving averages.
Aussie Extends Its Losses In The Morning Session
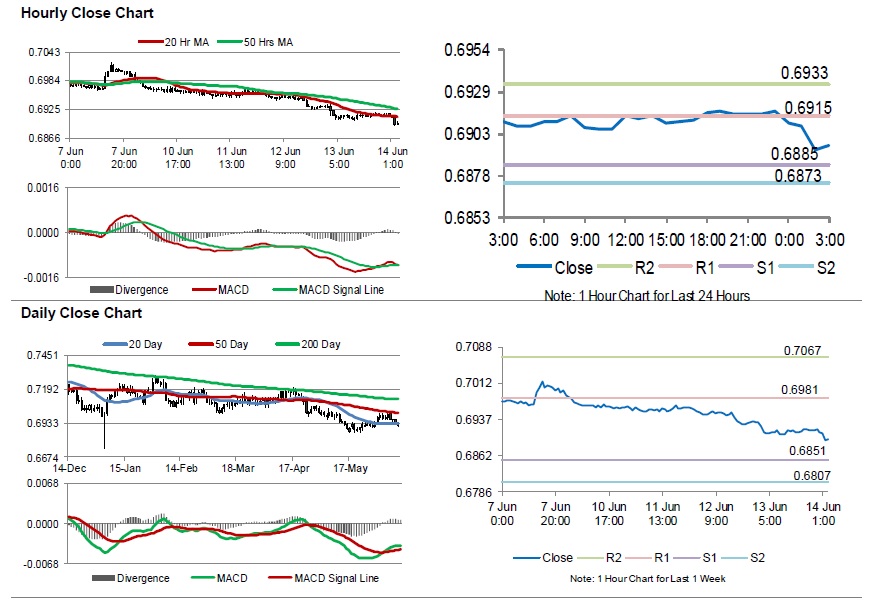
For the 24 hours to 23:00 GMT, the AUD declined 0.22% against the USD and closed at 0.6917.
LME Copper prices declined 0.5% or $31.0/MT to $5797.5/MT. Aluminium prices rose 0.1% or $2.5/MT to $1756.0/MT.
In the Asian session, at GMT0300, the pair is trading at 0.6896, with the AUD trading 0.30% lower against the USD from yesterday’s close.
The pair is expected to find support at 0.6885, and a fall through could take it to the next support level of 0.6873. The pair is expected to find its first resistance at 0.6915, and a rise through could take it to the next resistance level of 0.6933.
Going forward, traders would await the Reserve Bank of Australia’s monetary policy meeting minutes and Australia’s house price index, scheduled to release next week.
The currency pair is trading below its 20 Hr and 50 Hr moving averages.
Gold: Yellow Metal Extends Its Gains In The Morning Session
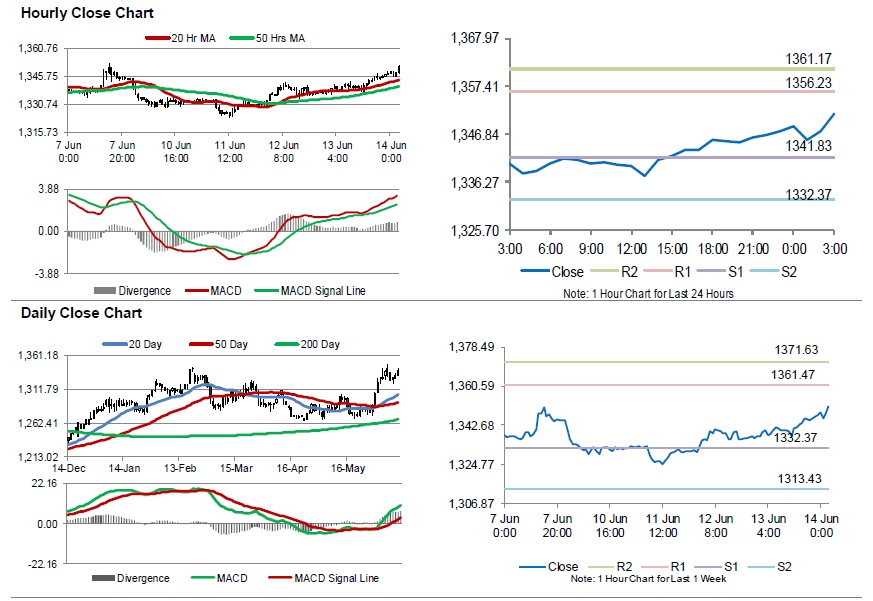
For the 24 hours to 23:00 GMT, Gold rose 0.75% against the USD and closed at USD1346.60 per ounce, amid expectations of an interest rate cut by the US Federal Reserve.
In the Asian session, at GMT0300, the pair is trading at 1351.30, with gold trading 0.35% higher against the USD from yesterday’s close.
The pair is expected to find support at 1341.83, and a fall through could take it to the next support level of 1332.37. The pair is expected to find its first resistance at 1356.23, and a rise through could take it to the next resistance level of 1361.17.
The yellow metal is trading above its 20 Hr and 50 Hr moving averages.
Silver: White Metal Trading On A Stronger Footing This Morning
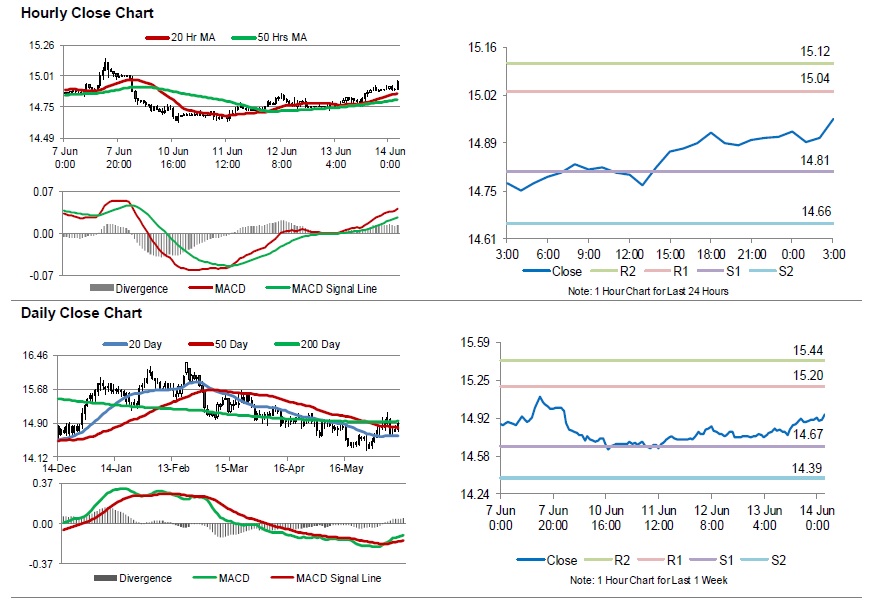
For the 24 hours to 23:00 GMT, Silver rose 1.05% against the USD and closed at USD14.91 per ounce, supported by gains in gold prices.
In the Asian session, at GMT0300, the pair is trading at 14.96, with silver trading 0.34% higher against the USD from yesterday’s close.
The pair is expected to find support at 14.81, and a fall through could take it to the next support level of 14.66. The pair is expected to find its first resistance at 15.04, and a rise through could take it to the next resistance level of 15.12.
The white metal is trading above its 20 Hr and 50 Hr moving averages.
Crude Oil: Oil Trading Higher In The Morning Session
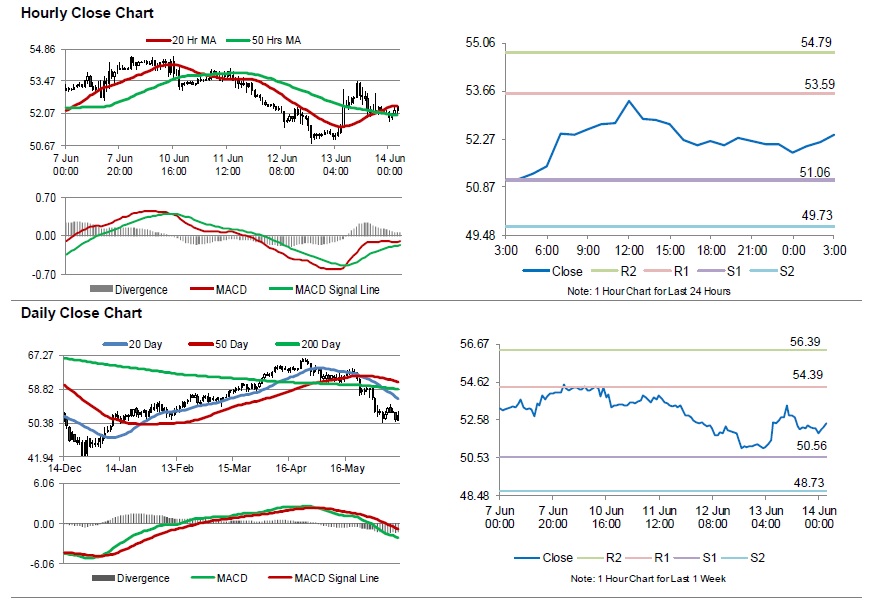
For the 24 hours to 23:00 GMT, Crude Oil rose 1.90% against the USD and closed at USD52.11 per barrel, after an attack on two oil tankers in the Gulf of Oman reignited worries about an impact to flows from the Middle East.
In the Asian session, at GMT0300, the pair is trading at 52.40, with oil trading 0.56% higher against the USD from yesterday’s close.
The pair is expected to find support at 51.06, and a fall through could take it to the next support level of 49.73. The pair is expected to find its first resistance at 53.59, and a rise through could take it to the next resistance level of 54.79.
Crude oil is showing convergence with its 20 Hr and 50 Hr moving averages.
SNB Maintained Pledge to Intervene FX Market if SNF Too Strong. Question is How to React if Fed and...
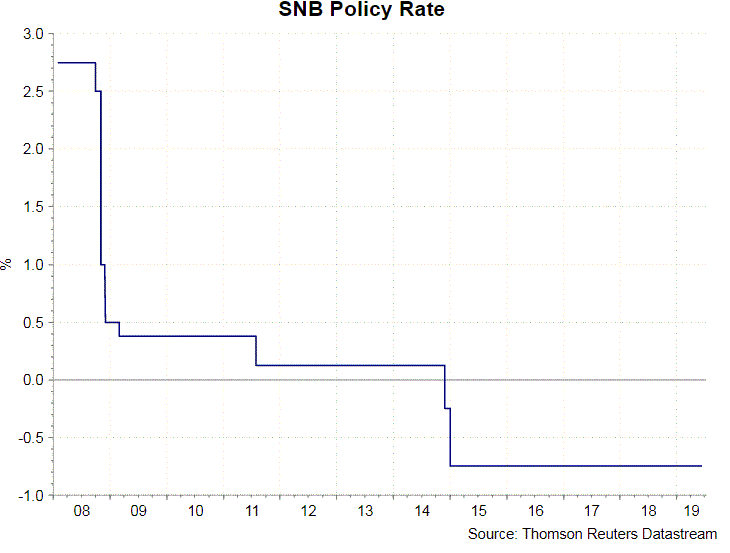
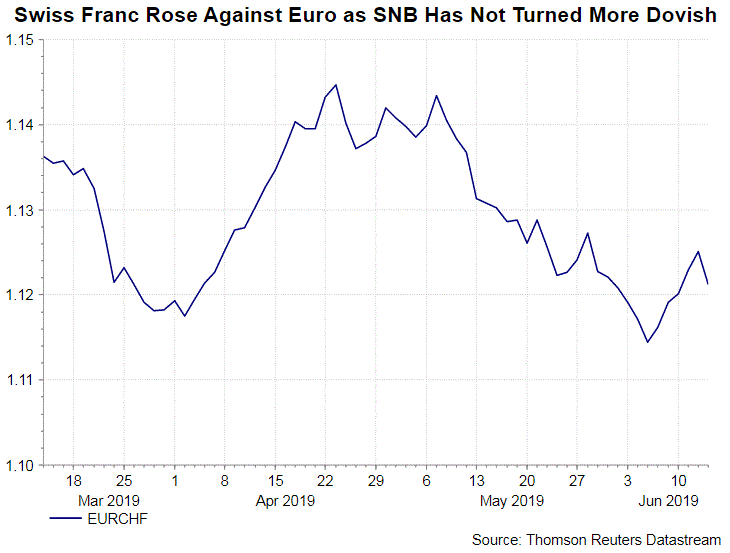
In its quarterly meeting, SNB announced to leave the policy rate – the interest rate on sight deposits, unchanged at -0.75%. On a technical change, the central bank introduced a new benchmark – the SNB policy rate- in replacement of the 3-month LIBOR. The members acknowledged recent strength in Swiss franc, attributing it to safe haven demand amidst uncertainty in the US-China trade war. The central bank reiterated the stance to maintain the exceptionally low interest rate and intervene in the currency market when needed. Despite foreseeing greater downside risk, SNB has not revised lower its GDP growth forecasts. For inflation, it slightly upgraded the projection for 2020 but downgraded it for 2021.The overall tone is not much dovish than the previous one. This is likely a reason for the strength of Swiss franc against the Euro after the announcement.
Trade War Uncertainty Led to Stronger Franc
At the meeting, SNB announced a new policy rate to replace the previous benchmark of 3-month LIBOR, as UK’s Financial Conduct Authority will only ensure LIBOR is maintained through to the end of 2021. We believe this is merely a technical adjustment. The central bank noted that escalation of US-China trade ward has raised demand for safe haven asset, leading to recent appreciation in Swiss franc. At the press conference, Governor Thomas Jordan indicated that “when the trade dispute between the U.S. and China escalated again in May, the Swiss franc and the Japanese yen appreciated” as “both currencies are sought as safe havens in periods of uncertainty”. He reiterated that “willingness to intervene remains necessary” in light of “the high valuation of the franc and the fragility of the situation”. At the policy statement, SNB again pledged to “remain active in the foreign exchange market as necessary, while taking the overall currency situation into consideration”.
Economic Outlook
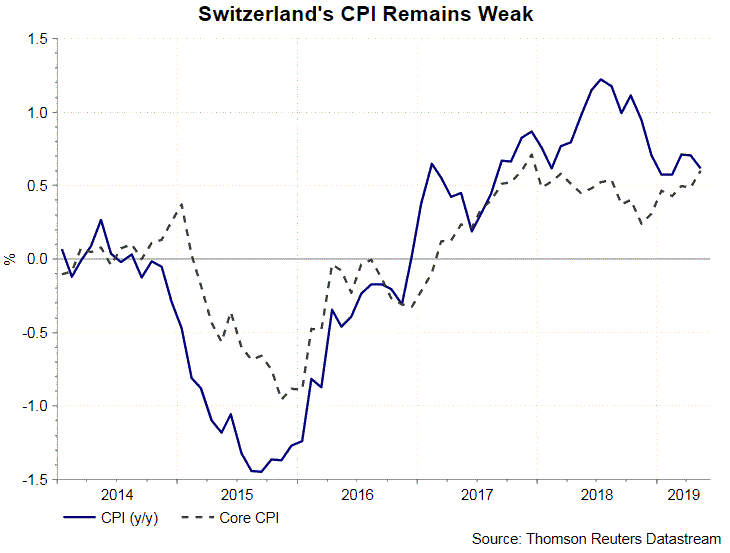
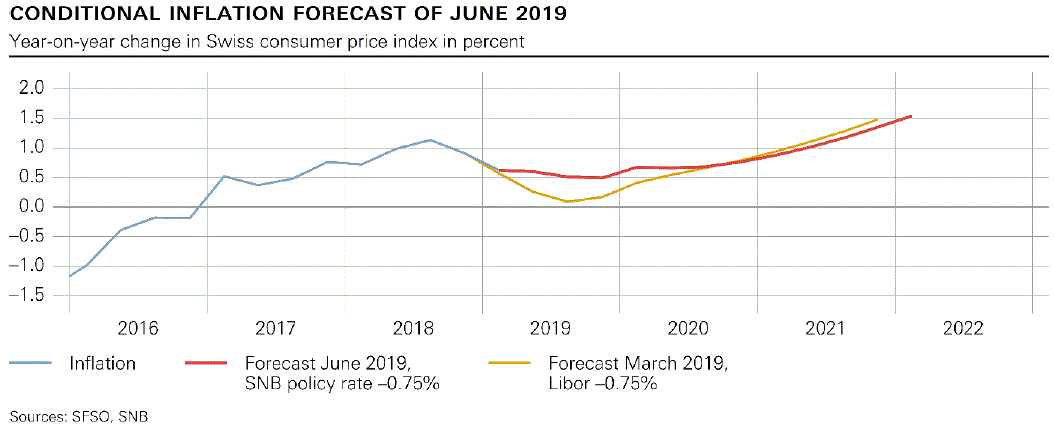
On the economic outlook, SNB foresaw more downside risk, warning that “an unexpectedly sharp slowdown internationally would quickly spread to Switzerland”. Yet, it maintained the estimate that economy would grow by around +1.5% this year. On inflation, the forecast for 2019 was revised higher to +0.6% y/y from +0.3% previously. This is to reflect the “rise in the prices of imported goods”. Inflation forecast for 2020 is also revised slightly higher to +0.7% y/y from March’s +0.6%. Yet, the forecast for 2021 take lower to +1.1% y/y, compared with +1.2% projected in March.
What Next?
Our concern is what action SNB can take if Fed and EUR ease further. We believe SNB would first intervene the currency market to stabilize Swiss franc. If this is not enough, the central bank would be obliged to cut interest further. However, SNB, like ECB, has already been adopting negative interest rates for years. SNB has to consider the impacts of negative interest rates on the profitability of the banking sector.
Elliott Wave View: Apple (AAPL) Has Started Correction
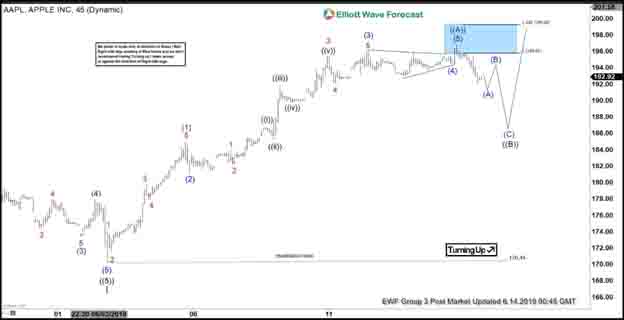
Short Term Elliott wave view in Apple (AAPL) is calling the decline to 170.44 on June 4 as wave I. Wave II bounce is currently in progress to correct cycle from June 4 low as a zigzag Elliott Wave structure. Up from 170.44, Wave ((A)) of II has ended at 196.79 as a 5 waves impulse. Wave (1) ended at 184.99 and wave (2) pullback ended at 181.14. Wave (3) ended at 196, wave (4) ended at 194.57, and wave (5) ended at 196.79.
The stock is pulling back in wave ((B)) in 3, 7, or 11 swing to correct cycle from June 4 low. The internal of wave ((B)) is unfolding as a zigzag Elliott Wave structure where wave (A) of ((B)) should end with 1 more push lower. Afterwards, expect the stock to bounce in wave (B) followed by another leg lower in wave (C). Then as far as pivot at 170.44 low stays intact, the stock should resume the rally again. We don’t like selling the stock and expect buyers to appear in 3, 7, or 11 swing provided pivot at 170.44 low is holding.
Apple (AAPL) 1 Hour Elliott Wave Chart
GBP/USD And EUR/GBP: British Pound Facing Uphill Task
GBP/USD remained in a bearish zone and recently declined below the 1.2700 support. EUR/GBP is placed in an uptrend above 0.8880 and it could continue to move higher.
Important Takeaways for GBP/USD and EUR/GBP
- The British Pound declined below the 1.2720 and 1.2700 support levels.
- There is a connecting bullish trend line forming with support near 1.2665 on the hourly chart of GBP/USD.
- EUR/GBP traded higher and recently tested the 0.8920 resistance area.
- There is a key bullish trend line forming with support near 0.8885 on the hourly chart.
GBP/USD Technical Analysis
The British Pound failed to gain pace above the 1.2760 resistance on more than two occasions against the US Dollar. As a result, the GBP/USD pair started a major decline and broke the 1.2720 support area.
The decline was such that the pair even broke the 1.2700 support and the 50 hourly simple moving average. It traded as low as 1.2662 on FXOpen before starting an upside correction.
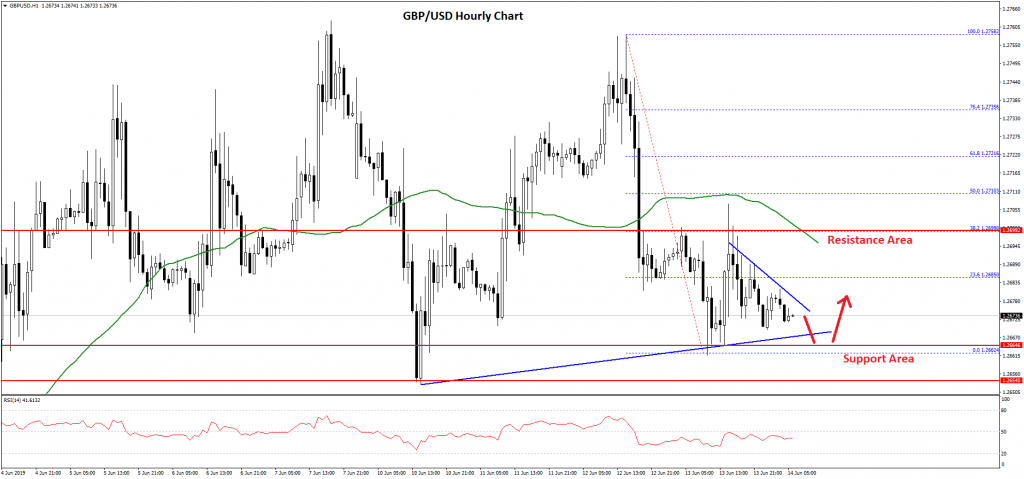
It recovered above the 1.2680 level and the 23.6% Fib retracement level of the latest drop from the 1.2758 high to 1.2662 low. However, the upward move was capped by the 1.2700 resistance area.
Moreover, the 38.2% Fib retracement level of the latest drop from the 1.2758 high to 1.2662 low acted as a strong resistance. The pair is now back below 1.2680 and it is likely to extend losses.
On the downside, there is a connecting bullish trend line forming with support near 1.2665 on the hourly chart of GBP/USD. If there is a break below the trend line support, the pair could extend losses below the 1.2660 and 1.2650 support levels.
Conversely, if the pair starts a decent recovery, it could surpass the 1.2685 and 1.2700 resistance levels. The next key resistance for GBP/USD could be near the 1.2720 level.
EUR/GBP Technical Analysis
The Euro remained in a positive zone above the 0.8800 support area against the British Pound. The EUR/GBP pair traded above the 0.8850 and 0.8860 resistance levels to move into a positive zone.
The pair even settled above the 0.8880 level and the 50 hourly simple moving average. It even spiked above 0.8900 and the last swing high was formed near 0.8919 before the pair started a downside correction.
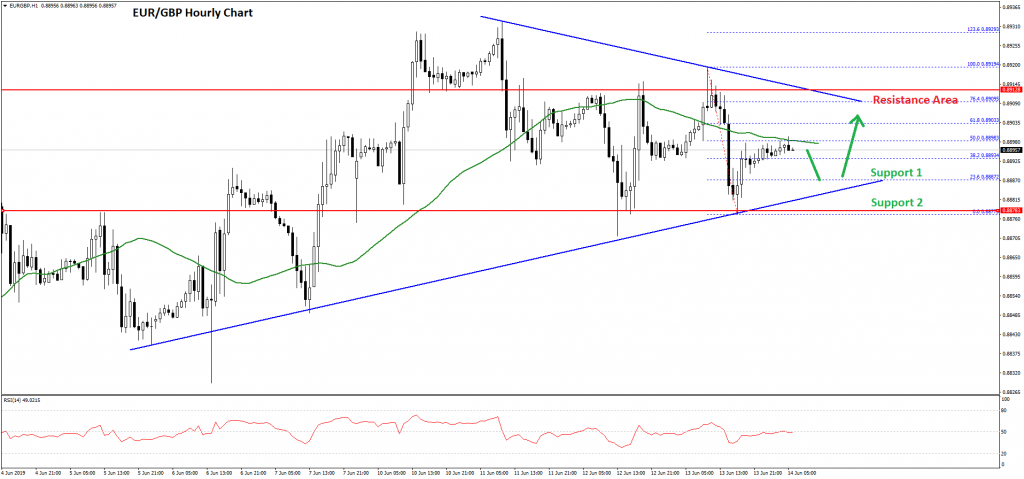
It tested the 0.8880 support area and recently climbed back above 0.8890 plus the 23.6% Fib retracement level of the recent drop from the 0.8919 high to 0.8877 swing low.
However, the upward move is currently capped by the 0.8900 level and the 50 hourly simple moving average. Moreover, the 50% Fib retracement level of the recent drop from the 0.8919 high to 0.8877 swing low is acting as a resistance.
If there is an upside break, the next resistance is near the 0.8910 level and a connecting bearish trend line. If there are further upsides above 0.8910 and 0.8920, the pair could test 0.8950.
On the downside, there is a key bullish trend line forming with support near 0.8885 on the hourly chart. If EUR/GBP breaks the trend line support and 0.8880, there might be a sharp downside correction in the near term. The next main support for the bulls is near 0.8850, where sellers are likely to struggle.
Market Morning Briefing: Dollar-Yen Is Stuck In A Narrow Range
STOCKS
Global equities have bounce yesterday thereby keeping our positive view intact. Dow and DAX can rise further and remains bullish in the near term. Nikkei has a key resistance ahead which has to be broken to extend the upmove. Shanghai remains mixed within its sideways range. Sensex and Nifty is also expected to remain sideways for some time.
As expected, the support at 26000 has held well and the Dow (26106.77, +101.94, +0.39%) has bounced. The bullish outlook is intact. Resistance at 26250 can be tested now, a break above which will pave way for 26500-26600
DAX (12115.68, -40.13, -0.33%) keeps our bullish view intact for a rise to 12300. Key supports are at 12070, 12035 and 12000.
Nikkei (21073.05 +41.05 +0.20%) has bounced above 21000 again. But it has to breach 21250 decisively to gain bullish momentum and target 21500 and 21750 While below 21250, the possibility of a fall to 20750 and 20700 cannot be ruled out.
Shanghai (2912.41 +1.67 +0.06%) oscillates around 2900 and remains mixed in the near term. The 2835-2950 sideways range remains intact and a breakout on either side of this range will give a clear view on the next direction of move.
Sensex (39741.36, -15.45, -0.04%) and Nifty (11914.05, +7.85, +0.07%) fell as expected yesterday to test the lower end of their respective range and has bounced sharply. The indices are likely to remain in the sideways range of 39300-40300 (Sensex) and 11800-12200 (Nifty).
COMMODITIES
Gold and Silver has risen sharply and has room for further rise. However, key resistances are coming up for them which will decide whether the current upmove will sustain or not. Copper continues to consolidate. Oil has spiked on reports of tanker attacks in Gulf of Oman. Brent and WTI can consolidate sideways for sometime before resuming their overall downtrend.
Gold (1343) has risen as expected and is heading towards 1350. Whether gold breaks above 1350 or not will be crucial. A break above 1350 can take it further higher to 1360 and will avoid a fall-back to 1320 levels.
Though Silver (14.94) has risen sharply. The key resistance at 15 is likely to be broken if the current momentum continues and the upmove can extend to 15.15.
Copper (2.65) can continue to consolidate between 2.60 and 2.68. Within this range, a dip to 2.62-2.60 is likely in the near term.
Brent (61.52) spiked above 62 contrary to our expectation for a fall and has come-off slightly. While above 61, there is room for a rise to 63 and 64 in the coming days. Broadly, a sideways consolidation between 59.5 and 64 looks possible before a fresh leg of downmove begins.
Similarly, WTI (52.22) can consolidate between 50.5 and 55 for some time before the overall downtrend resumes targeting 47 and 45.
FOREX
Dollar sustains higher and has room for further upmove. The Euro is coming closer to a key support which is likely to hold and trigger a bounce. Dollar-Yen remains bearish while the Pound retains its sideways range. Dollar-Rupee has room for a rise to 69.70-69.75 on a break above 69.55.
Dollar Index (97.03) sustains higher and remains bullish for a rise to 97.5 and 98. A break above 97.10 can accelerate the upmove. Support is in the 96.85-96.80 region.
Euro (1.1277) has dipped to test the 1.1270-1.1260 support region as expected. We expect a bounce to 1.1310-1.1340 from this support zone. But a break below 1.1260 will negate the bounce to 1.1310-1.1340 and take the Euro lower to 1.1225.
Dollar-Yen (108.26) is stuck in a narrow range. Our view remains the same. The outlook is bearish to test 107. A break below 108 can intensify the pace of fall. Key resistances are at 108.5 and 109.
Euro-Yen (122.17) is hovering above its key support level of 122 which we expect to hold and trigger a bounce to 124. But, break below 122 will prove our bullish view wrong and drag it to 121. So Dollar-Yen needs a watch as a sharp fall below 108 in it could drag the Euro-Yen also lower.
As expected, Aussie (0.6907) tested 0.6900 yesterday. An intermediate bounce to 0.6930-0.6940 is possible from the immediate support level of 0.6890. But the downtrend is likely to remain intact and Aussie can break below 0.6890 and target 0.6850 and 0.6800 in the coming weeks.
Pound (1.2675) retains its 1.2650-1.2750 sideways range continues to hover around the lower end of this range. We expect this sideways range to remain intact for some more time.
USDCNY (6.9221) has been inching higher and can move up to 6.93-6.94 in the near term. As mentioned yesterday the pair can consolidate 6.90 and 6.94 in the near-term. The bias is bullish to see a break above 6.94 and rally to 6.98 and 7.0 over the medium term .
USDINR (69.5150) can rise to 69.70-69.75 on a break above the immediate resistance at 69.55. Also since the pair has been holding well above 69.25 we may have to allow for a test of even 70 on the upside going forward.
INTEREST RATES
The US yields have dipped further. As mentioned yesterday, the corrective bounce in the yields seems to have come to an end. The 30Yr (2.59%) can fall to 2.50% while it remains below 2.60%. The 10Yr (2.09%) and 5Yr (1.83%) can test 2.0% and 1.75% respectively while they remain below 2.10% and 1.90% respectively.
The 30Yr (0.35%) German yield has dipped slightly while the 10Yr (-0.24%) 5Yr (-0.60%) remains stable. The near-term view is positive. As mentioned yesterday, the 30Yr can rise to 0.50% on a break above 0.40%. The 10Yr can test -0.10% on a break above -0.20% while the 5Yr can rise to -0.50%.
The 10YR GOI (7.1688%) has immediate resistance at 7.20%. While below this resistance a dip to 7.10% is possible in the near term.
USD/JPY Likely To Face Resistance Near 109.00
Key Highlights
- The US Dollar found support near 107.80 and recovered recently against the Japanese Yen.
- A key bearish trend line is forming with resistance near 108.85 on the 4-hours chart of USD/JPY.
- The US Initial Jobless Claims for the week ending June 08, 2019 increased from 219K to 222K.
- The US Retail Sales in May 2019 could increase 0.6% (MoM), better than the last -0.2%.
USDJPY Technical Analysis
The US Dollar remained well bid above 108.00 and recently recovered against the Japanese Yen. The USD/JPY pair broke the 108.40 level, but there are many hurdles for the bulls on the upside.
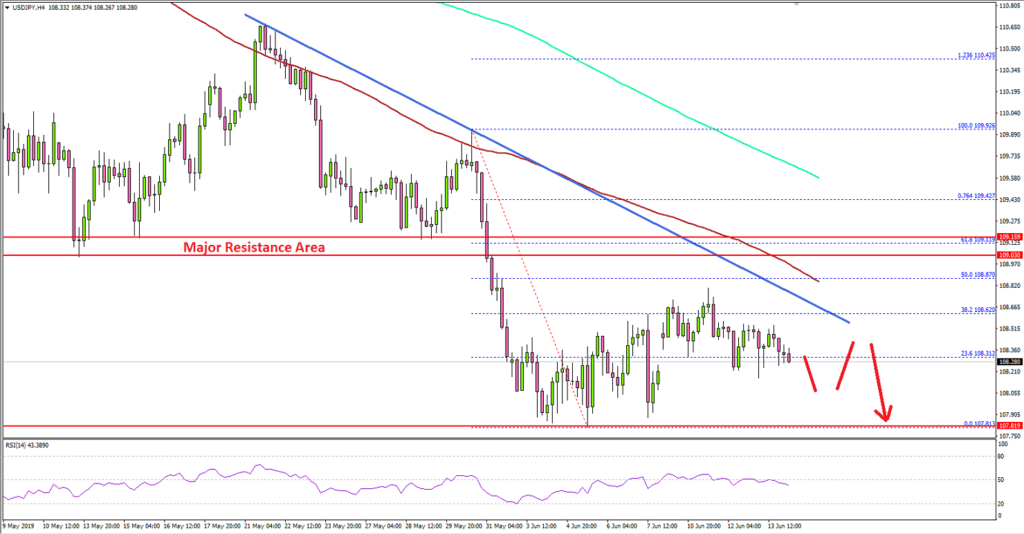
Looking at the 4-hours chart, the pair traded as low as 107.81 and recently traded above 108.20 and 108.50. There was even a spike above the 38.2% Fib retracement level of the last slide from the 109.92 high to 107.81 low.
However, the upward move was capped by the 108.80 resistance area. Moreover, there is a key bearish trend line forming with resistance near 108.85 on the same chart.
Above the trend line, the next resistance is near the 108.90 level, and the 50% Fib retracement level of the last slide from the 109.92 high to 107.81 low. The main resistance is at 109.00 and the 100 simple moving average (red, 4-hours).
If there is a successful break above 109.00, USD/JPY might start a strong increase towards the 110.00 level. Conversely, if the pair fails to clear 108.85 or 109.00, there could be a downside reaction below 108.20.
Fundamentally, the US Initial Jobless Claims figure for the week ending June 08, 2019 was released by the US Department of Labor. The market was looking for a minor decline in claims from 218K to 216K.
The actual result was disappointing, as the US Initial Jobless Claims increased to 222K. Moreover, the last reading was revised up from 218K to 219K.
The report stated that:
The 4-week moving average was 225,500, an increase of 2,750 from the previous week’s revised average. The previous week’s average was revised up by 500 from 222,250 to 222,750.
Overall, USD/JPY is facing many hurdles near the 108.85 and 109.00 levels. Therefore, further upsides in the short term are very unlikely. Looking at EUR/USD, the pair is trading well above the 1.1220 support area, whereas GBP/USD is facing a strong resistance near 1.2750.
Economic Releases to Watch Today
- US Retail Sales May 2019 (MoM) – Forecast +0.6%, versus -0.2% previous.
- US Industrial Production May 2019 (MoM) – Forecast +0.2%, versus -0.5% previous.