Sample Category Title
GBP/USD Daily Outlook
Daily Pivots: (S1) 1.2661; (P) 1.2710; (R1) 1.2738; More....
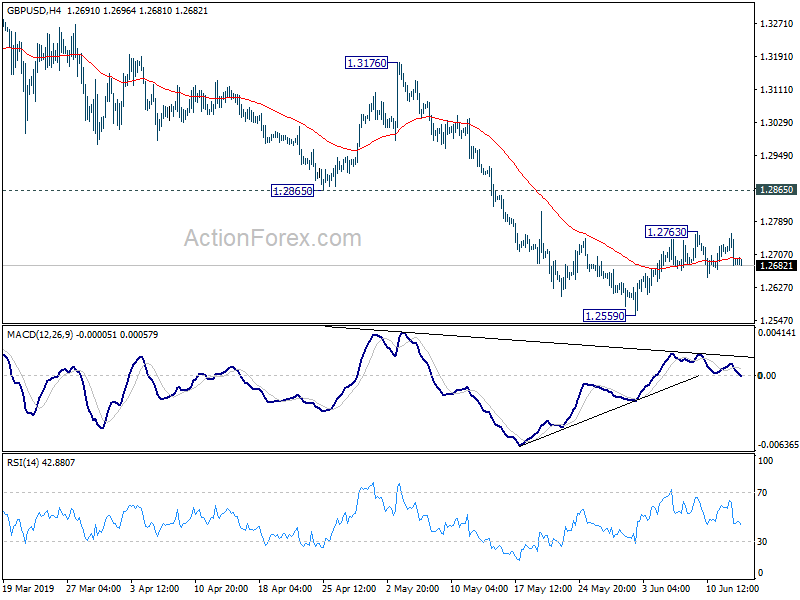
Intraday bias in GBP/USD remains neutral at this point. On the upside, break of 1.2763 will extend the corrective rise from 1.2559. But in that case, upside should be limited by by 1.2865 support turned resistance to bring fall resumption eventually. On the downside, break of 1.2559 low will extend the decline from 1.3381 for 1.2391 low first.
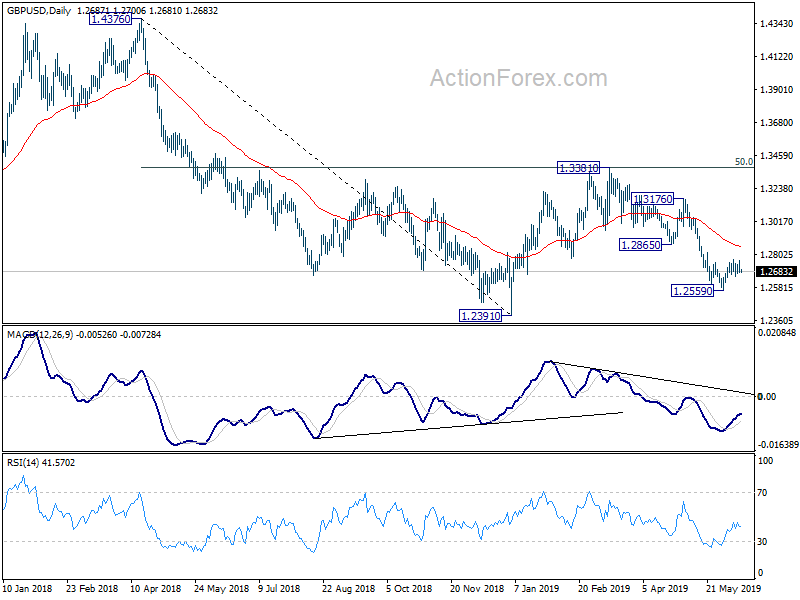
In the bigger picture, medium term decline from 1.4376 (2018 high) is possibly ready to resume. Decisive break of 1.2391 would target a test on 1.1946 long term bottom (2016 low). For now, we don't expect a firm break there yet. Hence focus will be on bottoming signal as it approaches 1.1946. In any case, medium term outlook will stay bearish as long as 1.3381 resistance holds, in case of strong rebound.
USD/CHF Daily Outlook
Daily Pivots: (S1) 0.9919; (P) 0.9940; (R1) 0.9976; More...
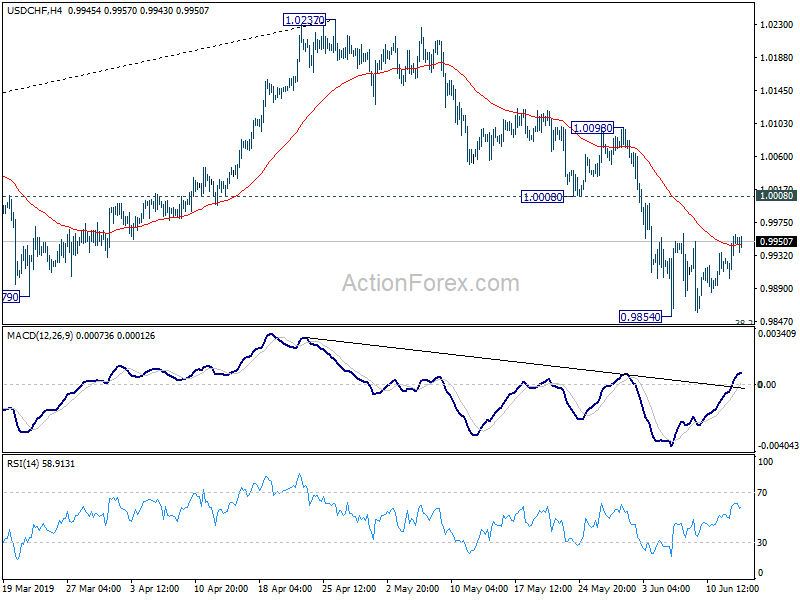
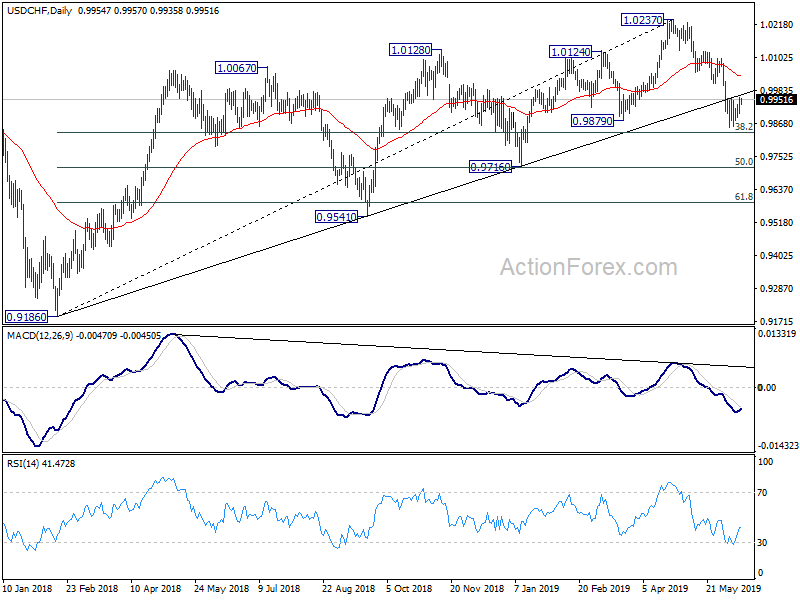
Outlook in USD/CHF remains unchanged as consolidation from 0.9854 is extending. Intraday bias remains neutral at this point. In case of another recovery, upside should be limited by 1.0008 support turned resistance and bring fall resumption. On the downside, break of 0.9854 will extend the decline from 1.0237 to 0.9716 cluster support (50% retracement of 0.9186 to 1.0237 at 0.9712).
In the bigger picture, USD/CHF's break of long term trend line support is the first indication of medium term reversal. Focus is now back on 0.9879 support. Sustained break should confirm that medium term up trend from 0.9186 has completed at 1.0237 already. Further fall should be seen to 0.9716 cluster support (50% retracement of 0.9186 to 1.0237 at 0.9712) next. Break will target 61.8% retracement at 0.9587.
USD/JPY Daily Outlook
Daily Pivots: (S1) 108.29; (P) 108.43; (R1) 108.65; More...
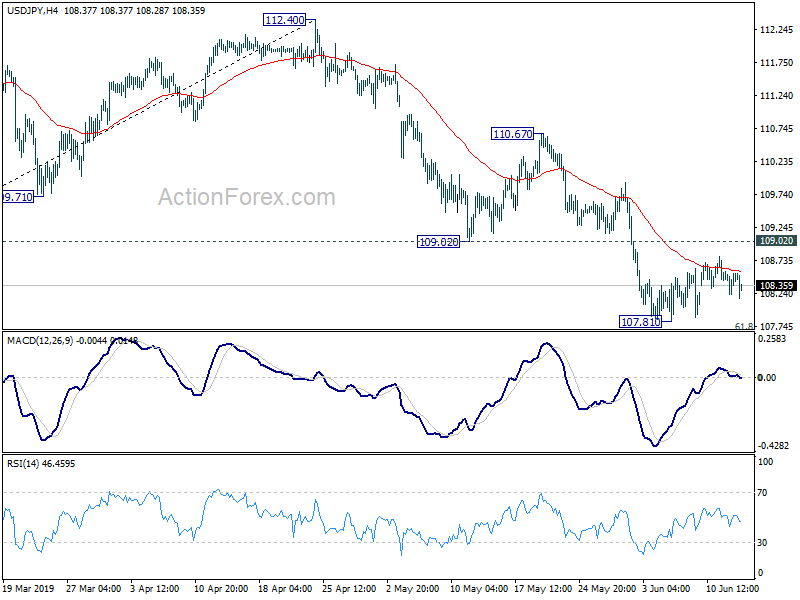
Outlook in USD/JPY remains unchanged as consolidation from 107.81 is extending. Intraday bias remains neutral first. Upside of recovery should be limited by 109.02 support turned resistance to bring fall resumption. On the downside, sustained break of 61.8% retracement of 104.69 to 112.40 at 107.63 will pave the way back to 104.62/9 key support zone. Though, break of 109.02 support turned resistance will indicate short term bottoming and bring lengthier consolidations first.
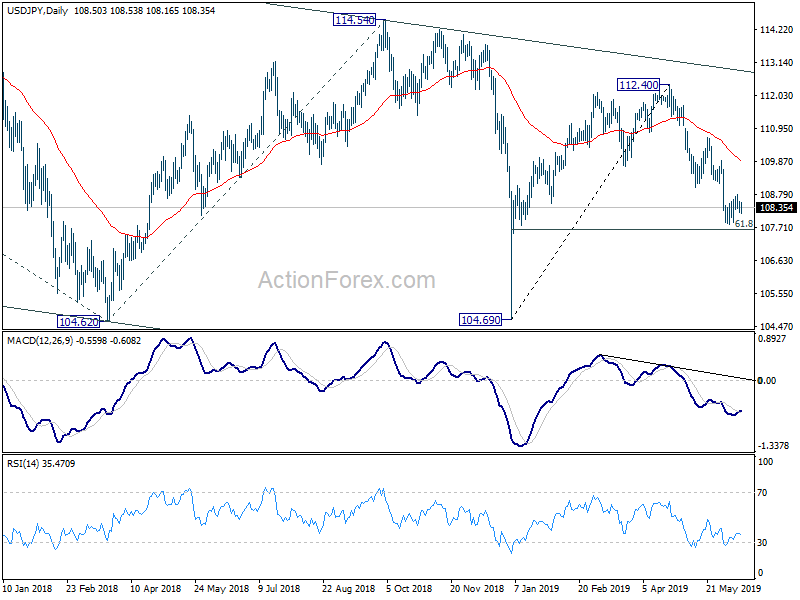
In the bigger picture, decline from 118.65 (Dec 2016) is still in progress, with the pair staying indicate long term falling channel. Break of 104.62 will target 100% projection of 118.65 to 104.62 from 114.54 at 100.51. For now, we'd expect strong support above 98.97 (2016 low) to contain downside to bring rebound.
Elliott Wave View: Dow Jones Futures Correction To Find Buyers
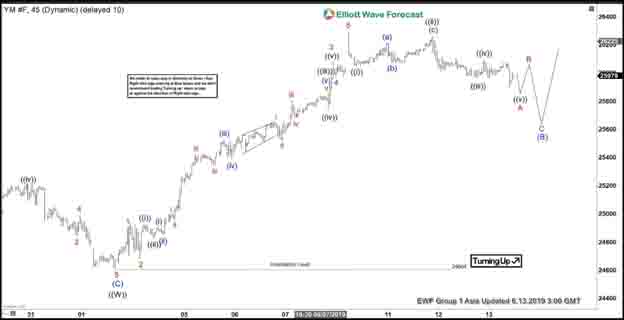
Elliott wave view in Dow Jones Futures (YM_F) suggests that the decline to 24604 ended wave ((W)) on June 3. This decline ended the cycle from May 1 high as a 3 waves zigzag Elliott Wave structure. Wave ((X)) bounce is currently in progress to correct the cycle from May 1 high in 3, 7, or 11 swing. The internal of wave ((X)) rally is unfolding as a zigzag Elliott Wave structure. A zigzag is an ABC with 5-3-5 structure. Wave (A) of ((X)) is now in progress as a 5 waves impulse.
Up from 24604, wave 1 ended at 24938 and wave 2 pullback ended at 24684. Rally then resumes in wave 3 to 26085, wave 4 ended at 25974, and wave 5 ended at 26289. The 5 waves move higher ended wave (A) of higher degree. Short term, Index is in wave B pullback to correct cycle from June 3 low (24604) in 3, 7, or 11 swing before turning higher again in wave (C). We don’t like selling the Index. As the rally from June 3 low is impulsive, expect wave (B) pullback to hold above 24604 for at least 1 more push higher in wave (C).
Dow Jones Futures (YM_F) 1 Hour Elliott Wave Chart
Asian Stocks Ease Up On Risk-On Mode, As Trump Repeats Germany Criticism
With Asian stocks following Wall Street lower on Thursday, the US-China trade tensions appear to have knocked the wind out of risk-on sails for now. Equity investors have been left to float aimlessly as they await a new gust of developments that could signal the next direction for global markets.
US President Donald Trump isn't easing up on the tensions with major economies, as he reiterated criticisms against Germany over defense spending and its gas pipeline with Russia. Markets are having to grow accustomed to heightened global tensions, where risk sentiment remains easily swayed by the prospects of further deterioration in relations between major economies. Should Trump's sharp rhetoric translate meaningfully into more downside risks for global trade, that is sure to deal another significant blow to the already fragile market sentiment, which could trigger another sell-off in risk assets.
Oil drops as tensions rise within OPEC+ amid waning global demand outlook
Brent futures are testing the psychological $60/bbl mark, after shedding some 5.5 percent over three consecutive days of declines. This is fuelled by concerns over rising US stockpiles, amid a backdrop of heightened US-China trade tensions that risk dragging global growth lower. Markets are hoping that the slump in Oil prices will be enough for OPEC+ members to overcome tensions within the group and collectively focus on the task at hand - to rebalance global markets and put a floor under Oil prices.
Oil's recent decline indicates that OPEC+ producers may have little choice but to extend its ongoing supply cuts programme going into the second half of the year. Should global demand shrink further despite the supply cuts extension,this may result in a marked return of oversupplied conditions which could see Oil unwind the remnants of its year-to-date gains.
UK leadership transition to add more uncertainty to Pound's outlook
The Pound has been drifting along the 1.27 level against the US Dollar since last week, with investors awaiting the next chapter in the UK's political saga, as the first of several rounds of votes are cast on Thursday in the Conservative Party's quest to find Theresa May's replacement. The UK leadership transition adds another layer of uncertainty over Sterling's outlook until the new Prime Minister is appointed, potentially by the end of July.
Should markets get the sense that a hard line Brexiteer has the likelier chance of taking over at 10 Downing Street, such expectations could see GBPUSD test the 1.244 level, with stronger support potentially arriving at the psychological 1.20 mark. It remains to be seen how the new PM will overcome the challenges that May faced in passing a Brexit deal that was palatable to all stakeholders, with such uncertainties ensuring that the Pound remains politically sensitive leading up to the October 31 Brexit deadline, where a no-deal Brexit remains the “worst-case” scenario for markets.
USD/CAD Daily Outlook
Daily Pivots: (S1) 1.3297; (P) 1.3321; (R1) 1.3369; More...
USD/CAD is staying in consolidation from 1.3239 and intraday bias remains neutral for the moment. Upside of recovery should be limited by 1.3363 support turned resistance to bring fall resumption. Choppy rise from 1.3068 has completed at 1.3564 already. Fall from 1.3564 is likely resuming the decline from 1.3664 medium term top. Break of 1.3239 will turn bias back to the downside for 1.3052/68 cluster support. However, sustained break of 1.3363 will mix up the near term outlook and bring stronger rebound first.
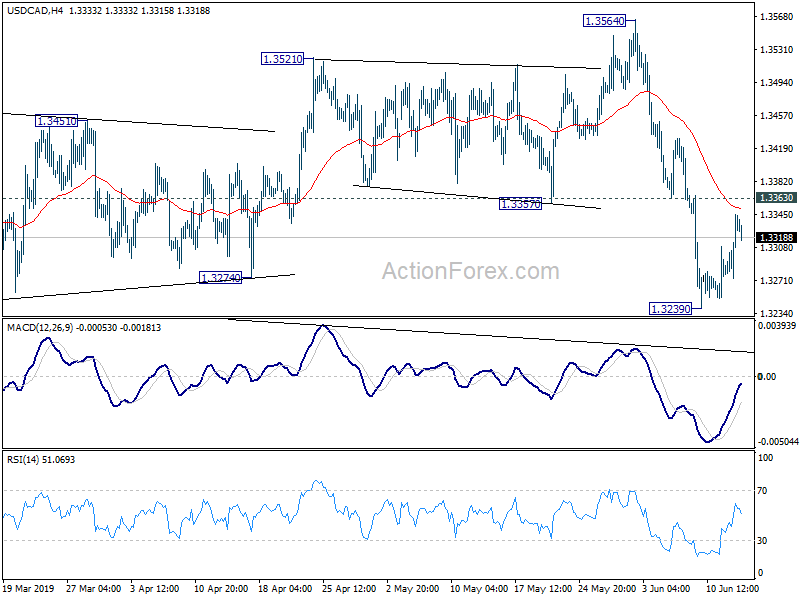
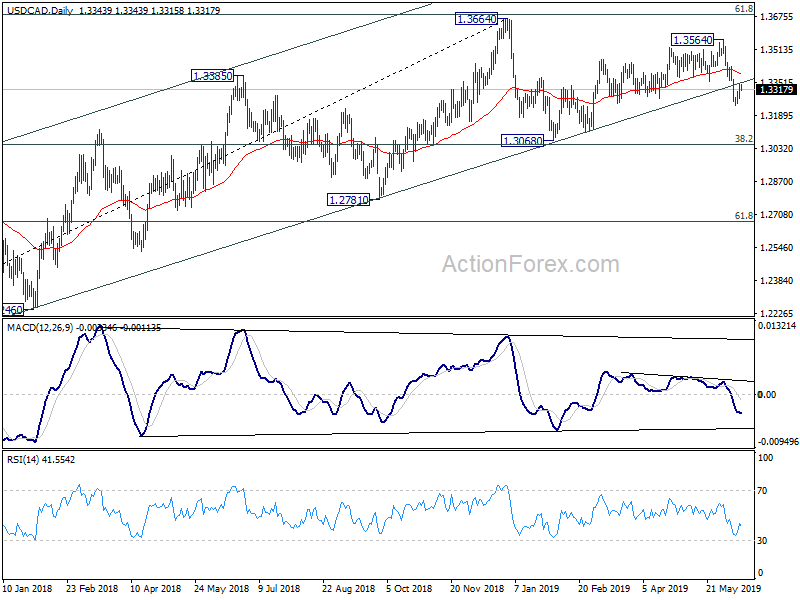
In the bigger picture, the strong break of medium term channel support now argues that up trend from 1.2061 (2017 low) has completed at 1.3664 (2018 high), just ahead of 61.8% retracement of 1.4689 (2016 high) to 1.2061 at 1.3685, and 1.3793 resistance. Decisive break of 1.3068 cluster support (38.2% retracement of 1.2061 to 1.3664 at 1.3052) will confirm and pave the way to 61.8% retracement at 1.2673 next. For now, risk will remain on the downside as long as 1.3564 resistance holds, even in case of strong rebound.
Euro Trading Flat In The Asian Session
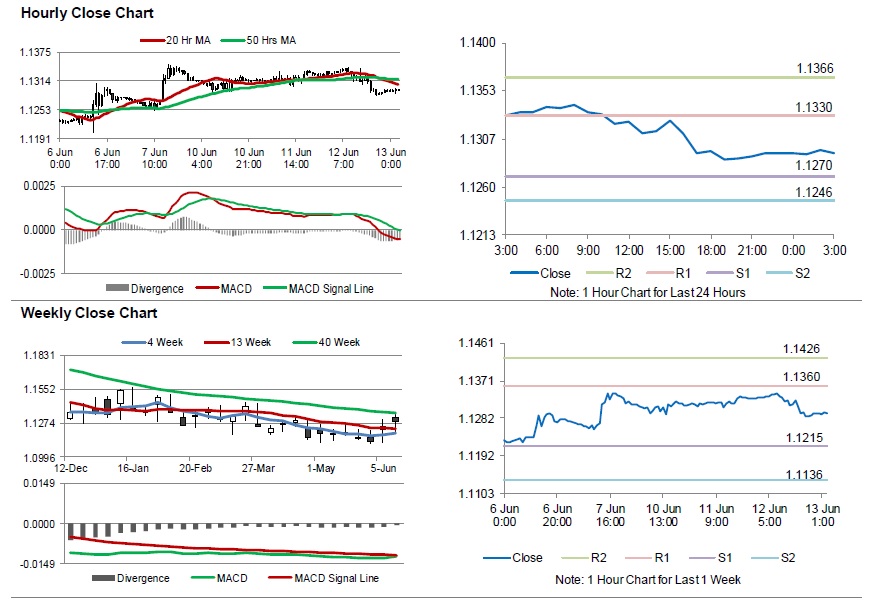
For the 24 hours to 23:00 GMT, the EUR declined 0.31% against the USD and closed at 1.1293.
In the US, data showed that the consumer price index (CPI) advanced 1.8% on a yearly basis in May, falling short of market anticipation for a rise of 1.9%. In the previous month, the CPI had climbed 2.0%. Moreover, the US mortgage applications surged 26.8% on a weekly basis in the week ended 07 June 2019, following a gain of 1.5% in the previous week.
In the Asian session, at GMT0300, the pair is trading at 1.1293, with the EUR trading flat against the USD from yesterday’s close.
The pair is expected to find support at 1.1270, and a fall through could take it to the next support level of 1.1246. The pair is expected to find its first resistance at 1.1330, and a rise through could take it to the next resistance level of 1.1366.
Moving ahead, traders would keep an eye on Euro-zone’s industrial production for April and Germany’s consumer price index for May, slated to release in a few hours. Later in the day, the US initial jobless claims, will be on investor’s radar.
The currency pair is trading below its 20 Hr and 50 Hr moving averages.
UK’s RICS House Price Balance Climbed In May
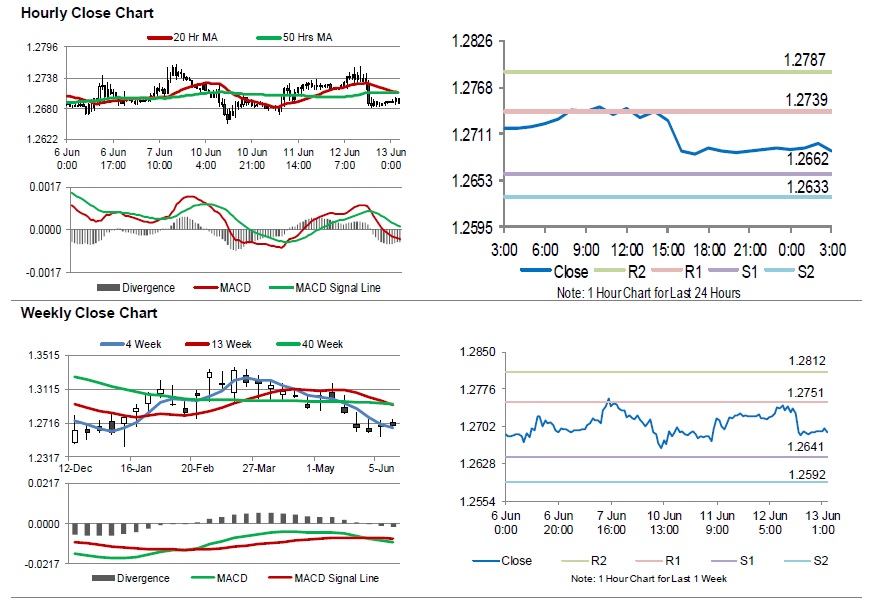
For the 24 hours to 23:00 GMT, the GBP declined 0.24% against the USD and closed at 1.2693.
In the Asian session, at GMT0300, the pair is trading at 1.2690, with the GBP trading slightly lower against the USD from yesterday's close.
Overnight data showed that UK's RICS house price balance climbed to -10.0% in May, compared to market consensus for of a rise to -21.0%. In the prior month, house price balance had registered a revised reading of -22.0%.
The pair is expected to find support at 1.2662, and a fall through could take it to the next support level of 1.2633. The pair is expected to find its first resistance at 1.2739, and a rise through could take it to the next resistance level of 1.2787.
Amid lack of economic releases in UK today, traders would focus on global macroeconomic events for further direction.
The currency pair is trading below its 20 Hr and 50 Hr moving averages.
Japanese Yen Extends Its Gains In The Asian Session
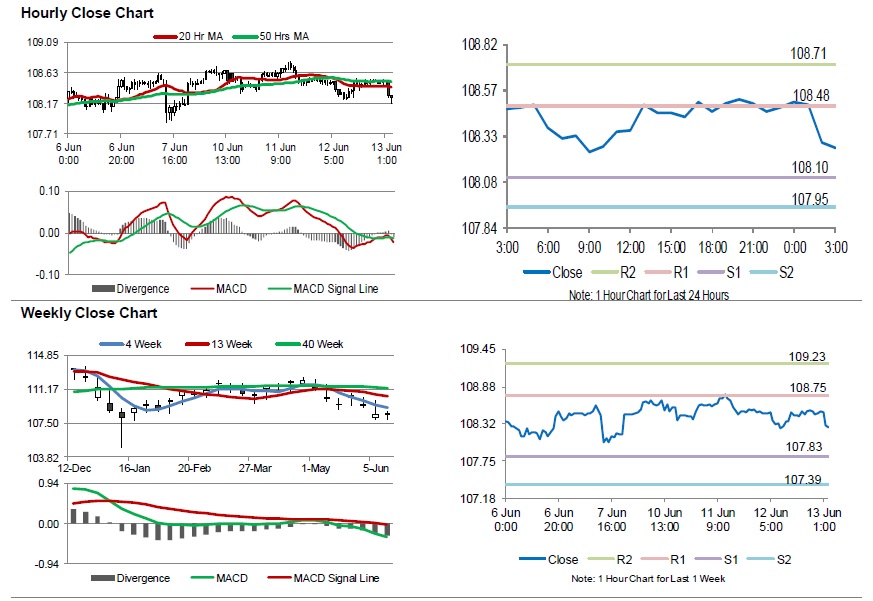
For the 24 hours to 23:00 GMT, the USD declined 0.06% against the JPY and closed at 108.48.
In the Asian session, at GMT0300, the pair is trading at 108.26, with the USD trading 0.20% lower against the JPY from yesterday’s close.
The pair is expected to find support at 108.10, and a fall through could take it to the next support level of 107.95. The pair is expected to find its first resistance at 108.48, and a rise through could take it to the next resistance level of 108.71.
Looking forward, traders would await Japan’s industrial production for April, set to release early morning tomorrow.
The currency pair is trading below its 20 Hr and 50 Hr moving averages.
AUD/USD Daily Outlook
Daily Pivots: (S1) 0.6913; (P) 0.6939; (R1) 0.6953; More...
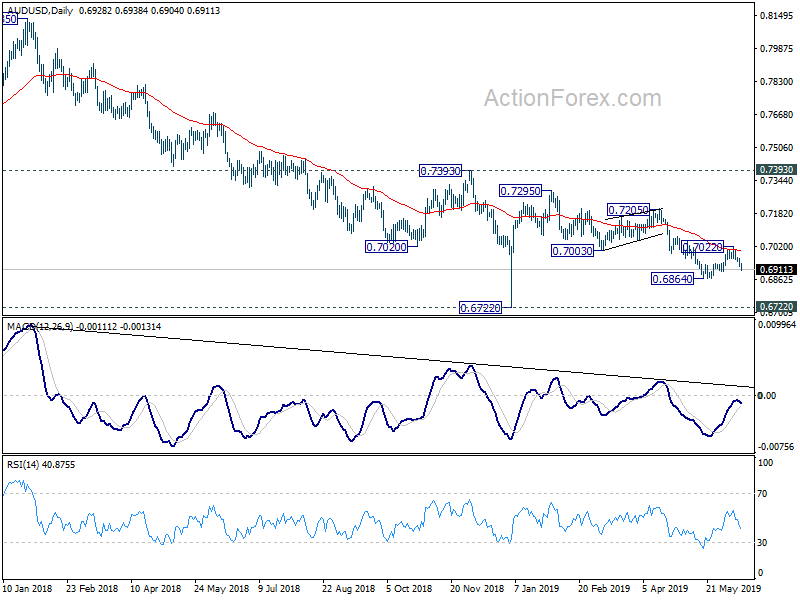
Intraday bias in AUD/USD remains on the downside for retesting 0.6864. Corrective recovery from 0.6864 should have completed at 0.7022 after rejection by 55 day EMA. Break of 0.6864 will resume the decline fro 0.7295 for retesting 0.6722 low. On the upside, above 0.6965 minor resistance will mix up the near term outlook and turn intraday bias neutral first.
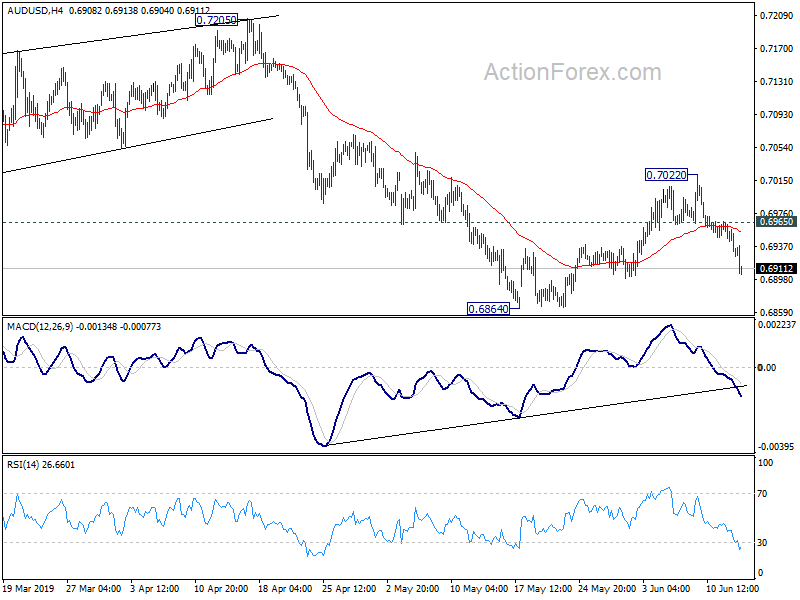
In the bigger picture, with 0.7393 key resistance intact, medium term outlook remains bearish. The decline from 0.8135 (2018 high) is seen as resuming long term down trend from 1.1079 (2011 high). Decisive break of 0.6826 (2016 low) will confirm this bearish view and resume the down trend to 0.6008 (2008 low). However, firm break of 0.7393 will argue that fall from 0.8135 has completed. And corrective pattern from 0.6826 has started the third leg, targeting 0.8135 again.