

Sample Category Title
Forex Technical Analysis: EUR/USD, USD/JPY, GBP/USD
EUR/USD
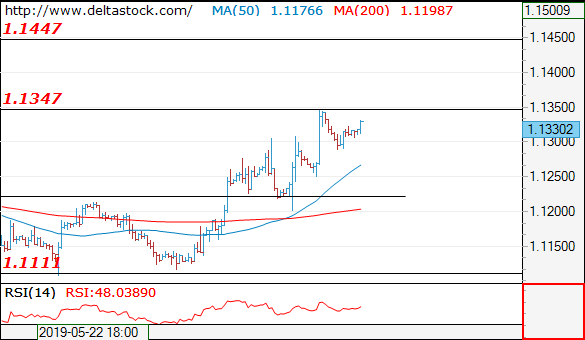
Current level - 1.1330
The pullback after 1.1347 peak is corrective and while 1.1220 major support is intact, there will be a risk of a further rise, towards 1.1450.
| Resistance | Support | ||
| intraday | intraweek | intraday | intraweek |
| 1.1350 | 1.1450 | 1.1285 | 1.1015 |
| 1.1450 | 1.1450 | 1.1220 | 1.0860 |
USD/JPY
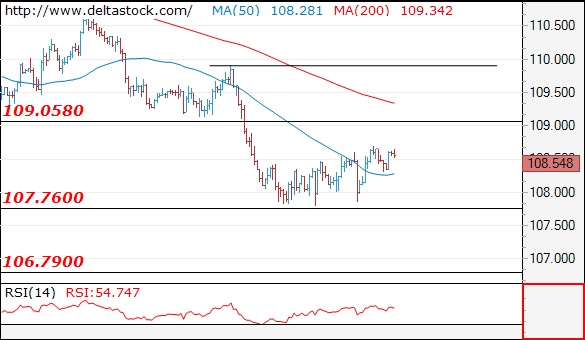
Current level - 108.54
The intraday outlook is positive above 108.25, for a rise towards 109.05.
| Resistance | Support | ||
| intraday | intraweek | intraday | intraweek |
| 109.05 | 109.90 | 108.25 | 107.70 |
| 109.05 | 112.40 | 107.70 | 106.70 |
GBP/USD
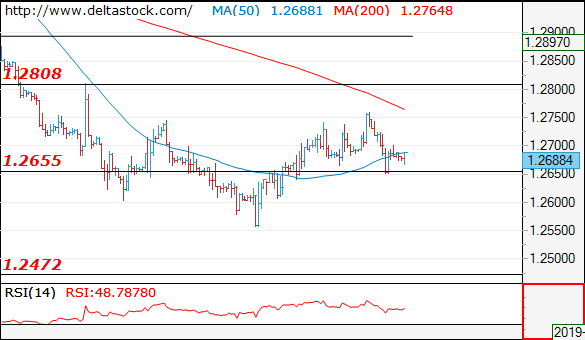
Current level - 1.2688
The recent slide failed to break through 1.2650, but the rebound is corrective, so the outlook is negative, for a dip to 1.2550.
| Resistance | Support | ||
| intraday | intraweek | intraday | intraweek |
| 1.2750 | 1.2960 | 1.2650 | 1.2570 |
| 1.2810 | 1.3170 | 1.2550 | 1.2470 |
EUR/JPY Targets At 123.31
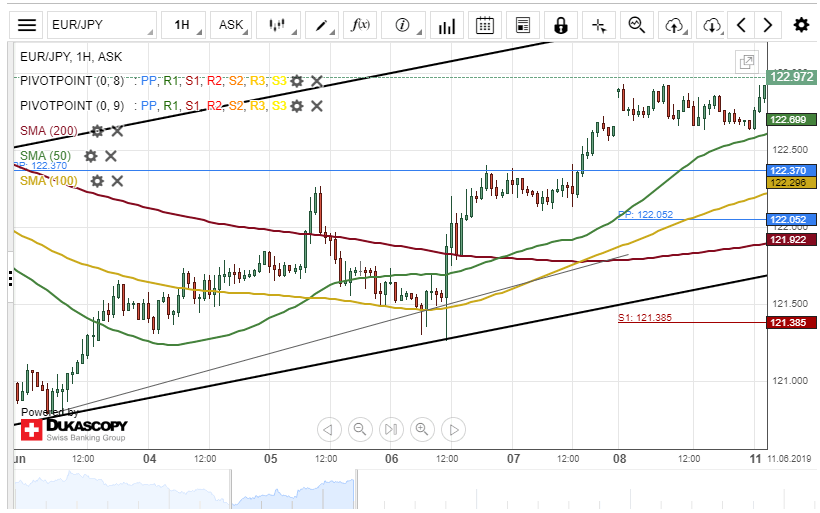
The common European currency versus the Japanese Yen was guided by the 50-hour simple moving average on Monday. The 50-hour SMA provided support for the pair at 122.65 during yesterday's trading session.
Everything being equal, the EUR/JPY currency pair will continue its upward swing within this session. The potential target for bullish traders would be at the upper boundary of an ascending channel pattern at 123.31.
If the resistance level formed by the upper border of the channel pattern holds, a decline could occur during the following trading session.
AUD/USD Breaches 200-Hour SMA
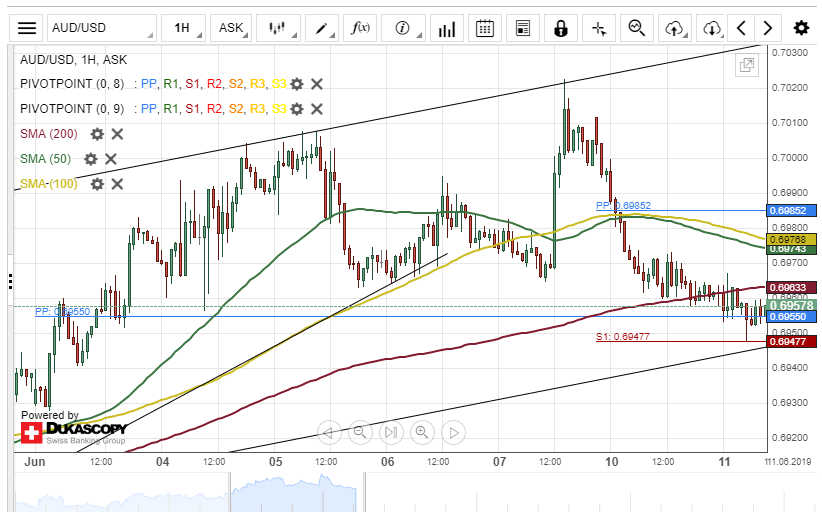
The Australian Dollar depreciated about 54 base points against the US Dollar on Monday. The decline was stopped by a support level formed by the 200-hour SMA at 0.6962.
The exchange rate broke the 200-hour simple moving average during the morning hours of today's trading session.
Given that the three SMAs are above the price level, it is likely that the AUD/USD currency pair will continue its decline during the following trading session.
However, a support cluster formed by the lower boundary of an ascending channel and the weekly S1 at 0.6947 could hinder bears from pushing the currency exchange rate further south today.
USD/CAD Potential Breakout
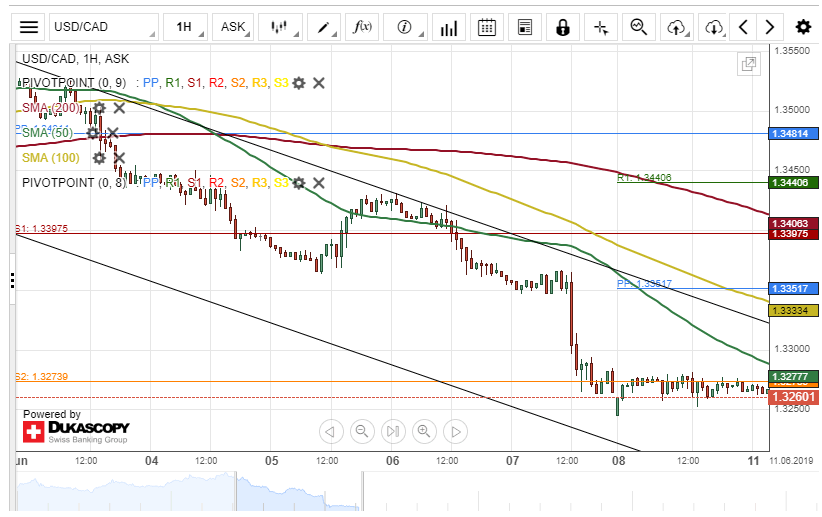
The US Dollar traded sideways against the Canadian Dollar on Monday. The currency pair was consolidating below the monthly support level at 1.3273 during yesterday's trading session.
A breakout is likely to occur within this trading session. Technical indicators suggest a southern breakout.
If this breakout occurs, bearish traders could aim for a support cluster formed by the weekly and the monthly PPs at 1.3176 during the following trading session.
On the other hand, the exchange rate might reverse from the current price level at 1.3261 and target the 100-hour SMA at 1.3337 today.
NZD/USD Tests 200-Hour SMA
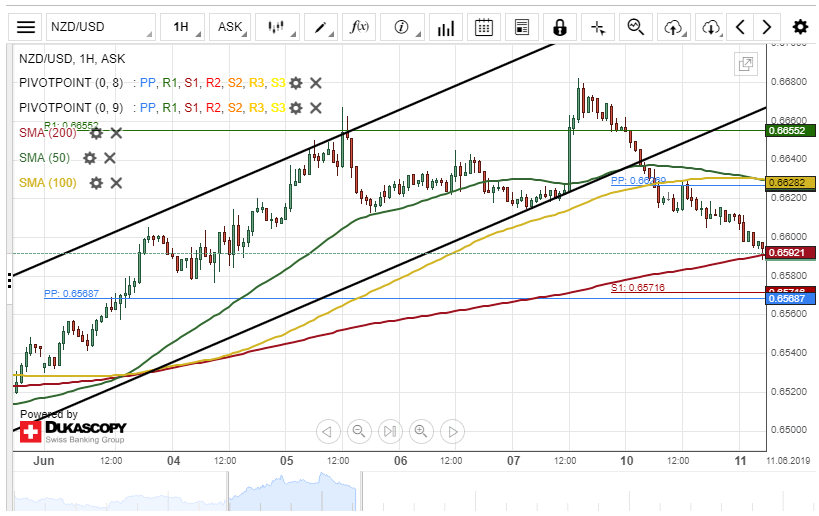
The New Zealand Dollar depreciated about 57 base points against the US Dollar on Monday. The currency pair breached both the 50– and 100-hour SMAs at 0.6629 during the previous trading session.
The exchange rate is currently testing a support level formed by the 200-hour simple moving average at 0.6591.
If the support level holds, a surge towards the weekly pivot point at 0.6629 could be expected within this session.
However, if the currency exchange rate passes the support level as mentioned above, bears could continue their dominance in the market today.
EUR/USD Could Trade Sideways
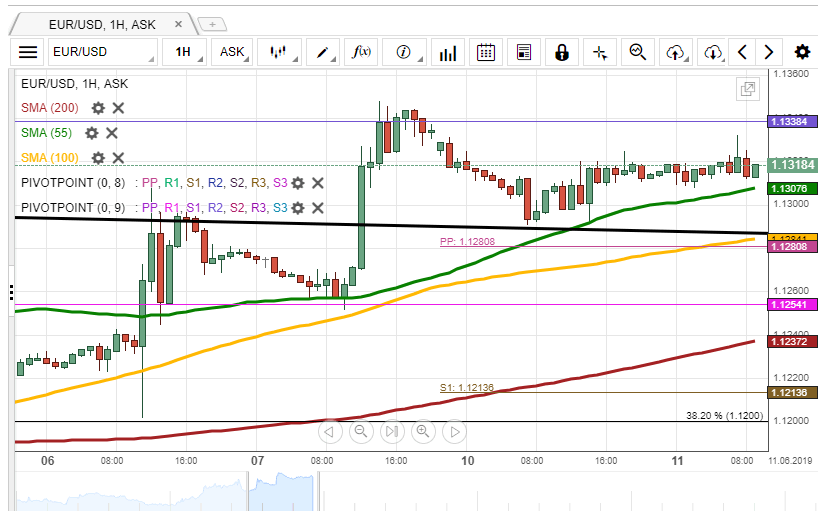
On Monday, the EUR/USD currency pair traded sideways along the support level—the 55-hour moving average at 1.1307.
Note, that the pair is pressured by the monthly R2 located at the 1.1338 mark. Thus, if the given resistance and support hold, it is likely, that the exchange rate could continue to trade sideways.
If the given resistance does not hold, it is expected, that the rate could extend gains and reach the psychological level at 1.1360.
From the technical perspective, it is unlikely, that the pair could drop lower than the 1.1280 mark due to the support level formed by the weekly PP and the 100-hour SMA.
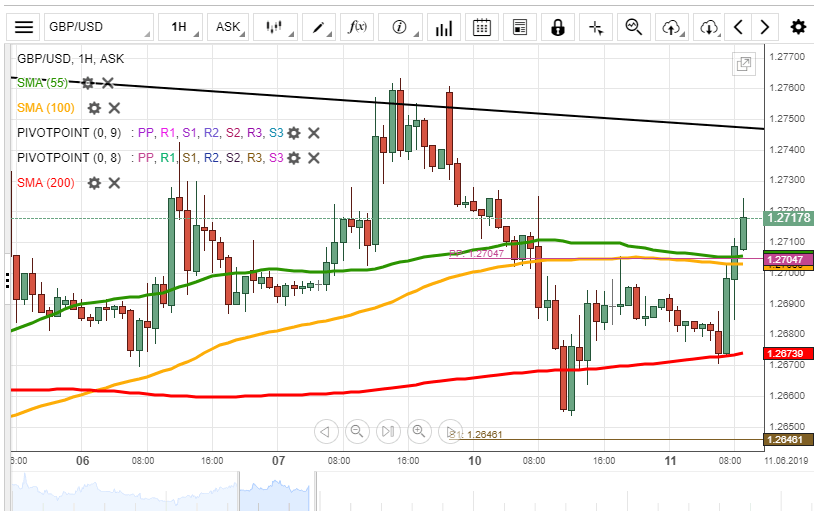
GBP/USD Squeezed By Moving Averages
Yesterday, the GBP/USD exchange rate traded sideways between the 55-, 100– and 200-hour SMAs, located at 1.2700 and 1.2673 respectively.
If the given moving averages hold, it is likely, that the rate could continue to trade sideways in the nearest future.
It is the unlikely case, that bears could prevail in the market, and the currency pair could decline lower than 1.2646 level due to the support of the weekly S1.
Also, from the technical point of view, it is unlikely, that the pair could trade upwards, as it is pressured by the weekly PP at 1.2705.
USD/JPY: Two Scenarios Likely
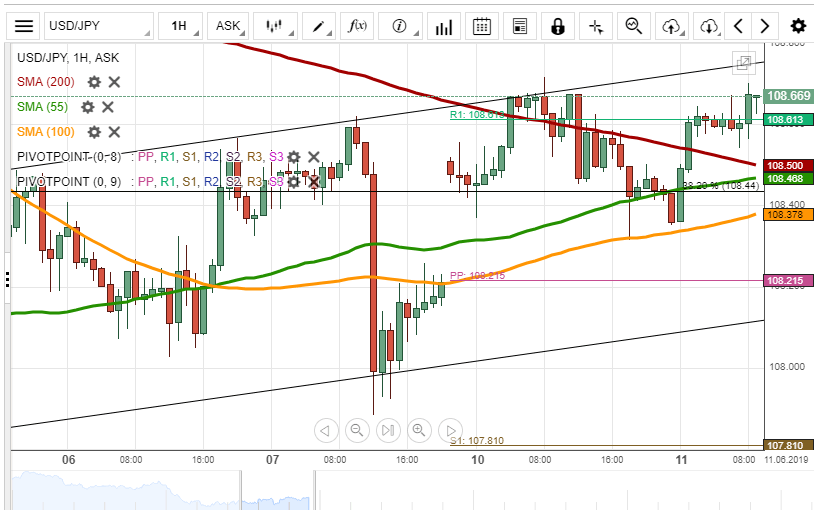
During the previous trading session, the USD/JPY currency pair reversed north from the 100-hour SMA at 108.34. During today's morning, the pair was testing the resistance level formed by the weekly R1 at 108.61.
It is unlikely, that some downside potential could prevail in the market due to the support cluster formed by the 55-, 100-, and 200-hour SMAs, as well the Fibo 38.20% in the 108.37/108.51 range. Thus, the rate could surpass the given resistance and re-test the upper line of the short-term ascending channel circa 108.75.
If the given resistance holds, a reversal south could occur within the following trading hours. Note, that the rate is also supported by the weekly PP at the 108.22 mark.
XAU/USD Likely To Trade Down
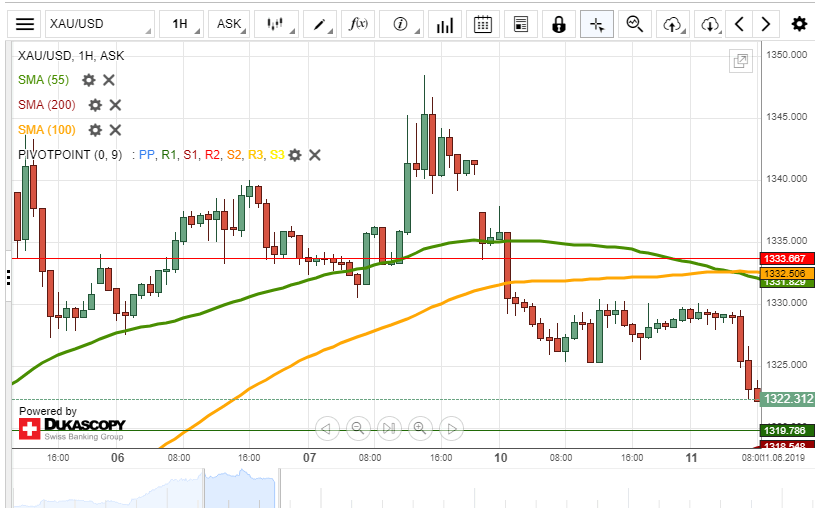
On Monday, the XAU/USD exchange rate traded sideways between the 1,325.00 and 1,330.00 levels.
Given that the rate is pressured by the 55– and 100-hour moving averages, currently located circa 1,333.00, it is likely, that bears could prevail in the market in the short term. A possible downside target is the support level formed by the 200-hour SMA and the monthly R1 a t1,319.79.
On the other hand, the price for gold could continue to trade sideways, trying to surpass the given resistance. Note, that it is unlikely, that the rate could surpass it, as gold is also pressured by the monthly R2 at 1,333.67.
Stocks & CHF Rally
We always felt Trump tariff on Mexican goods was a bluff. However, coming off unending negative headlines, the move was plausible enough. If the rumor is true in a closed-door meeting over the Republicans threatened to block Trump Mexico widen ranging tariffs. Stocks should continue to rally following the weak payroll report on the back of Trump decision to suspend tariffs. Asian stocks, led by China staged a relief rally on the positive Mexico trade news. US 10-year yields should stay above 2.06%, and could improve as the expectation for the Fed has become excessively dovish. Language from the Fed has indicated flexibility over wait-and-see. Elsewhere, Trump resumed his criticism of the Fed policy further, worrying investors over the independence of the world most important central banks. With global monetary policy normalization reversing, and macro-economic risk increasing, CHF remains in high demand.
Historically, CHF has outpaced G10 FX during Fed easing cycle and recession. Despite the SNBs negative interest rate policy and threats to penalize savers, further CHF is the king of economic safe-haven plays. Switzerland has the largest current account surplus as a percent of GDP in the majors. Last month the CHF has gained 2.5% against the USD with signals that the trend could accelerate sharply should the global economy deteriorate further. It is unclear how much appetite the SNB has for additional physical intervention, given the central bank's bloated balance sheet and questionable effectiveness. Given our skepticism for meaningfully interventions setting a SNB pain threshold becomes more difficult. That said, the SNB has a long history of punishing traders and most likely target psychological warfare before psychical interventions.