Sample Category Title
Silver: White Metal Trading On A Weaker Footing This Morning
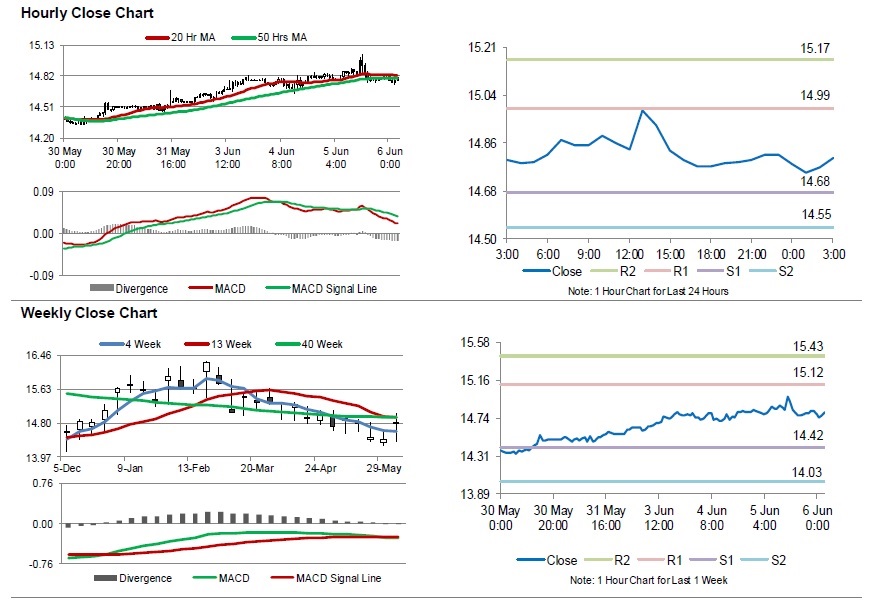
For the 24 hours to 23:00 GMT, Silver slightly rose against the USD and closed at USD14.82 per ounce, tracking gains in gold prices.
In the Asian session, at GMT0300, the pair is trading at 14.81, with silver trading 0.07% lower against the USD from yesterday’s close.
The pair is expected to find support at 14.68, and a fall through could take it to the next support level of 14.55. The pair is expected to find its first resistance at 14.99, and a rise through could take it to the next resistance level of 15.17.
The white metal is trading below its 20 Hr moving average and showing convergence with its 50 Hr moving average.
Crude Oil: Oil Reverses Its Losses In The Morning Session
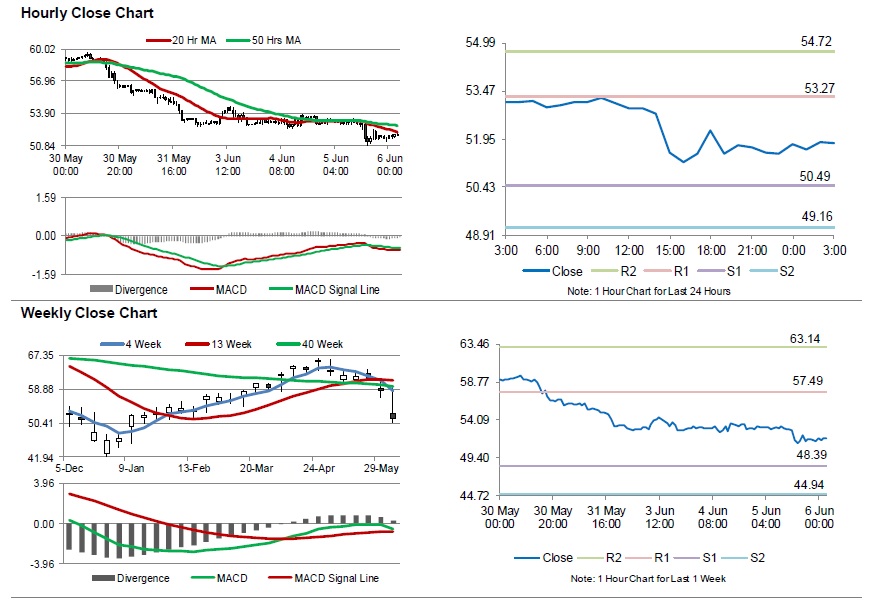
For the 24 hours to 23:00 GMT, Crude Oil declined 2.89% against the USD and closed at USD51.50 per barrel, after the Energy Information Administration (EIA) report indicated that US crude oil stockpiles rose by 6.8 million barrels to 483.3 million in the week ended 31 May 2019.
In the Asian session, at GMT0300, the pair is trading at 51.83, with oil trading 0.64% higher against the USD from yesterday’s close.
The pair is expected to find support at 50.49, and a fall through could take it to the next support level of 49.16. The pair is expected to find its first resistance at 53.27, and a rise through could take it to the next resistance level of 54.72.
Crude oil is trading below its 20 Hr and 50 Hr moving averages.
EUR/USD Bearish Reversal After Strong Rejection At 1.13
The EUR/USD daily chart is showing a strong bearish candlestick pattern but a break below the support trend line (blue) is needed as a confirmation for more downside. A bullish bounce could see price retest the resistance zone (red line) first, which could act as a head and shoulders level on the lower time frame as well. Price must break above the 1.1310-1.1325 resistance zone before an uptrend is possible (green arrow).
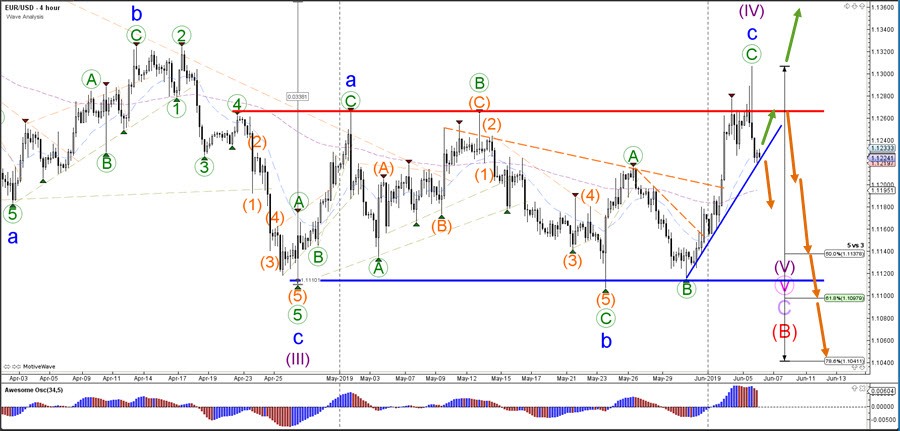
The EUR/USD could test the Fibonacci retracement levels of wave 2 vs 1. Especially the 61.8% Fib level could be a strong resistance area due to the potential head and shoulders reversal chart pattern. A bearish bounce and break below the support line (blue) would confirm the bearish wave pattern whereas a break above the 100% Fib level indicates an uptrend.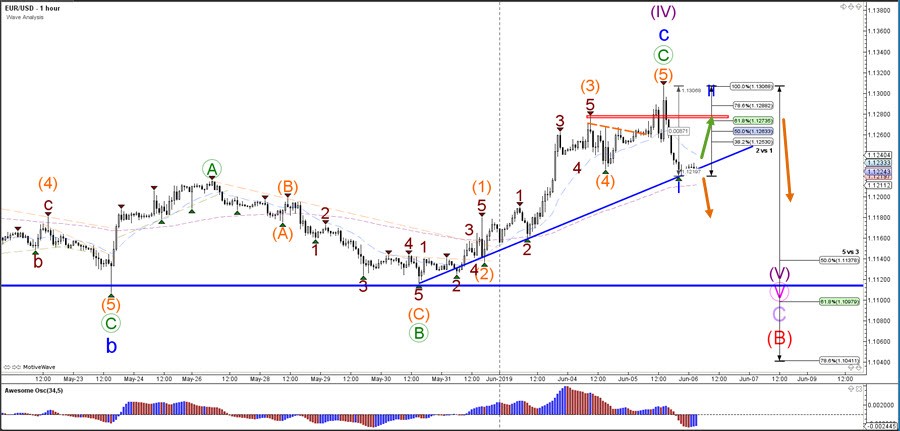
Elliott Wave View: 5 Waves Rally In S&P 500 Futures (ES_F) Suggests More Upside
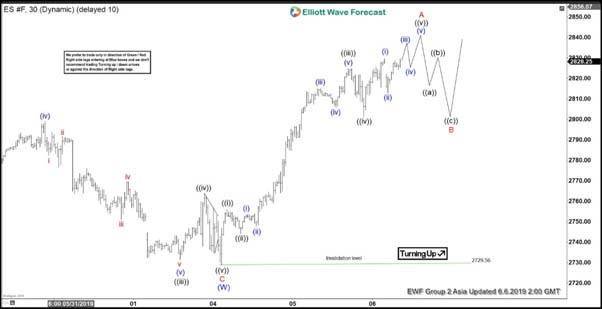
Elliott wave view in S&P 500 Futures (ES_F) suggests that the Index ended wave (W) at 2729.56 on June 4. This ended the decline which started from May 1 high as a 3 waves zigzag Elliott Wave structure. The Index is correcting cycle from May 1 high in wave (X) in 3, 7, or 11 swing. The internal of wave (X) rally is unfolding as a zigzag Elliott Wave structure. A zigzag is an ABC with 5-3-5 structure. Wave A is currently in progress as a 5 waves impulse.
Up from 2729.56, wave ((i)) ended at 2755.75, wave ((ii)) ended at 2744, wave ((iii)) ended at 2824.75, and wave ((iv)) ended at 2801. The Index can see 1 more leg higher in wave ((v)) before ending wave A. Afterwards, it should pullback in wave B to correct cycle from June 4 low (2729.56) in 3, 7, or 11 swing before turning higher again in wave C. We don’t like selling the Index. As the rally from June 4 low is impulsive, expect wave B pullback to hold above 2729.56 for at least 1 more push higher in wave C.
S&P 500 Futures (ES_F) 1 Hour Elliott Wave Chart
ECB to stand pat, may have dovish shift, some previews
ECB rate decision is the main focus for today. The central bank is widely expected to keep benchmark interest rate at 0.00%. Marginal lending facility rate and the deposit facility rate will be held at 0.25% and -0.40% respectively. The forward guidance that interest rates will "remain at their present levels at least through the end of 2019" would likely be untouched too.
Eurozone economy has been slowing down since late last year and the recovery has been very weak. That's very much reflected in manufacturing PMI which was stuck at 47.7 in May. Deterioration was spreading over to services with PMI held at just 52.9. The survey data indicate a mere 0.2% GDP growth in Q2. Headline CPI also slowed notably to 1.2% yoy in May, well below ECB's 2% target.
The weak growth and inflation outlook will likely be reflected in the new economic projections to be released today. The question is whether ECB President Mario Draghi will shift to a more dovish tones in the press conference. Also, there's a chance Draghi could even signal some openness to further easing. Indeed, there are speculations that ECB could cut the deposit rate further into negative territory next year. ECB would also release details of the TLTRO III.
Here are some previews on ECB:
Australia’s Trade Account Surplus Holds At Near Record High
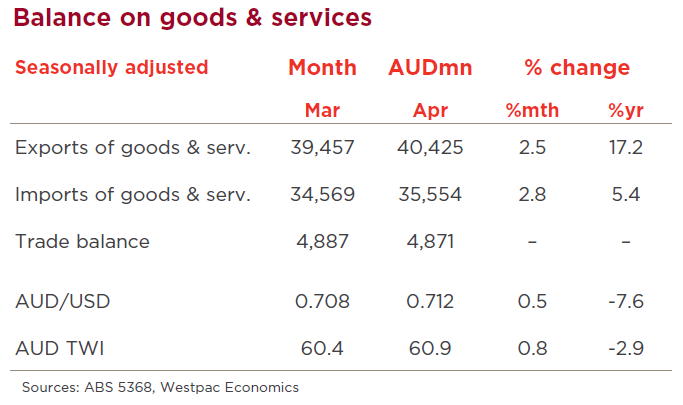
April: +$4.9Bn, Prior: +$4.9Bn Exports +2.5%, Imports +2.8%
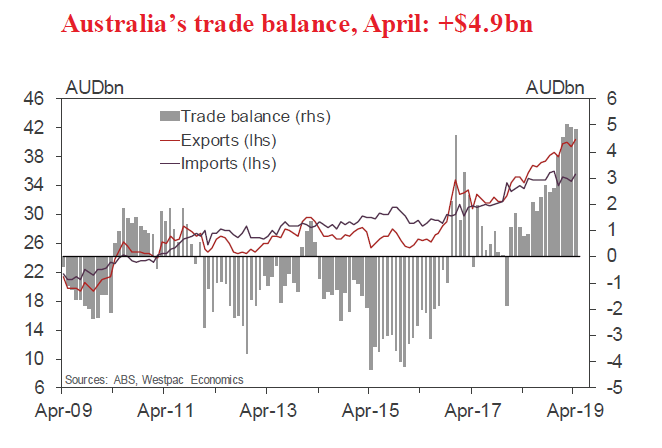
- In April, Australia's trade surplus printed at $4.9bn, unchanged from March and only a fraction below the record high of $5.0bn in February.
- The April outcome was broadly in line with market expectations but fell a little short of our forecast (market median $5.0bn and Westpac $5.4bn).
- Imports rebounded from a softer showing in March, albeit by a little more than we anticipated, up 2.8% (+$1.0bn) vs a forecast +2.3%.
- Exports advanced, up 2.5% (+$1.0bn), a little shy of our forecast +3.2%.
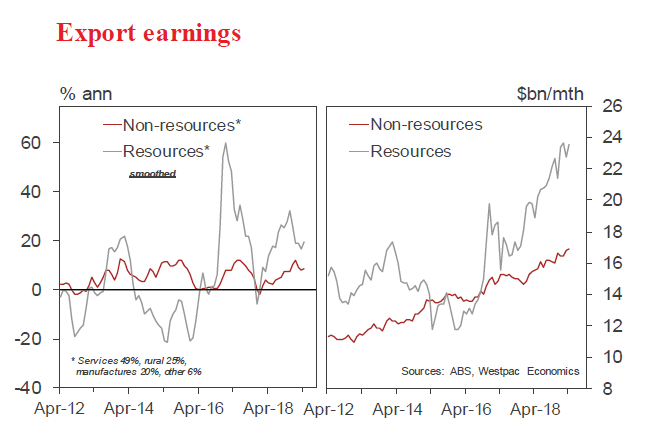
- The trade surplus has climbed to be at record highs in 2019. The key dynamic driving the larger surplus is the boost to export earnings from higher commodity prices, notably iron ore following the tailings dam disaster in Brazil.
- On the back of these larger trade surpluses, the current account deficit has narrowed sharply to be at historic lows, coming in at only 0.6% of GDP in the March quarter 2019, the smallest deficit since 1979 Q4 (also a -0.6% of GDP) and before that, 1975 Q2, which was a surplus, +0.2% of GDP.
- Higher commodity prices are boosting mining profits and in turn tax revenues, thereby providing the Federal government with additional flexibility on fiscal policy.
In the month of April, the import bill rose by $1.0bn, more than reversing a $0.5bn decline in March.
More generally, imports volumes have been choppy around a soft trend against the backdrop of sluggish domestic demand and with a lower dollar making import services more expensive (including overseas travel).
In the March quarter, import volumes edged 0.1% lower to be 0.5% below the level of a year earlier. This includes softness in service imports, down 1.4% in the quarter and 0.8% lower over the year.
Turning to exports, earnings increased by 2.5% in the month of April to be 17.2% above the level of a year ago. In the month, exports were led higher by metal ores, up $1.4bn on stronger iron ore shipments and higher iron ore price. The iron ore spot price jumped to over US$90/t in April and has moved higher since then.
In other export detail for April: gold rose, up by $0.3bn, lifting from a relatively low base; coal disappointed, down $0.7bn; and fuels (including LNG) also moderated, down $0.2bn In the March quarter, export volumes resumed their upward trend, advancing by 1.0%. That follows a disappointing second half to 2018, when export volumes slipped by 0.5%, dented by the impacts of the drought and supply disruptions in the resources sector. Looking ahead, LNG shipments have further upside as new capacity comes on stream and the lower dollar, as well as strong demand from the Asian region, is driving strong growth in service exports, with volumes up 6.6% over the past year.
Australia trade surplus at AUD 4.87B in Apr, exports rose 2.5% mom, imports rose 2.8% mom
Australia trade surplus came in smaller than expected at AUD 4.87B in April. Exports rose 2.5% mom, 17.2% yoy to AUD 40.42B. Imports rose 2.8% mom, 5.4% yoy to AUD 35.55B.
Looking at the details of exports, non-rural goods rose AUD 691m (3%), non-monetary gold rose AUD 272m (20%) and net exports of goods under merchanting rose AUD 8m (73%). Rural goods fell AUD 67m (2%). Services credits rose AUD 65m (1%).
For imports, intermediate and other merchandise goods rose AUD 423m (4%), capital goods rose AUD 308m (5%) and consumption goods rose AUD 298m (3%). Non-monetary gold fell AUD 40m (9%). Services debits fell AUD 5m.
IMF Lagarde: Tariffs add to global uncertainty, but decelerating growth is not recession
IMF Managing Director Christine Lagarde said the global economy is not under threat of recession due to US tariffs actions on other countries. She told Reuters yesterday, "Decelerating growth, but growth nonetheless — 3.3 percent at the end of this year, and certainly a strong U.S. economy. We do not see at the moment, in our baseline, a recession."
However, still, "one more tariff here, one more threat there, one more negotiation that has not yet started, add to a global uncertainty which is not conducive to additional growth," she added.
Market Morning Briefing: Pound Is Down From 1.2743
STOCKS
Global equities have bounced over the last few days on increasing hopes for the US Federal Reserve to cut rates. Will the Fed change its stance and hint for any rate cuts in its meeting this month on June 19? We will have to wait and watch. There is room for the recent bounce-back move in equities to extend in the near term. However, the major indices like the Dow, Nikkei and DAX have key resistances coming up which has to be broken to strengthen the current bounce-back move and negate the bearish view.
Contrary to our expectation for fall, Dow (25539.57, +207.39, +0.82%) has risen sharply above 25250 over the last couple of days. A strong break above 25735 (21-week moving average, a crucial level for now) will negate our bearish view and turn the outlook positive to test 26500-26700.
DAX (11980.81, +9.64, +0.08%) has resistance at 12100 which is holding well as of now. While below 12100, the broader bearish view will remain intact and DAX can fall back to 11800 and 11600 levels again.
Nikkei (20821.37, +45.27, +0.22%) is on a corrective rally. It has resistance in the 21000-21100 region which can cap the upside and trigger a fresh leg of downmove towards our preferred targets of 20000 and 19500
Shanghai (2854.71, -6.71, -0.23%) is inching down towards 2835 - the lower end of the 2835-2950 sideways range. Though the index has remained stable amid a strong sell-off in other global equity markets, a descending triangle pattern on the chart increases the possibility of the index breaking the range below 2835 and target 2800-2780 in the coming days. We will have to wait and watch.
Sensex (40083.54, -184.08, -0.46%) remains bullish, but might move up at a slow pace and target 40500 and 40700 in the short term. We would remain cautious for a sharp correction from the 40700-41000 region.
Nifty (12021.65, -66.90, -0.55%) is bullish to break above 12100 and rally to 12300-12350 in the short term while it remains above 11900.
COMMODITIES
Recovery in the US dollar has pulled down gold and silver sharply from their highs. We see the chances of the recent upmove in gold and silver losing steam and a dip in the near term is possible. Copper keeps our bearish view intact. Oil has declined further after the data release showed a surge in crude inventories. Oil looks vulnerable to break below the key Fibonacci retracement support and extend its downtrend in line with our expectation.
Gold (1329) has come-off sharply after testing the resistance near 1345. The pace of rally seems to be slowing down. While below 1345, a pull-back move to 1310 or even 1300 low looks likely. A break below 1320 can trigger this fall. 1360 is very crucial level which has to be broken in order to turn the outlook completely bullish.
Silver (14.79) can dip to 14.70 and 14.60 while it remains below 14.85. A strong break above 15 is needed for silver to confirm the trend reversal and turn the outlook bullish.
The resistance at 2.67 as held well and Copper (2.62) has come-off sharply as expected after testing it. This keeps our bearish outlook intact for copper to test 2.60. A break below 2.60 will pave way for 2.58 and even 2.55 on the downside.
Brent (60.66) is struggling to breach 62 and remains vulnerable to break 59.74 (the 61.8% Fibonacci retracement support). The bearish outlook is intact to test our long-term target level of 55.
WTI (51.74) looks weaker than Brent. It is hovering just above 51.72 (61.8% Fibonacci retracement support) which is likely to be broken to target initially 49-48 and then 45 eventually over the long term.
FOREX
ECB monetary policy statement due today could bring in volatility in the markets today. Euro (1.1226) tested 1.13068 yesterday much in line with our expectation of testing 1.1290-1.1325 mentioned on Tuesday. Although Euro has fallen a bit from the highs, the commentary by Draghi today would be important. While Euro holds below 1.1325, view is bearish.
Dollar Index (97.31) also tested 96.75 as expected before bouncing back from there. There is scope of rising towards 98.00-98.50 in the near term while above 97.
Euro-Yen (121.53) is almost stable and is likely to trade within 121-122.50 region in the near term.
Dollar-Yen (108.26) bounced back well from 107.80. Unless a rise above 109 is seen, we may continue to remain bearish on Dollar-Yen towards 107.50. Note that 107.50 and 107.80 are immediate supports and may hold, gradually pushing up dollar Yen towards 109+ levels.
RBA cut rates by 25bps yesterday to 1.25%. Aussie (0.6970) tested 0.70 but has now come off from there. While immediate resistance at 0.70 holds, Aussie could fall a bit towards 0.6950-0.69 in the next 3-4 sessions. An attempt to break above 0.70 (less likely this week) would make Aussie bullish towards 0.72.
Pound (1.2686) is down from 1.2743 and may fall towards 1.26 in the near term.
USDCNY (6.9123) has risen and is trading near the upper limit of the sideways range. A break above 6.92, if seen would make it bullish towards 6.95. For now watch price action near resistance at 6.92.
USDINR (69.2650) could fall a bit today as RBI is expected to cut rate by 25bps. Immediate support at 69 may continue to hold. Bearish view would remain intact while Dollar-Rupee trades below 69.60/65. If, a break above 69.65 is seen, the currency pair could shift its trade zone higher for the coming week.
INTEREST RATES
ECB and RBI policy rates are expected today. While ECB is likely to keep rates unchanged, RBI is expected to cut rate by 25bps.
The US 30Yr (2.64%) has risen sharply while the 10Yr (2.13%) has risen slightly and the 5Yr (1.86%) has dipped. The yields could trade hgher for a few sessions before again falling back. Longer term bearish view remains intact.
The US-Japan 10YR (2.24%) has risen along with the rise in Dollar-Yen and Nikkei but if the spread falls again towards 2.20%, the rise in Dollar Yen and Nikkei could be limited on the upside.
The sharp dip in the German-US 10Yr (-2.35%) has been in line with the dip in Euro. Looking at the spread, it is bearish towards -2.43% indicating a further fall in Euro in the near term.
The Indian 10Yr GOI (7.1907%) has risen from 7.09% but looks bearish towards 7% in the medium term.
US-Mexico migration meeting ended with insufficient progress, double downgrade for Mexico
The high-level meeting between US and Mexico on migration ended with insufficient progress. Trump tweeted that "Progress is being made, but not nearly enough!" He threatened again "If no agreement is reached, Tariffs at the 5% level will begin on Monday, with monthly increases as per schedule. The higher the Tariffs go, the higher the number of companies that will move back to the USA!"
Vice President Mike Pence, who chaired the meeting including Secretary of State Michael Pompeo and Mexican Foreign Minister Marcelo Ebrard, also echoed Trump's comments. He tweeted "Progress was made but as @POTUS said "not nearly enough." @SecPompe, @DHSMcAleenan, & I made clear: Mexico must do more to address the urgent crisis at our Southern Border."
Ebrard said after the meeting that there was no discussions on tariffs. "The dialogue was focused on migration flows and what Mexico is doing or is proposing to the United States, our concern about the Central American situation." He noted "what the US government is looking for are measures in the short-term and medium-term". Instead, Mexico is promoting long term fix involving a development deal for Central America which would eventually slow migration.
Meeting will continue on Thursday and if no agreement is made, US will starting imposing 5% tariffs on all Mexican imports on June 10. That rate would "gradually" go up to 25% on October 1.
Fitch cut Mexico's rating from BBB+ to BBB and cited that "growth continues to underperform, and downside risks are magnified by threats by U.S. President Trump." Moody's downgraded Mexico's outlook from stable to negative and noted "further evidence that medium-term growth is in decline, whether as a result of policies that actively undermine growth or because of continued policy unpredictability, would put downward pressure."
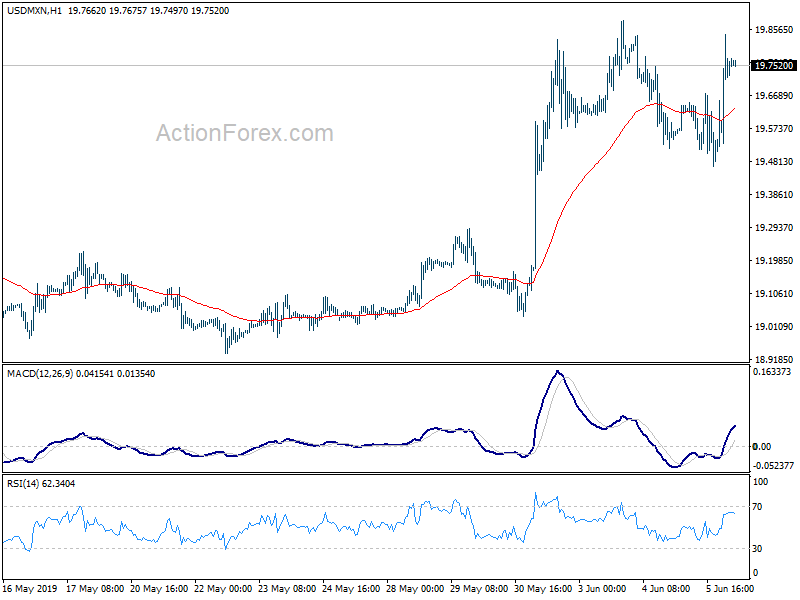
USD/MXN has a rough ride but is generally kept inside this week's range.