Sample Category Title
Elliott Wave Analysis: Silver (XAGUSD) Nears Key Support Zone
Silver (XAGUSD) has surged to a new 13-year high, decisively confirming the bullish trend in the precious metal. The ongoing rally, which began from the May 15, 2025 low, is unfolding as an impulsive Elliott Wave structure, characterized by strong upward momentum. From the May 15 low, wave 1 peaked at 33.69. A corrective pullback in wave 2 followed that concluded at 32.58. The metal then resumed its ascent in wave 3, demonstrating robust bullish sentiment.
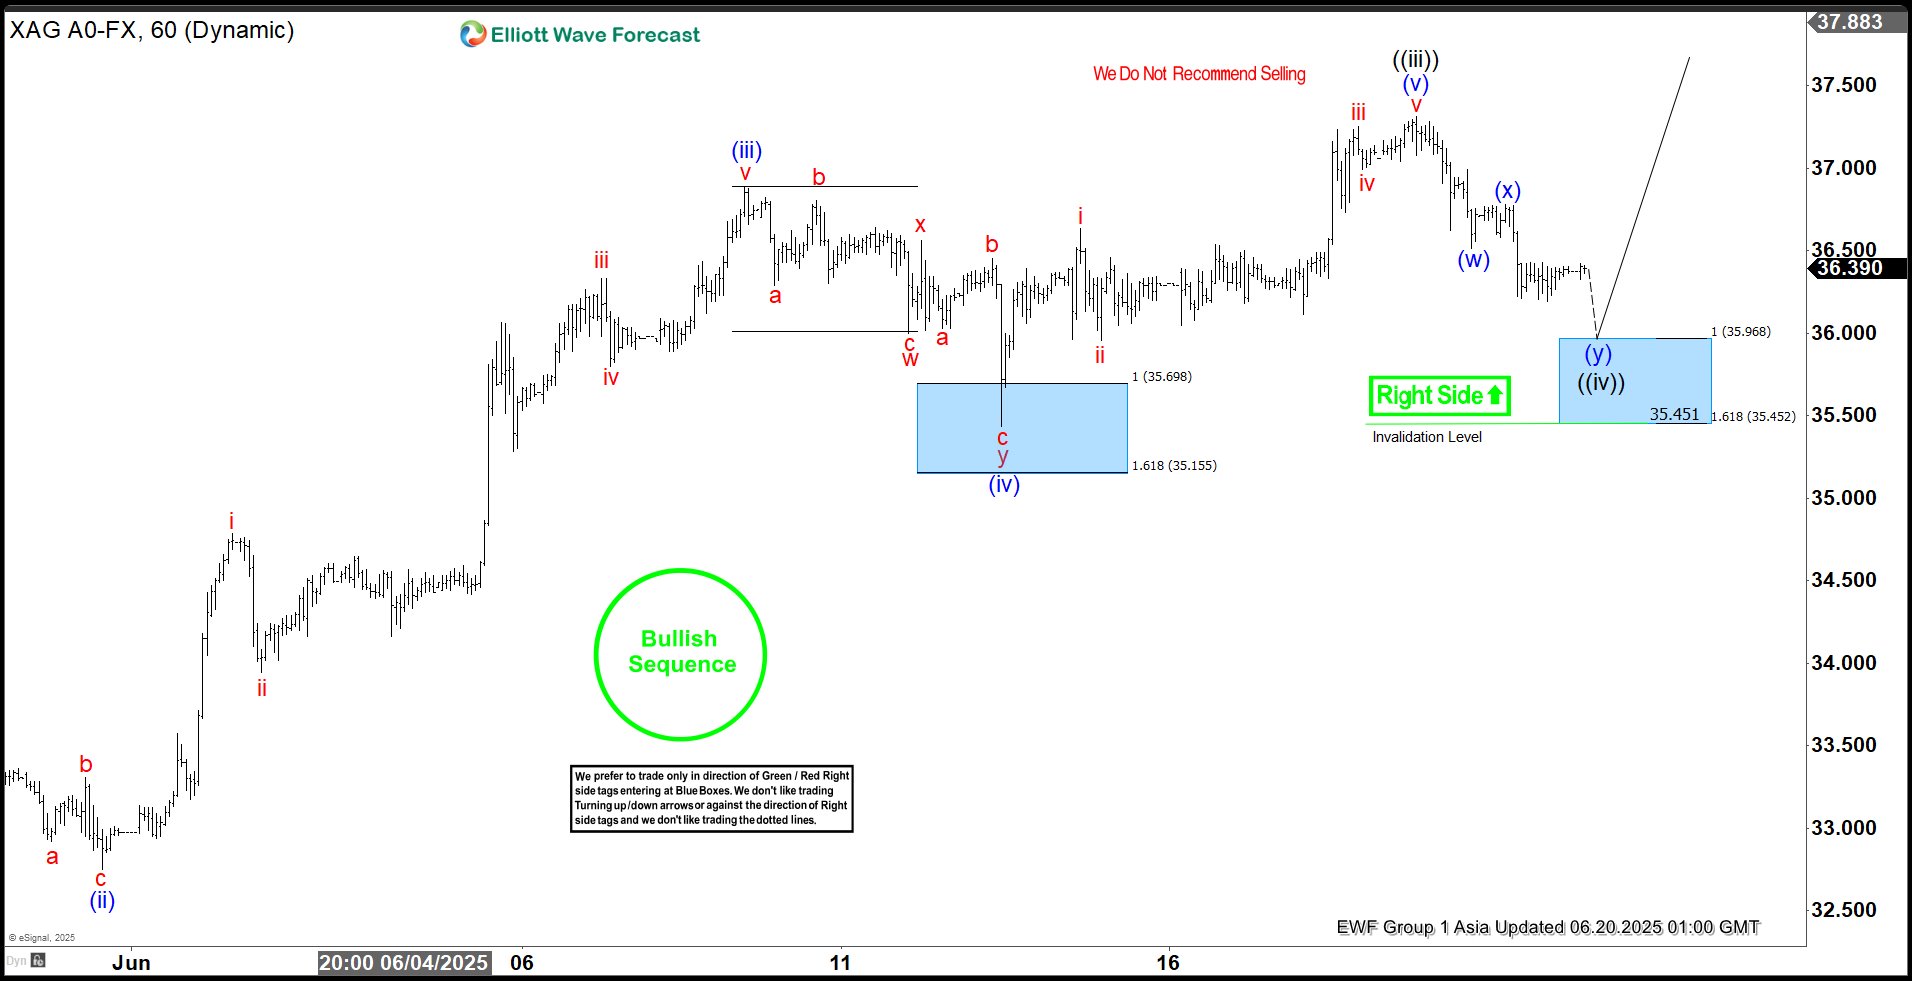
Within wave 3, the internal structure is clear. Wave ((i)) reached 33.56 and a shallow pullback in wave ((ii)) followed to 32.67. The subsequent wave ((iii)) propelled silver to a high of 37.31, underscoring the strength of the uptrend. Currently, a corrective wave ((iv)) is unfolding as a double three Elliott Wave pattern. From the wave ((iii)) peak, wave (w) declined to 36.51, followed by a brief recovery in wave (x) to 36.78.
The ongoing decline in wave (y) is expected to find support between 35.45 and 35.96, potentially completing wave ((iv)). Once this correction concludes, silver is poised to either extend higher in wave ((v)) to a new peak or rally in at least three waves, reinforcing the bullish outlook.
Silver (XAGUSD) 60-Minute Elliott Wave Technical Chart
XAGUSD Elliott Wave Technical Video
https://www.youtube.com/watch?v=-STpShqSJeQ
XBR/USD Chart Analysis: Oil Price Falls After Trump’s Decision
As shown on the XBR/USD chart, the price of Brent crude oil has pulled back from yesterday’s 4.5-month high following a statement from the White House that President Donald Trump will make a decision within the next two weeks on whether the United States will take part in the Israel-Iran conflict.
According to Reuters, the US President is facing backlash from some members of his team over the prospect of launching a strike against Iran, which could drag the US into yet another prolonged war.
Technical Analysis of the XBR/USD Chart
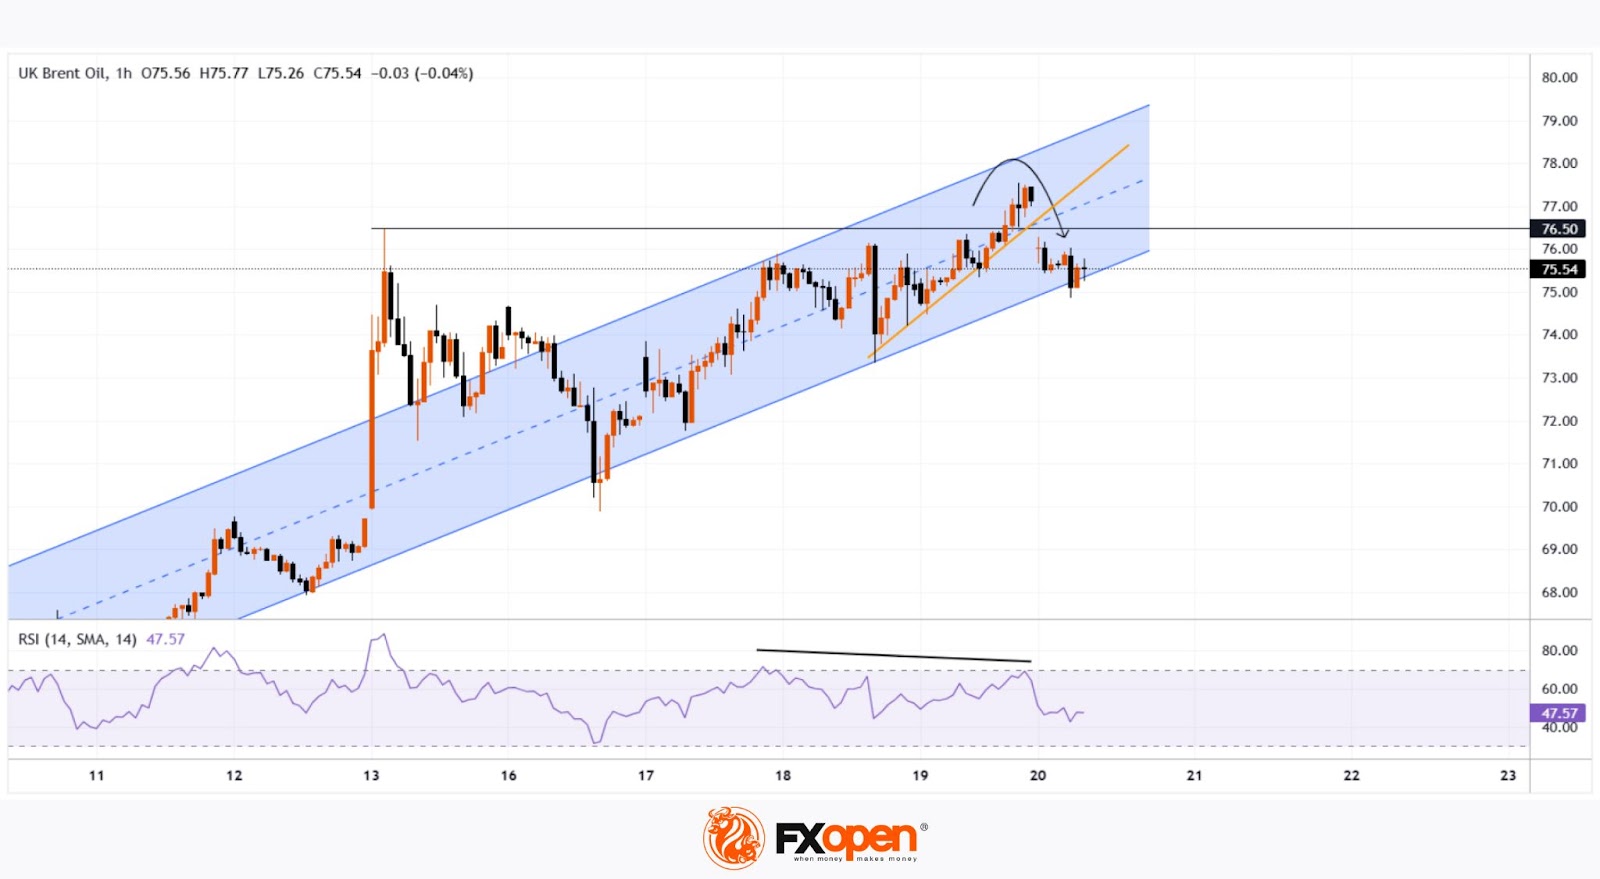
From a technical standpoint, Brent crude oil price is developing within an upward channel (marked in blue), though several bearish signals are appearing on the chart:
→ a bearish gap that formed overnight;
→ a false bullish breakout (indicated by an arrow) above the $76.50 level, drawn from the 13 June high;
→ bearish divergence on the RSI indicator;
→ a break of the recent local ascending trendline (marked in orange).
Given the steep angle of the rising blue channel, it is reasonable to assume that bears may attempt to break through its lower boundary, which is currently acting as support. Whether this scenario materialises in the oil market will largely depend on developments in the Middle East.
Start trading commodity CFDs with tight spreads. Open your trading account now or learn more about trading commodity CFDs with FXOpen.
This article represents the opinion of the Companies operating under the FXOpen brand only. It is not to be construed as an offer, solicitation, or recommendation with respect to products and services provided by the Companies operating under the FXOpen brand, nor is it to be considered financial advice.
BoJ’s Ueda eyes future hikes on labor-driven inflation
BoJ Governor Kazuo Ueda said today that Japan’s underlying inflation could "stagnate" in the short term as economic growth slows. But he remains confident it will "accelerate thereafter".
He pointed to "intensifying labor shortages" as a source of upward pressure on medium- to long-term inflation expectations.
Ueda emphasized that BoJ stands ready to hike rates further, contingent on sustained improvements in the economy.
EUR/USD Daily Outlook
Daily Pivots: (S1) 1.1463; (P) 1.1481; (R1) 1.1517; More...
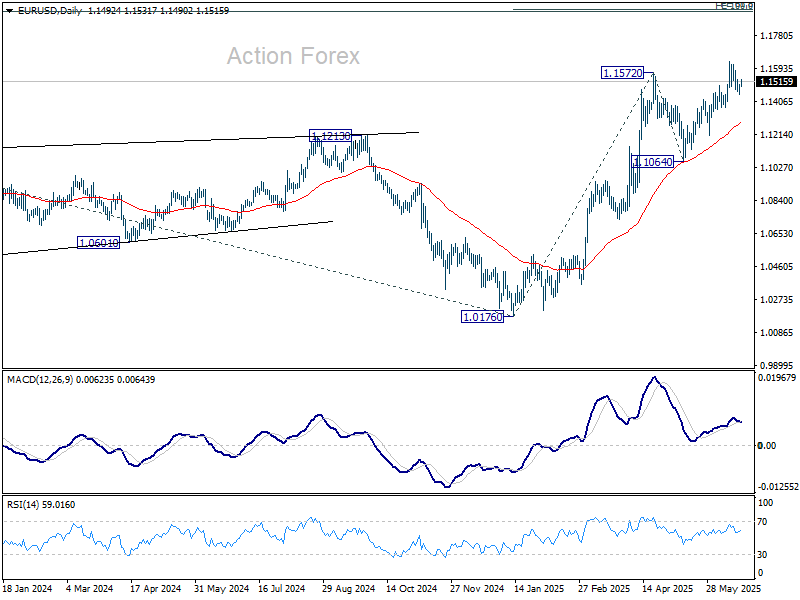
Intraday bias in EUR/USD remains neutral and more consolidations could be seen below 1.1630. With 1.1372 support intact, further rally is expected. Break of 1.1572 will extend the rise from 1.0176. Next target is 61.8% projection of 1.0176 to 1.1572 from 1.1064 at 1.1927. However, break of 1.1372 support will indicate short term topping, and turn bias to the downside for deeper pullback.
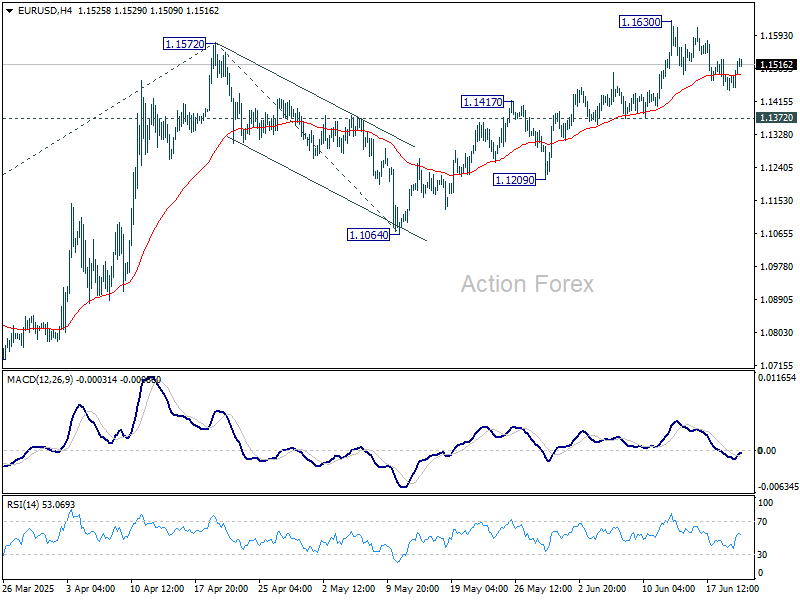
In the bigger picture, rise from 0.9534 long term bottom could be correcting the multi-decade downtrend or the start of a long term up trend. In either case, further rise should be seen to 100% projection of 0.9534 to 1.1274 from 1.0176 at 1.1916. This will now remain the favored case as long as 1.1604 support holds.
USD/JPY Daily Outlook
Daily Pivots: (S1) 144.88; (P) 145.32; (R1) 145.91; More...
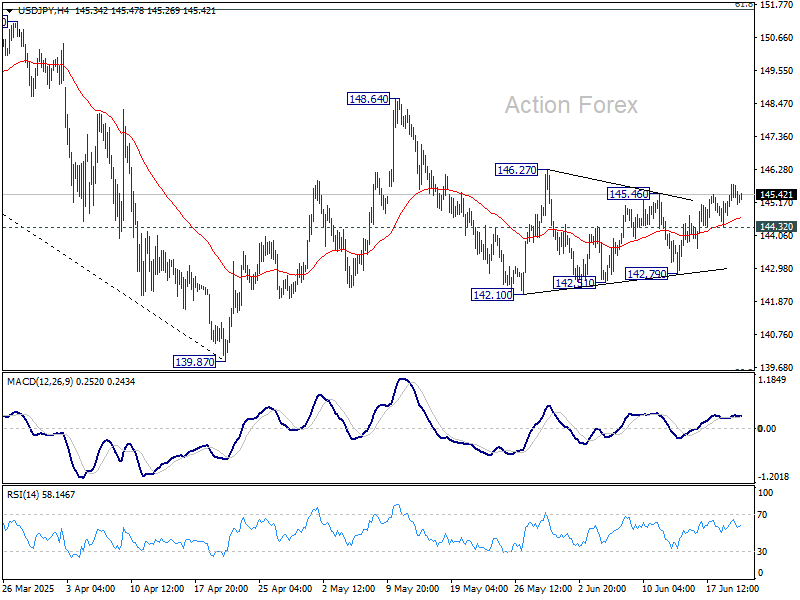
Intraday bias in USD/JPY stays mildly on the upside for 146.27 resistance. Firm break there will target 148.64 next. On the downside, below 144.32 minor support will turn intraday bias neutral again. Overall near term outlook is mixed, focus is on whether price actions from 139.87 would eventually develop into a corrective pattern, or completely reversing the decline from 158.86.
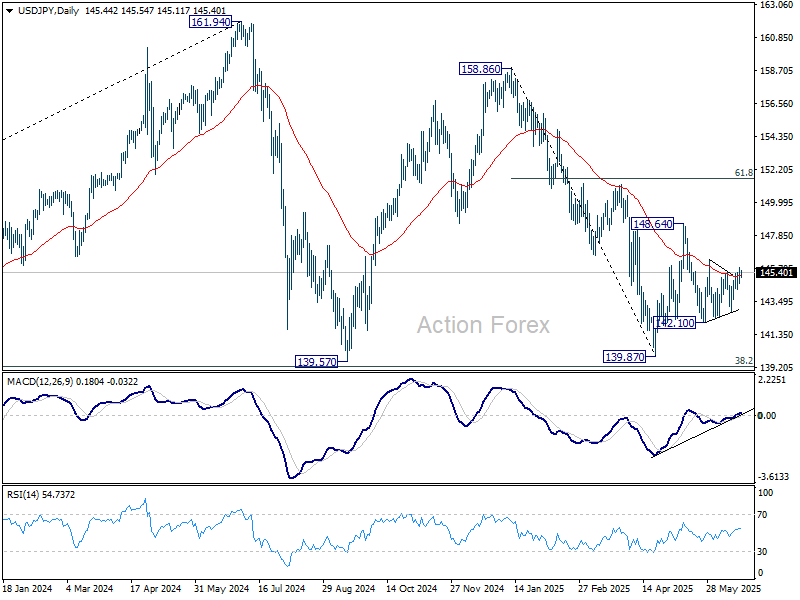
In the bigger picture, price actions from 161.94 are seen as a corrective pattern to rise from 102.58 (2021 low), with fall from 158.86 as the third leg. Strong support should be seen from 38.2% retracement of 102.58 to 161.94 at 139.26 to bring rebound. However, sustained break of 139.26 would open up deeper medium term decline to 61.8% retracement at 125.25.
GBP/USD Daily Outlook
Daily Pivots: (S1) 1.3411; (P) 1.3440; (R1) 1.3498; More...
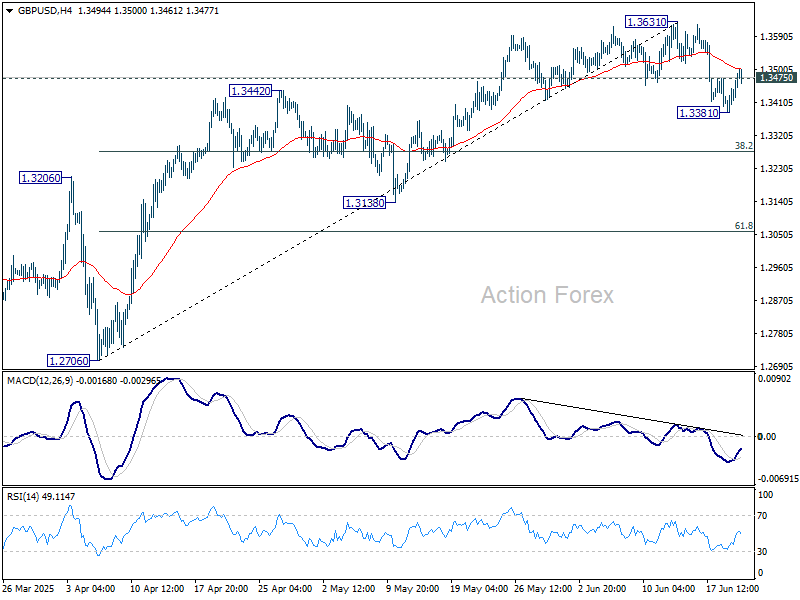
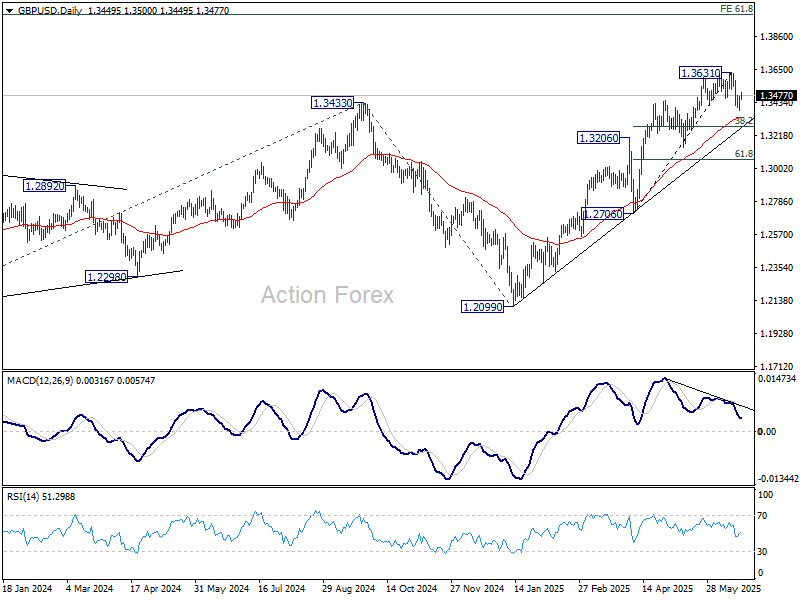
Intraday bias in GBP/USD is turned neutral with current retreat. Correction from 1.3631 short term top could still extend. Break of 1.3381 will bring deeper fall to 38.2% retracement of 1.2076 to 1.3631 at 1.3278. Nevertheless, firm break of 1.3631 will resume larger up trend.
In the bigger picture, up trend from 1.3051 (2022 low) is in progress. Next medium term target is 61.8% projection of 1.0351 to 1.3433 from 1.2099 at 1.4004. Outlook will now stay bullish as long as 55 W EMA (now at 1.2937) holds, even in case of deep pullback.
USD/CHF Daily Outlook
Daily Pivots: (S1) 0.8143; (P) 0.8180; (R1) 0.8203; More….
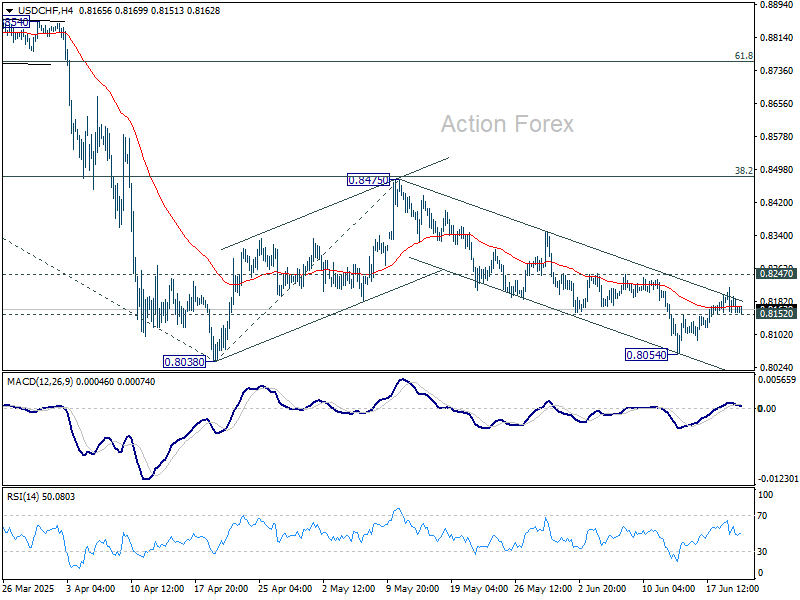
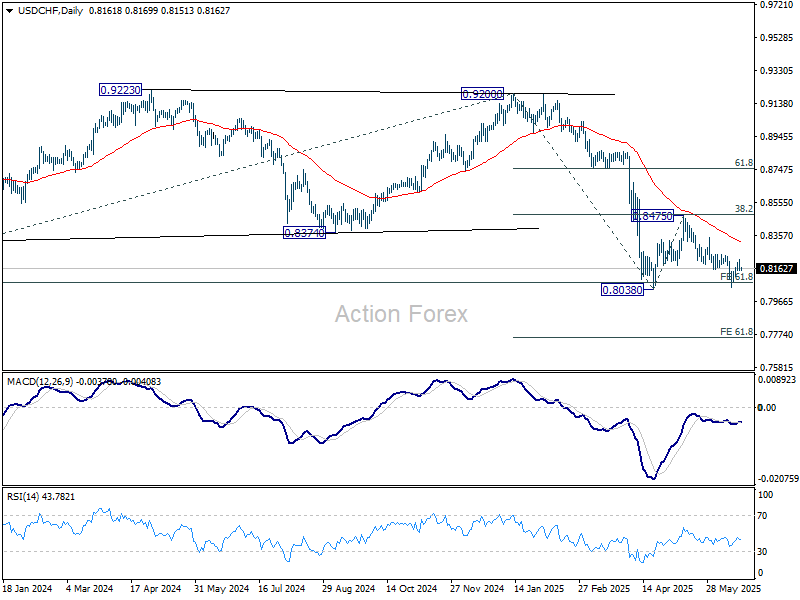
Intraday bias in USD/CHF remains neutral and outlook is unchanged. On the downside, break of 0.8152 minor support will argue that recovery from 0.8054 has completed after failing 0.8247 resistance. Deeper fall should be see to 0.8038/54 support zone. Firm break there will resume larger down trend to 61.8% projection of 0.9200 to 0.8038 from 0.8475 at 0.7757. Nevertheless, break of 0.8247 resistance will argue that corrective pattern from 0.8038 is starting the third leg. Bias will be turned back to the upside for 0.8475 resistance again.
In the bigger picture, long term down trend from 1.0342 (2017 high) is still in progress and met 61.8% projection of 1.0146 (2022 high) to 0.8332 from 0.9200 at 0.8079 already. In any case, outlook will stay bearish as long as 55 W EMA (now at 0.8656) holds. Sustained break of 0.8079 will target 100% projection at 0.7382.
AUD/USD Daily Report
Daily Pivots: (S1) 0.6447; (P) 0.6480; (R1) 0.6515; More...
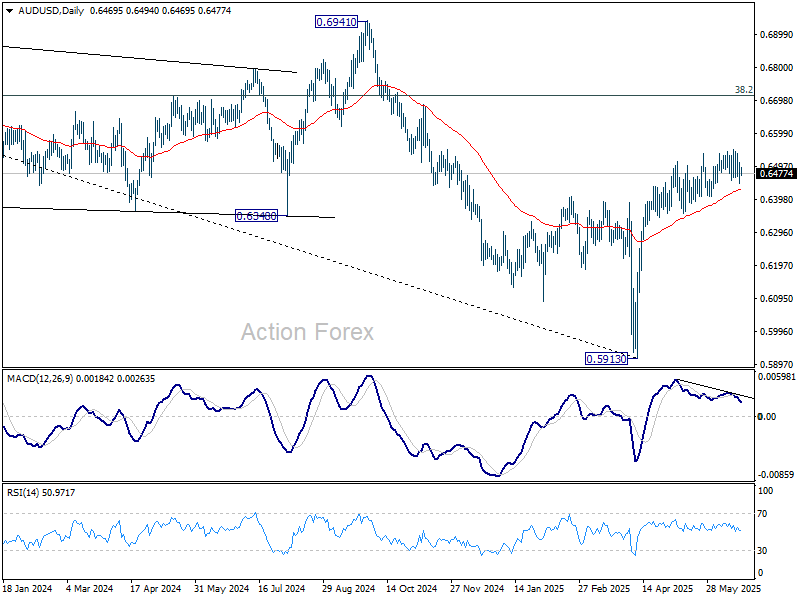
Intraday bias in AUD/USD remains neutral for the moment. On the downside, decisive break of 0.6455 support will indicate short term topping, with bearish divergence condition in 4H MACD. Intraday bias will be back on the downside for deeper pullback to 55 D EMA (now at 0.6429) and below. Nevertheless, strong rebound from current level, followed by break of 0.6651 resistance, will resume the rally from 0.5913 towards 0.6713 fibonacci level.
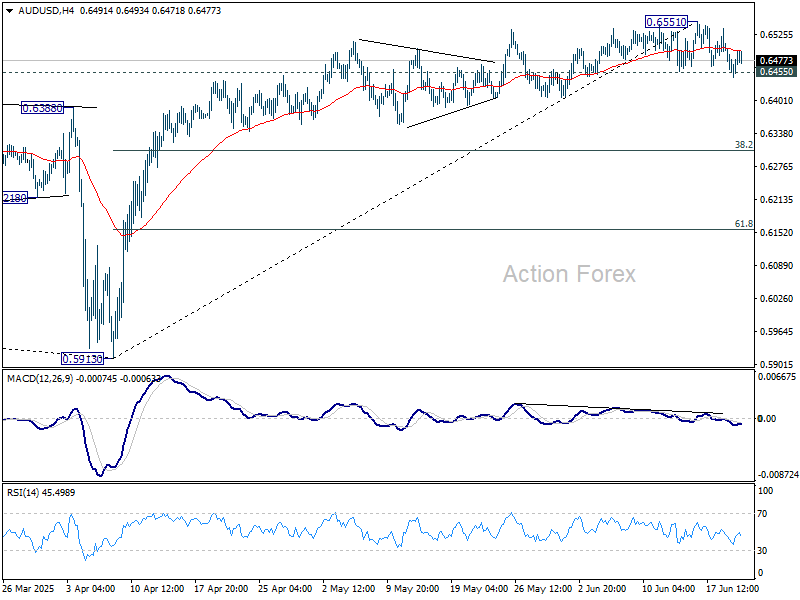
In the bigger picture, AUD/USD is still struggling to sustain above 55 W EMA (now at 0.6443) cleanly, and outlook is mixed. Sustained trading above 55 W EMA will indicate that rise from 0.5913 is at least correcting the down trend from 0.8006 (2021 high), with risk of trend reversal. Further rise should be seen to 38.2% retracement of 0.8006 to 0.5913 at 0.6713. However, rejection by 55 W EMA will revive medium term bearishness for another fall through 0.5913 at a later stage.
USD/CAD Daily Outlook
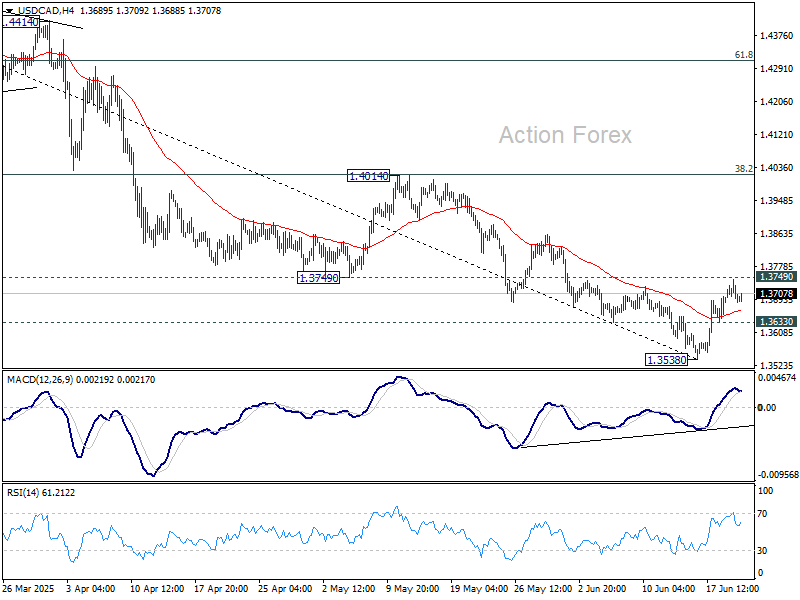
Daily Pivots: (S1) 1.3673; (P) 1.3710; (R1) 1.3737; More...
Intraday bias remains neutral first, and further decline is in favor with 1.3749 support turned resistance intact. On the downside, below 1.3633 minor support will bring retest of 1.3538 first. Firm break there will resume larger fall from 1.4791. However, considering bullish convergence condition in 4H MACD, firm break of 1.3749 will indicate short term bottoming, and bring stronger rebound back to 1.4014 resistance.
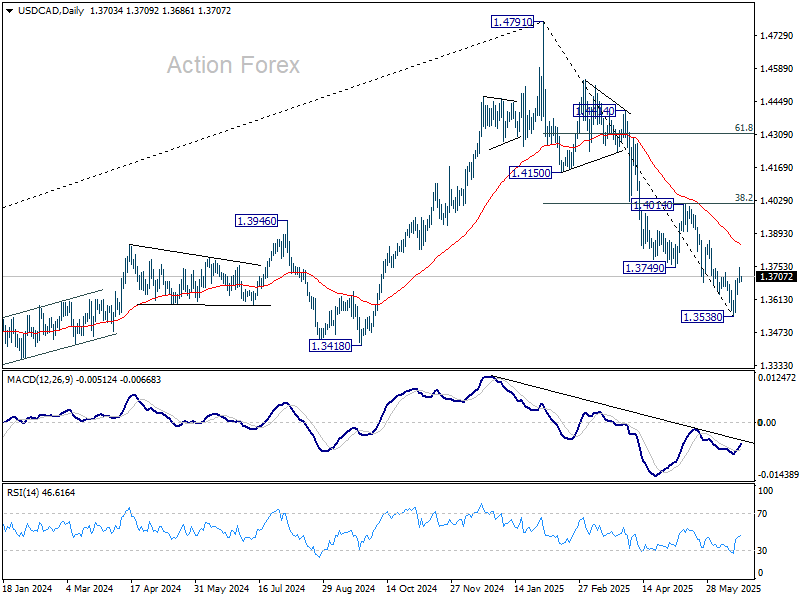
In the bigger picture, price actions from 1.4791 medium term top could either be a correction to rise from 1.2005 (2021 low), or trend reversal. In either case, further decline is expected as long as 1.4014 resistance holds. Next target is 61.8% retracement of 1.2005 (2021 low) to 1.4791 at 1.3069.
EUR/CHF Daily Outlook
Daily Pivots: (S1) 0.9360; (P) 0.9390; (R1) 0.9418; More....
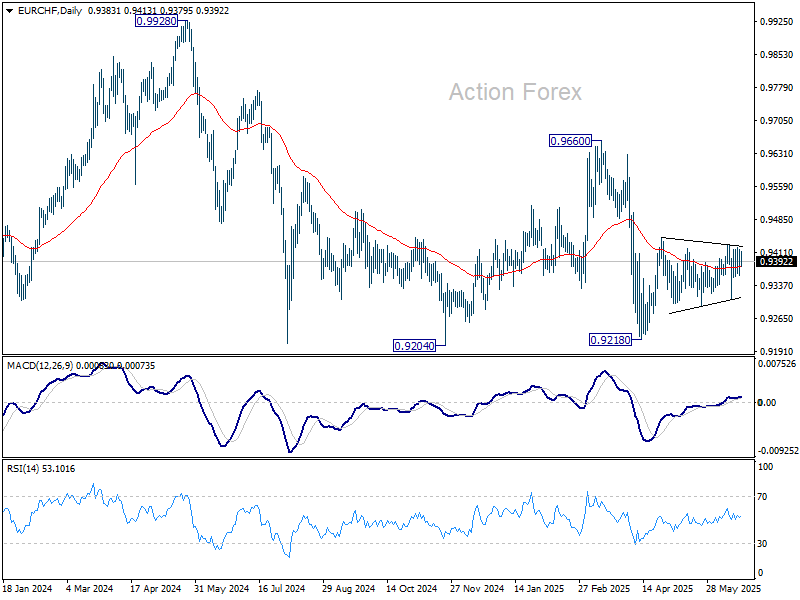
Intraday bias in EUR/CHF remains neutral as range trading is still in progress. On the upside, break of 0.9428 will resume the rebound from 0.9218 through 0.9445 resistance. However, break of 0.9291 will bring retest of 0.9218 instead.
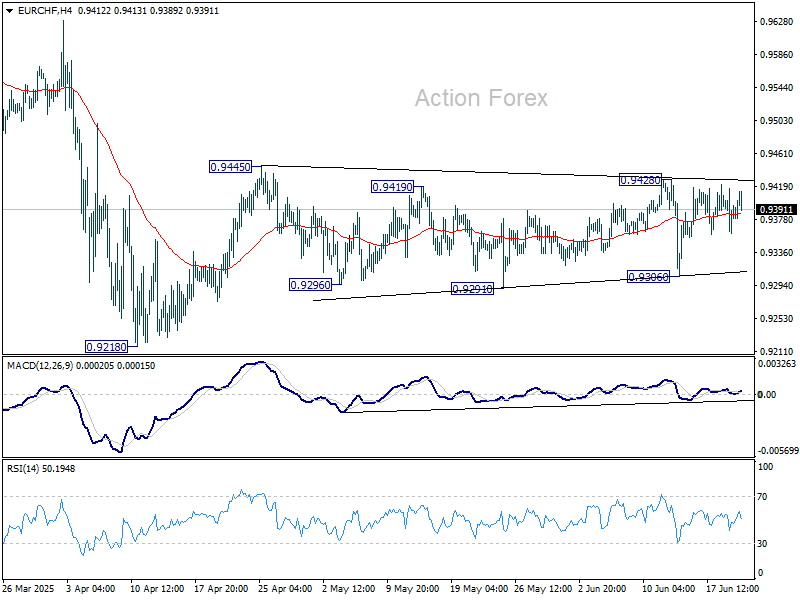
In the bigger picture, prior rejection by long-term falling channel resistance (now at 0.9527) retains medium term bearishness. That is, down trend from 1.2004 (2018 high) is still in progress. Firm break of 0.9204 (2024 low) will confirm resumption. This will remain the favored case as long as 0.9660 resistance holds.