Sample Category Title
EUR/CHF Daily Outlook
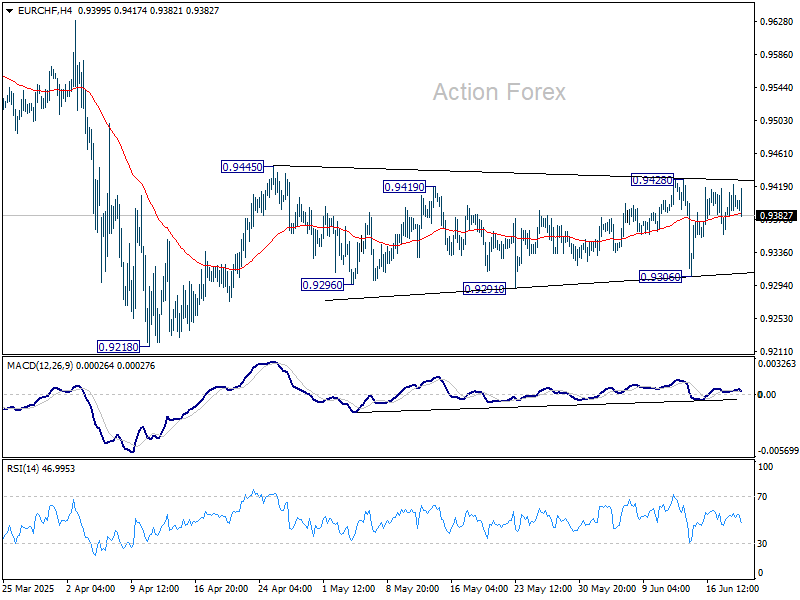
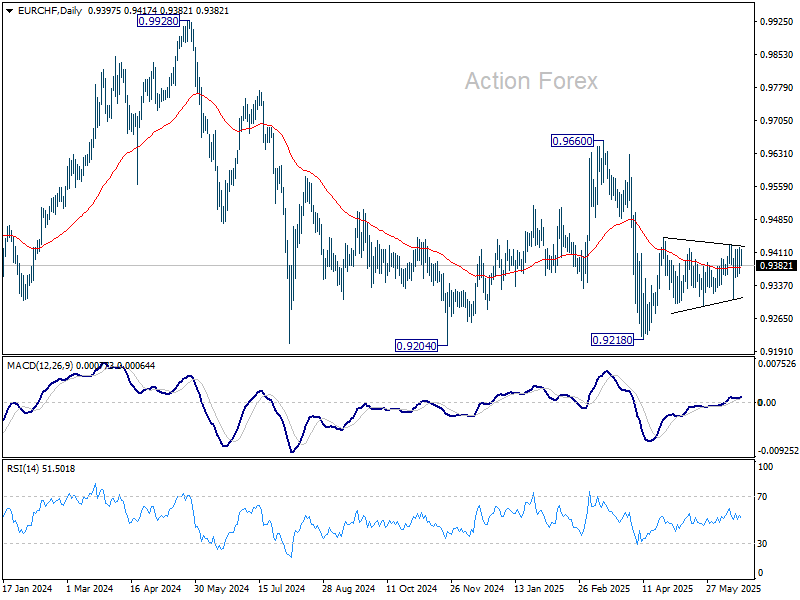
Daily Pivots: (S1) 0.9374; (P) 0.9399; (R1) 0.9428; More....
Sideway trading continues in EUR/CHF and intraday bias stays neutral at this point. On the upside, break of 0.9428 will resume the rebound from 0.9218 through 0.9445 resistance. However, break of 0.9291 will bring retest of 0.9218 instead.
In the bigger picture, prior rejection by long-term falling channel resistance (now at 0.9527) retains medium term bearishness. That is, down trend from 1.2004 (2018 high) is still in progress. Firm break of 0.9204 (2024 low) will confirm resumption. This will remain the favored case as long as 0.9660 resistance holds.
SNB cuts to zero, sees subdued growth as tariff front-loading fades
SNB lowered its policy rate by 25 bps to 0.00%, as widely expected. The move came as inflation pressures continue to ease and growth momentum slows following a front-loaded export boost in Q1. SNB noted that its conditional inflation forecast has been revised downward for 2025 and 2026, but still sees average inflation staying well within its price stability range through the forecast horizon.
The new projections put inflation at just 0.2% in 2025 (down from 0.4%), 0.5% in 2026 (down from 0.8%) and 0.7% in 2027 (down slightly from 0.8%). These figures assume that the policy rate remains at zero throughout the period. SNB said that without today’s cut, the forecast would have been even lower.
On the growth side, SNB acknowledged that the strength in Q1 GDP was driven largely by a pull-forward of US-bound exports — a pattern mirrored in other economies. When adjusted for these front-loaded flows, underlying momentum was "more moderate".. As a result, growth is expected to slow again and remain "rather subdued" over the remainder of the year. SNB projected GDP to rise just 1% to 1.5% this year and next.
(SNB) Swiss National Bank lowers SNB policy rate to 0%
The Swiss National Bank is lowering the SNB policy rate by 0.25 percentage points to 0%. The new policy rate applies from tomorrow, 20 June 2025. Banks' sight deposits held at the SNB will be remunerated at the SNB policy rate up to a certain threshold. The discount for sight deposits above this threshold remains unchanged at 0.25 percentage points.1 The SNB remains willing to be active in the foreign exchange market as necessary.
Inflationary pressure has decreased compared to the previous quarter. With today's easing of monetary policy, the SNB is countering the lower inflationary pressure. The SNB will continue to monitor the situation closely and adjust its monetary policy if necessary, to ensure that inflation remains within the range consistent with price stability over the medium term.
Inflation has declined further since the last monetary policy assessment. It decreased from 0.3% in February to -0.1% in May. This decline was mainly attributable to the development of prices in tourism and for oil products.
Compared to March, the new conditional inflation forecast is lower in the short term. In the medium term, there is hardly any change from March. The forecast is within the range of price stability over the entire forecast horizon (cf. chart). It puts average annual inflation at 0.2% for 2025, 0.5% for 2026 and 0.7% for 2027 (cf. table). The forecast is based on the assumption that the SNB policy rate is 0% over the entire forecast horizon. Without today's rate cut, the forecast would have been lower.
The global economy continued to grow at a moderate pace in the first quarter of 2025. The global economic outlook for the coming quarters has deteriorated due to the increase in trade tensions.
In its baseline scenario, the SNB anticipates that growth in the global economy will weaken over the coming quarters. Inflation in the US is likely to rise over the coming quarters. In Europe, by contrast, a further decrease in inflationary pressure is to be expected.
The scenario for the global economy remains subject to high uncertainty. For example, trade barriers could be raised further, leading to a more pronounced slowdown in the global economy. At the same time, it cannot be ruled out that fiscal policy will support growth more strongly than expected.
Swiss GDP growth was strong in the first quarter of 2025. However, this development was largely due to the fact that, as in other countries, exports to the US were brought forward. When adjusted for these effects, growth momentum was more moderate.
Following the strong first quarter, growth is likely to slow again and remain rather subdued over the remainder of the year. The SNB expects GDP growth of 1% to 1.5% for 2025 as a whole. The SNB currently also anticipates GDP growth of 1% to 1.5% for 2026. Unemployment is likely to continue to rise slightly.
The economic outlook for Switzerland remains uncertain. Developments abroad continue to represent the main risk.
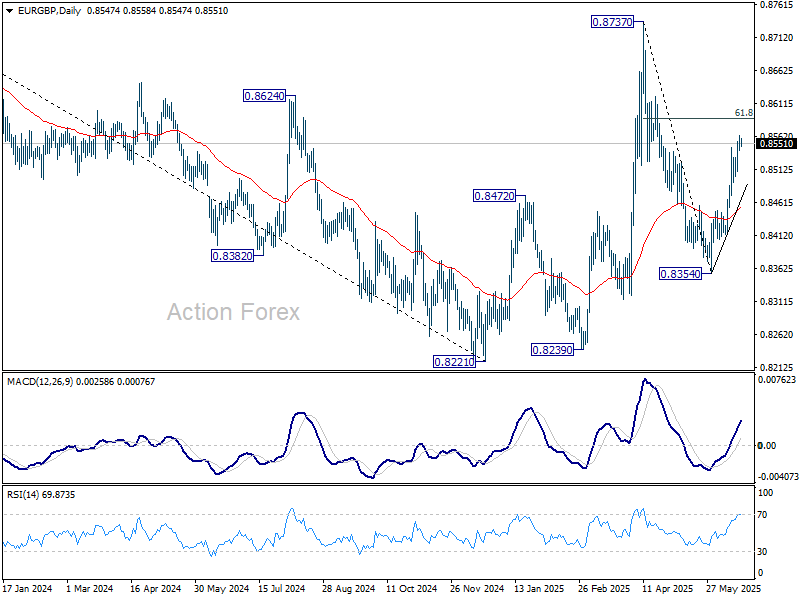
EUR/GBP Daily Outlook
Daily Pivots: (S1) 0.8544; (P) 0.8555; (R1) 0.8567; More...
Intraday bias in EUR/GBP stays mildly on the upside at this point. Current rise from 0.8354 should target 61.8% retracement of 0.8737 to 0.8354 at 0.8591. Firm break there will pave the way to 0.8373 resistance. For now, further rally will remain in favor as long as 0.8492 support holds, in case of retreat.
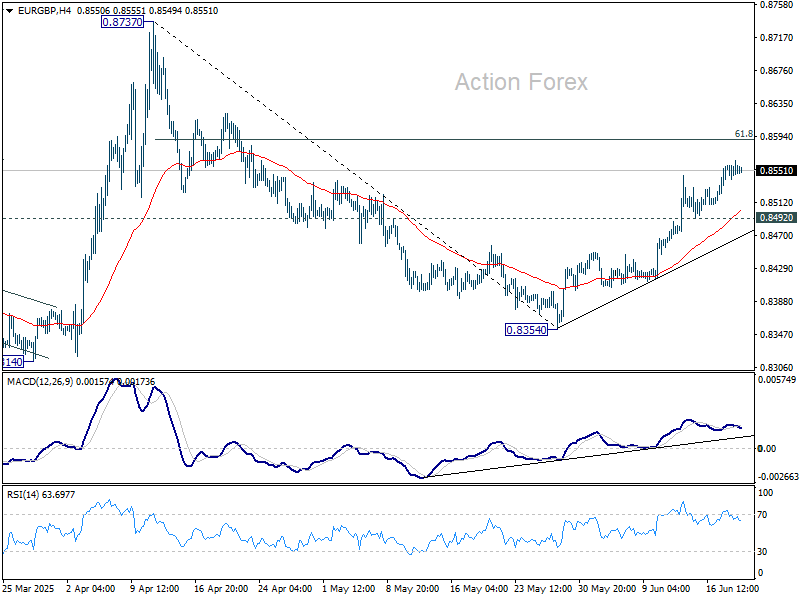
In the bigger picture, price actions from 0.8221 medium term bottom are merely forming a corrective pattern to the down trend from 0.9267 (2022 high). Nevertheless, there is no clear momentum to break through 0.8201 key support (2022 low) yet. Hence, range trading is expected between 0.8221/8737 for now.
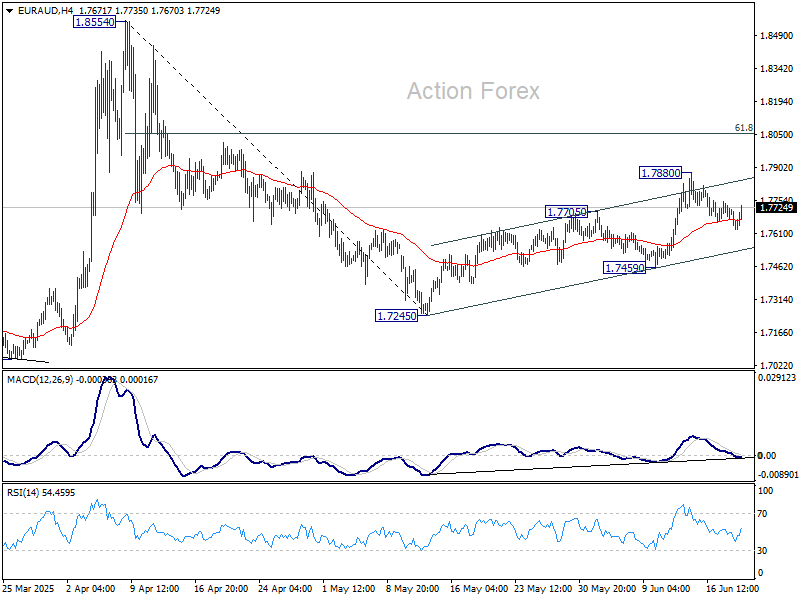
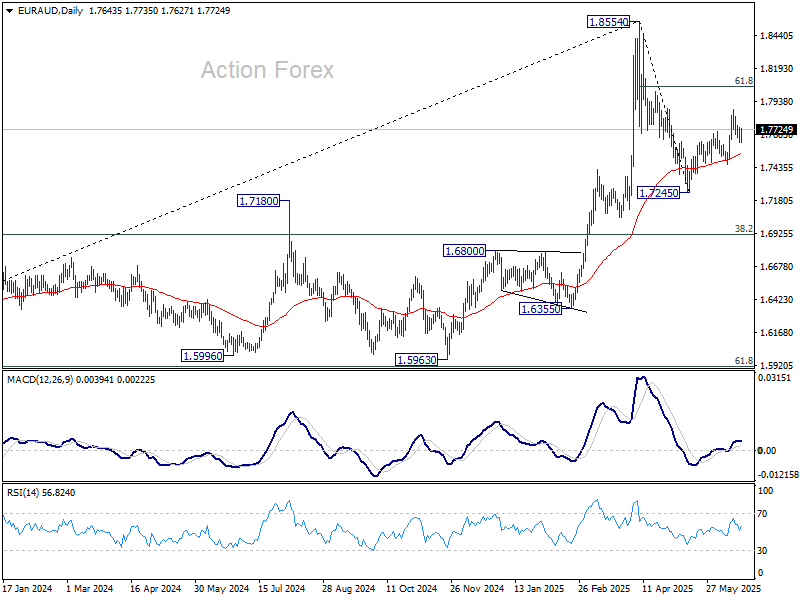
EUR/AUD Daily Outlook
Daily Pivots: (S1) 1.7602; (P) 1.7672; (R1) 1.7714; More...
Intraday bias in EUR/AUD remains neutral and more consolidations would be seen below 1.7880. Further rally is expected with 1.7459 support intact. Above 1.7880 will target 61.8% retracement of 1.8554 to 1.7245 at 1.8054. Firm break there will pave the way to 1.8554. However, break of 1.7459 will dampen this bullish view and bring deeper decline back to 1.7245 low.
In the bigger picture, with 55 W MACD staying well below signal line, 1.8554 is likely a medium term top already. Price actions from there are seen as a corrective pattern only. While deeper pullback might be seen, downside should be contained by 38.2% retracement of 1.4281 (2022 low) to 1.8554 at 1.6922 to bring rebound. Up trend from 1.4281 is still expected to resume at a later stage.
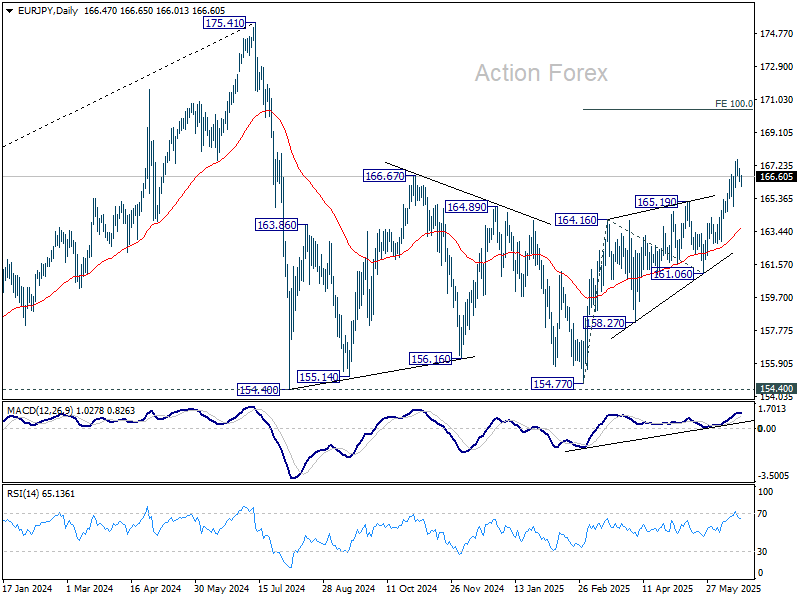
EUR/JPY Daily Outlook
Daily Pivots: (S1) 166.45; (P) 167.04; (R1) 167.36; More...
Intraday bias in EUR/JPY is turned neutral with current extended retreat. Some consolidations could be seen but further rally is expected as long as 164.91 support holds. Break of 167.59 will resume the rise from 154.77 to 100% projection of 154.77 to 165.19 from 161.06 at 170.45.
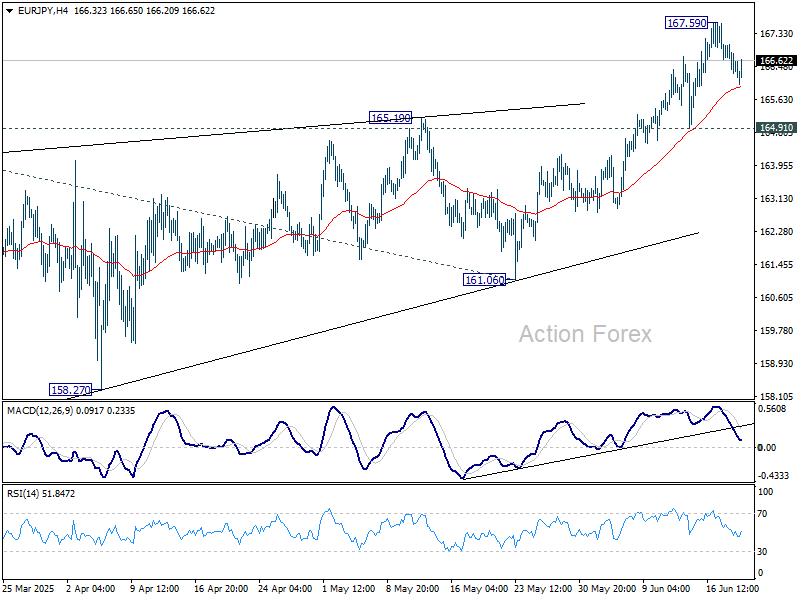
In the bigger picture, price actions from 175.41 are seen as correction to up trend from 114.42 (2020 low). Strong support should be seen from 38.2% retracement of 114.42 to 175.41 at 152.11 to contain downside. However, sustained break of 152.11 will bring deeper fall even still as a correction.
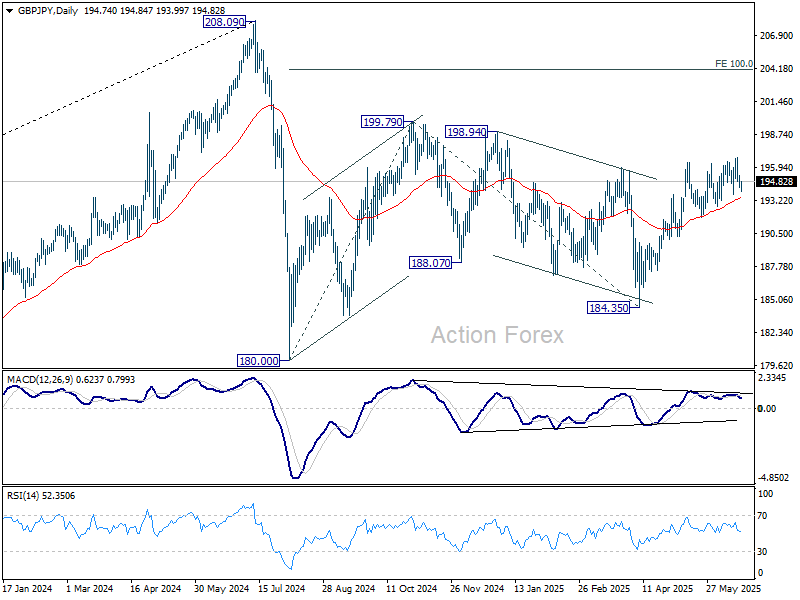
GBP/JPY Daily Outlook
Daily Pivots: (S1) 194.29; (P) 194.82; (R1) 195.30; More...
Intraday bias in GBP/JPY stays neutral for the moment, and further rise will remain in favor as long as 193.75 support holds. Firm break of 196.83 will target 199.79 resistance first. However, sustained break of 139.75 will indicate near term reversal and turn bias to the downside for 191.86 support and possibly below.
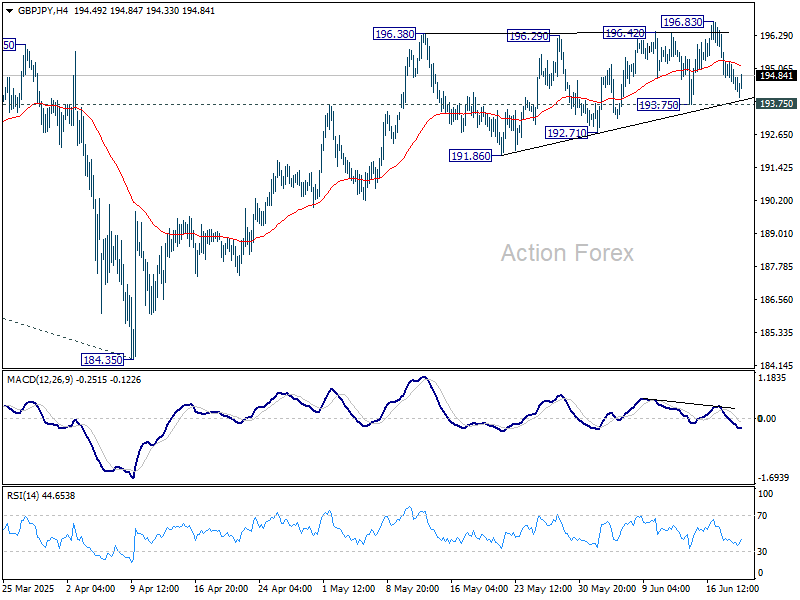
In the bigger picture, price actions from 208.09 are seen as a correction to rally from 123.94 (2020 low). Strong support should be seen from 38.2% retracement of 123.94 to 208.09 at 175.94 to contain downside. However, sustained break of 175.94 will bring deeper fall even still as a correction.
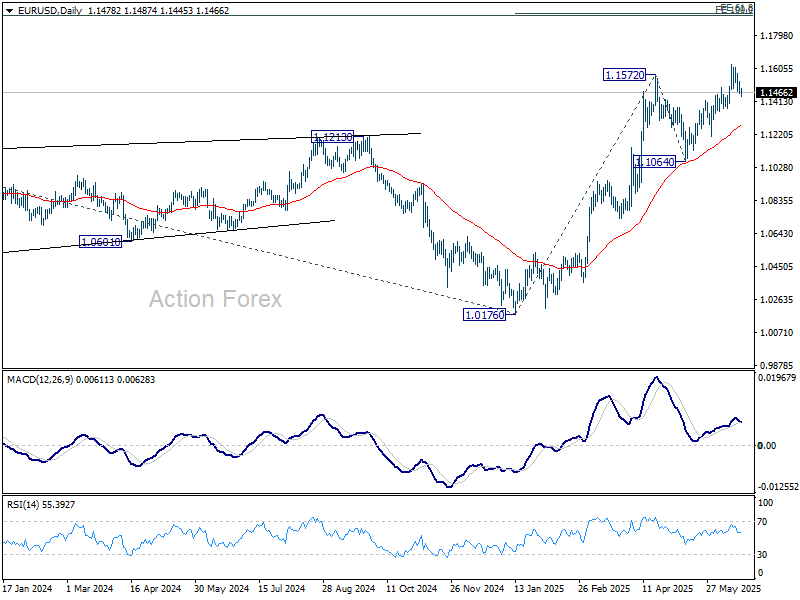
EUR/USD Daily Outlook
Daily Pivots: (S1) 1.1453; (P) 1.1491; (R1) 1.1522; More...
EUR/USD is staying in consolidations below 1.1630 and intraday bias remains neutral. With 1.1372 support intact, further rally is expected. Break of 1.1572 will extend the rise from 1.0176. Next target is 61.8% projection of 1.0176 to 1.1572 from 1.1064 at 1.1927. However, break of 1.1372 support will indicate short term topping, and turn bias to the downside for deeper pullback.
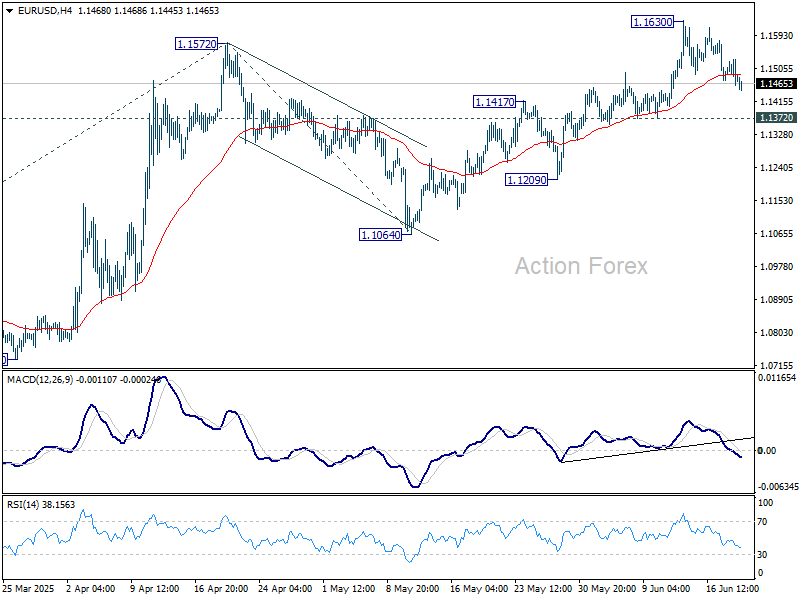
In the bigger picture, rise from 0.9534 long term bottom could be correcting the multi-decade downtrend or the start of a long term up trend. In either case, further rise should be seen to 100% projection of 0.9534 to 1.1274 from 1.0176 at 1.1916. This will now remain the favored case as long as 1.1604 support holds.
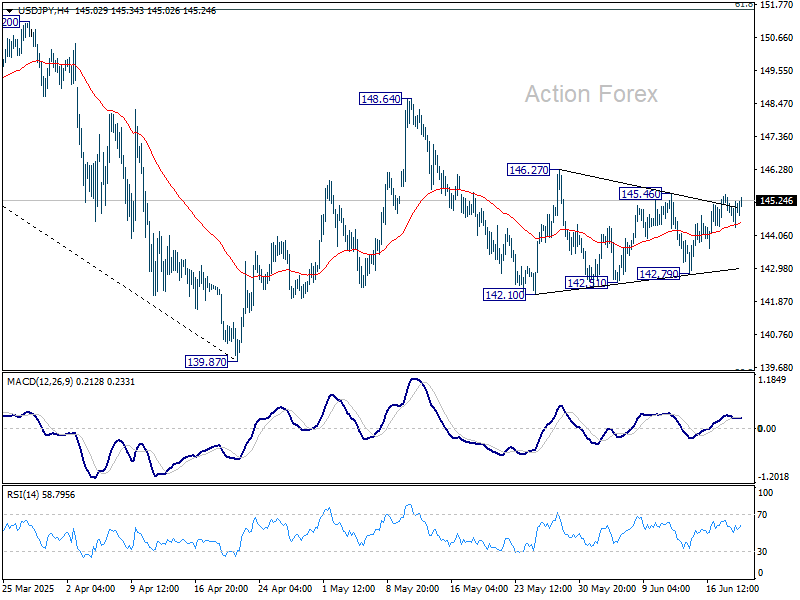
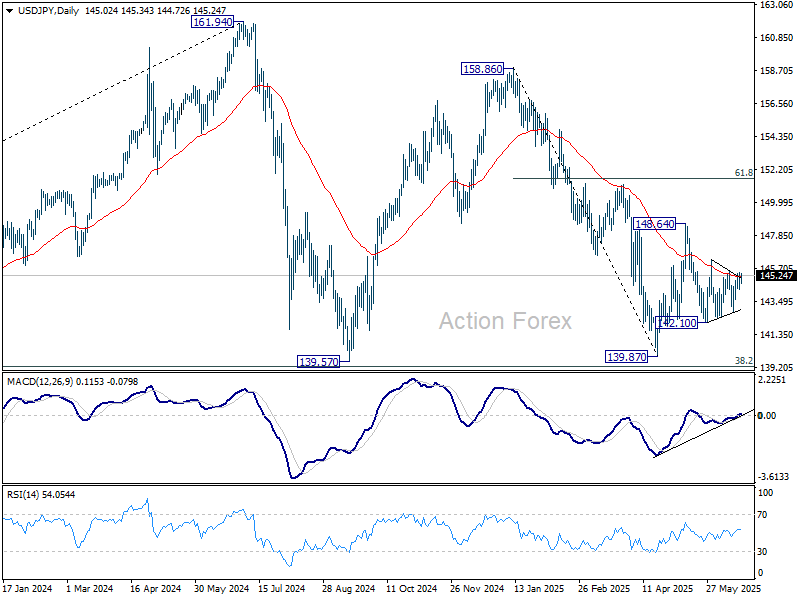
USD/JPY Daily Outlook
Daily Pivots: (S1) 144.49; (P) 144.96; (R1) 145.60; More...
Range trading continues in USD/JPY and intraday bias remains neutral. On the downside, break of 142.10 support will resume the fall from 148.64 to retest 139.87 low. On the upside, above 145.46 will turn bias to the upside for 146.27 first. Firm break there will target 148.64 resistance.
In the bigger picture, price actions from 161.94 are seen as a corrective pattern to rise from 102.58 (2021 low), with fall from 158.86 as the third leg. Strong support should be seen from 38.2% retracement of 102.58 to 161.94 at 139.26 to bring rebound. However, sustained break of 139.26 would open up deeper medium term decline to 61.8% retracement at 125.25.
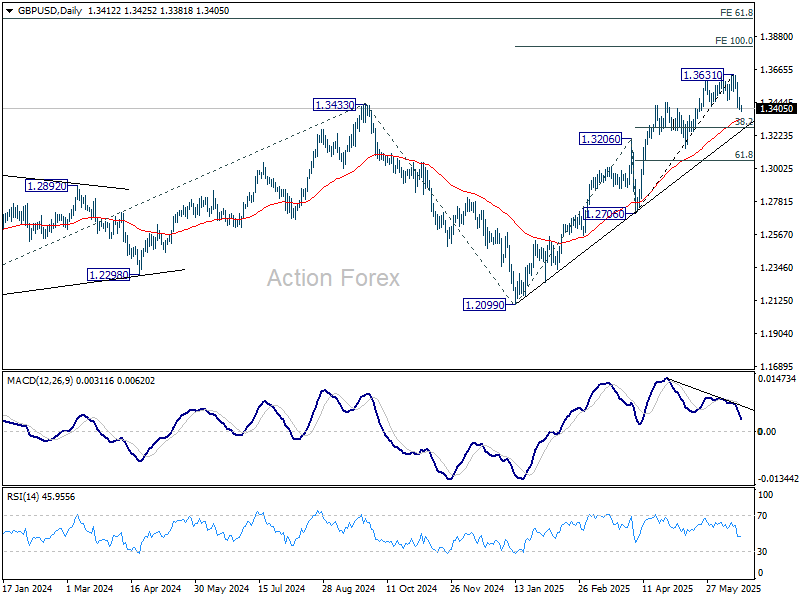
GBP/USD Daily Outlook
Daily Pivots: (S1) 1.3388; (P) 1.3433; (R1) 1.3465; More...
Intraday bias in GBP/USD remains on the downside at this point. Fall from 1.3631 short term top is in progress for 55 D EMA (now at 1.3330). Strong support could be seen there to bring rebound. On the upside, above 1.3475 minor resistance will turn intraday bias neutral first. However, sustained break of 55 D EMA will bring deeper correction to 38.2% retracement of 1.2706 to 1.3631 at 1.3278.
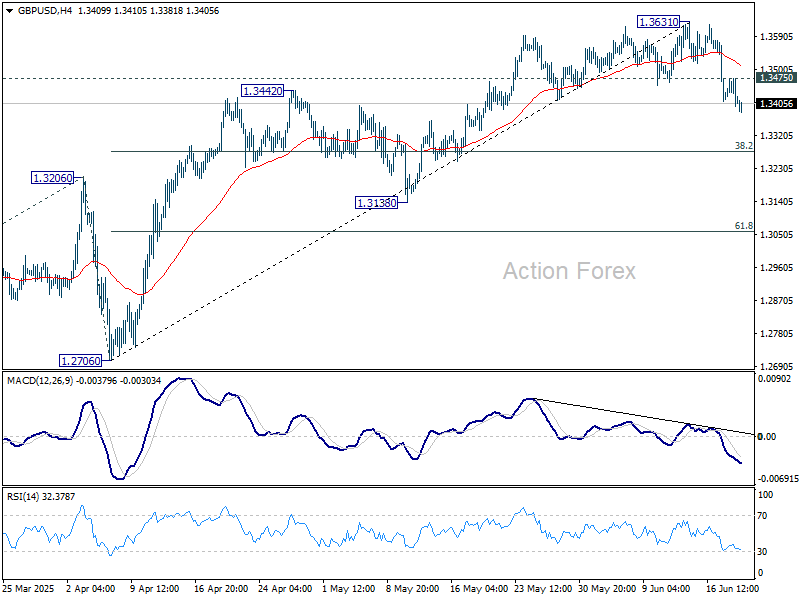
In the bigger picture, up trend from 1.3051 (2022 low) is in progress. Next medium term target is 61.8% projection of 1.0351 to 1.3433 from 1.2099 at 1.4004. Outlook will now stay bullish as long as 55 W EMA (now at 1.2937) holds, even in case of deep pullback.