Sample Category Title
USD/CHF Daily Outlook
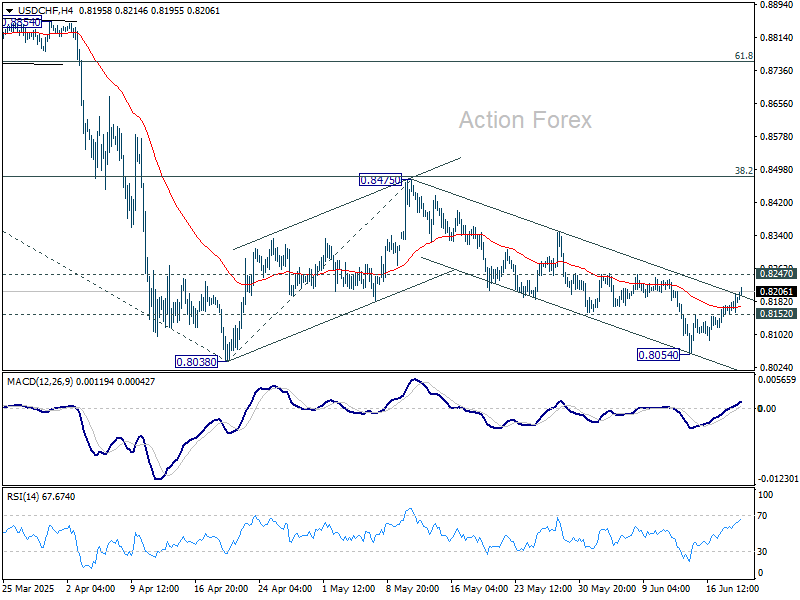
Daily Pivots: (S1) 0.8133; (P) 0.8153; (R1) 0.8184; More….
USD/CHF's rebound from 0.8054 extended higher today but stays below 0.8247 resistance. Intraday bias remains neutral. On the upside, break of 0.8247 resistance will argue that corrective pattern from 0.8038 is starting the third leg. Bias will be turned back to the upside for 0.8475 resistance again. On the downside, below 0.8152 minor support will bring retest of 0.8054 first. Further break of 0.8038 will resume larger down trend. Next target will be 61.8% projection of 0.9200 to 0.8038 from 0.8475 at 0.7757.
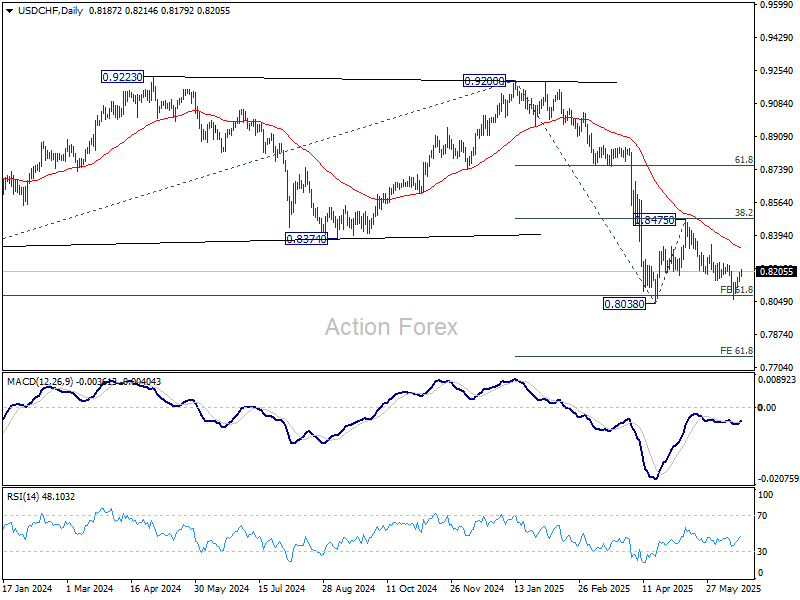
In the bigger picture, long term down trend from 1.0342 (2017 high) is still in progress and met 61.8% projection of 1.0146 (2022 high) to 0.8332 from 0.9200 at 0.8079 already. In any case, outlook will stay bearish as long as 55 W EMA (now at 0.8656) holds. Sustained break of 0.8079 will target 100% projection at 0.7382.
AUD/USD Daily Report
Daily Pivots: (S1) 0.6472; (P) 0.6505; (R1) 0.6542; More...
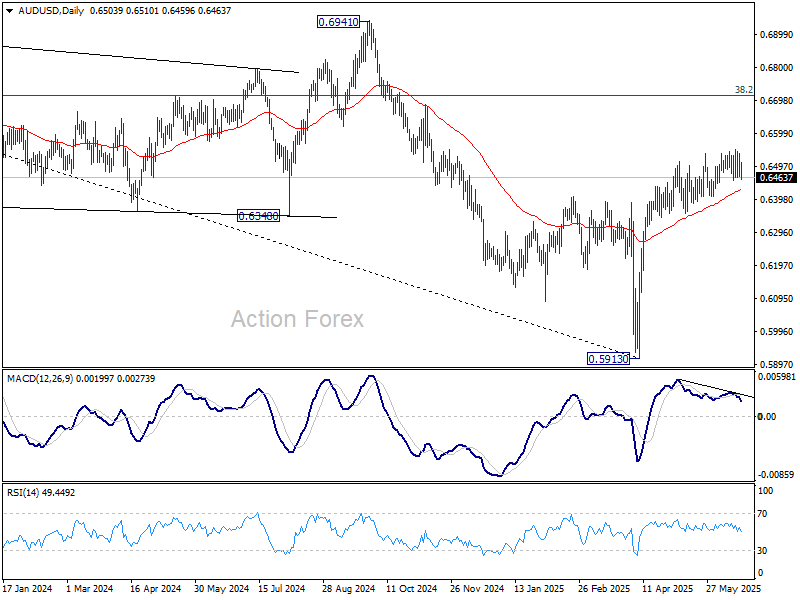
Intraday bias in AUD/USD stays neutral first. On the downside, decisive break of 0.6455 support will indicate short term topping, with bearish divergence condition in 4H MACD. Intraday bias will be back on the downside for deeper pullback to 55 D EMA (now at 0.6425) and below. Nevertheless, strong rebound from current level, followed by break of 0.6651 resistance, will resume the rally from 0.5913 towards 0.6713 fibonacci level.
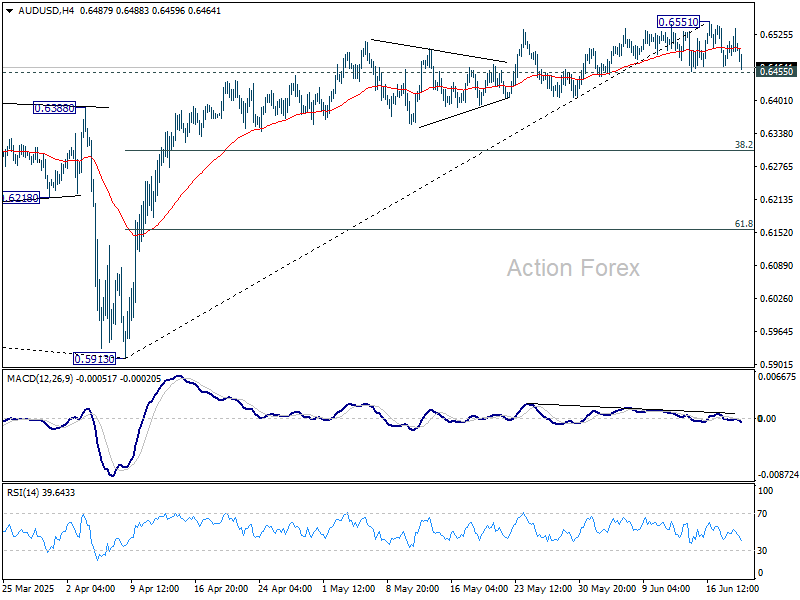
In the bigger picture, AUD/USD is still struggling to sustain above 55 W EMA (now at 0.6443) cleanly, and outlook is mixed. Sustained trading above 55 W EMA will indicate that rise from 0.5913 is at least correcting the down trend from 0.8006 (2021 high), with risk of trend reversal. Further rise should be seen to 38.2% retracement of 0.8006 to 0.5913 at 0.6713. However, rejection by 55 W EMA will revive medium term bearishness for another fall through 0.5913 at a later stage.
If Labour Market Starts Deteriorating, Fed Will Revert to Last Year’s Playbook
Markets
The Fed kept its policy rate unchanged yesterday at 4.25%-4.50% and sticks with its wait-and-see attitude. The current centerpiece holds: the price stability target is at bigger risk than the maximum employment target and therefore warrants an extension of the rate pause. Especially with inflation still above 2% while the current unemployment rate is in line with the projected NAIRU (4.2%). Compared to March, the Fed lifted its projected inflation path for both headline and core inflation by 0.3 ppt this year (3% & 3.1%), 0.2 ppt next year (both 2.4%) and 0.1 ppt in 2027 (both 2.1%). The growth outlook is weaker (1.4%-1.6%-1.8% from 1.7%-1.8%-1.8%) with the unemployment rate expected to be grinding slightly higher (4.5%-4.5%-4.4% from 4.4%-4.3%-4.3%). At the press conference, Fed Chair Powell acknowledged that the US central bank has to be humble about its ability to forecast how the dust will settle in the aftermath of US President Trump’s domestic (big beautiful bill) and trade policy. Testament to that is the split in views/suggestions on the level of the policy rate by year-end (only six months to go) in the updated dot plot. Views range between status quo (7) over one (2), two (8) or even three (2) policy rate cuts. Powell suggested that they were going to learn a great deal more over the summer on tariffs as they work their way through the economy. He added that the timing for rate cuts could come quickly or could not come quickly. We stick to the view that once/if the labour market starts deteriorating (eg break Fed’s SAHM recession rule), the Fed will revert to last year’s playbook and initially use bigger rate cuts (50 bps) moving its way to a more neutral stance. The exact timing is very hard to pinpoint (very earliest in September). Looking at the market reaction, Fed Chair Powell succeeded in showcasing confidence while actually still navigating by the stars under cloudy skies. Daily changes on the US yield curve were limited to -1 bp. EUR/USD closed exactly unchanged at 1.1480. The scorecard for key US equity benchmarks varied between -0.1% for Dow and +0.13% for Nasdaq. Investors probably also remained sidelined awaiting potential US involvement in Israeli attacks against Iran(‘s nuclear treat) and given today’s US public holiday (Juneteenth). European focus switches to central bank meetings in Switzerland (back to 0%), Norway (still unchanged) and the UK (sticking with quarterly cutting cycle so unchanged today and new rate cut in August). Sterling is vulnerable to more losses is BoE emphasizes most recent weak labour market report and with probability of August 25 bps rate cut currently at 70%.
News & Views
Brazil’s central bank (BCB) hiked rates yesterday to a 19-year high of 15%. Inflation is running above the 3% target and even above the 4.5% ceiling of the tolerance range. The economy is resilient amid low unemployment and government spending, offsetting the risks that global trade uncertainty poses. A “significantly contractionary monetary policy” stance in such circumstances is required, the BCB said. Brasilia has hiked rates for a seventh time straight since last September. Yesterday’s is likely to be the final one for an extended period though. The BCB said that “if the expected scenario materializes, the Committee foresees an interruption of the rate hiking cycle to examine its yet-to-be-seen cumulative impacts.” It assumes a long enough stable rate at 15% should bring down inflation eventually to 3.6% in 2026. Brazilian prices rose by 5.32% in May. This compared to the post-pandemic peak of 12.13% which back then required a 13.75% policy rate. The Brazilian currency has yet to respond to yesterday’s after-market decision but the real had a bumper year so far. After hitting a record low against end 2024, the real strengthened against the USD from USD/BRL 6.2 to 5.5 currently.
Australian employment fell by 2.5k in May, falling short of the 21.2k expectations. The drop followed a 88k surge in April and came on the account of part-time jobs (-41k). Australia’s bureau of statistics reported a similar drop in the amount of the unemployed, leading to a steady unemployment rate of 4.1%, the head of the ABS labour department said. The participation rate ticked lower from 67.1% to 67%, still among the highest rates in the series’ history. That suggests the labour market, despite May’s drop, is still in good shape. With inflation, especially underlying gauges, in the high end of the 2-3% target range, it means the central bank needs to tread carefully with rate cuts. The RBA cut in May to 3.85% and saw the policy rate settling around 3.2% next year. Money markets attach an 80% probability for a next move in July. The Australian dollar’s reaction was a muted one. AUD/USD trades around 0.648.
Back to 0%?
‘Someone has to pay,’ said Federal Reserve (Fed) Chair Jerome Powell at yesterday’s post-decision presser, after the Fed kept rates unchanged as widely expected – and priced in – by global markets. “Everyone that I know is forecasting a meaningful increase in inflation in coming months from tariffs, because someone has to pay for the tariffs,” he added.
Accordingly, the Fed raised its year-end inflation forecast to 3.1%, up from 2.8% pencilled in in March, and lowered its 2024 growth forecast to 1.4%, down from 1.7%.
The dot plot still shows two rate cuts this year – but that median projection doesn’t tell the full story. There’s now a growing divide within the Fed: while 8 members expect rates to fall by 50bp (matching two cuts), 7 see no change – up from just 4 at the previous meeting. Two members anticipate one cut. That’s now almost a 50-50 split between no cuts and a 50bp reduction.
The market reaction to the Fed decision wasn’t exactly cheery. The S&P 500 fell after the decision, though the US 2-year yield eased. Meanwhile, Fed funds futures show a slightly higher probability of a September cut than before the meeting. Investors seem inclined to see the glass half full – hoping for two cuts – rather than half empty, with none.
The US dollar was in doji mode yesterday but is stronger this morning, perhaps supported by a relatively cautious Fed tone and some flight to safety. There are rumours the US could become directly involved in Middle East tensions as soon as this weekend. That alone could attract defensive flows into the dollar ahead of a potentially critical weekend – regardless of Fed policy.
There’s also little reason to pile into risk assets amid such elevated geopolitical risk. If tensions escalate, there’s arguably no better shelter than oil, gold, the US dollar, and the Swiss franc.
Fun fact before we move to the BoE and SNB: Powell’s term ends next May, and he’ll likely be replaced by someone more aligned with Trump’s preference for lower rates. Traders are already selling March 2026 SOFR contracts and buying June ones in anticipation.
But here’s the catch: if Powell’s successor cuts rates without a solid macro rationale – just to please Trump or boost risk sentiment – markets might not respond as expected. Remember last September, when Powell cut by 50bp despite no urgent need? Yields actually rebounded. Bottom line: rate cuts only help risk assets if markets believe they’re justified.
US and European futures are down, with the exception of FTSE futures, which are pointing higher thanks to a softer sterling and stronger appetite for energy and defence plays as geopolitics heat up.
BoE preview
The Bank of England (BoE) is expected to keep rates unchanged today, but debate is likely to be heated both within the MPC and outside it.
While yesterday’s data showed inflation cooling more slowly, the dovish chorus remains loud, still questioning the reliability of ONS data and worried that the budget might be doing more harm than good to the UK economy.
Markets now expect the BoE to stand pat this month, but signal a cut in August.
Cable is down this morning, testing its 50-DMA to the downside – partly on the back of a stronger dollar, and partly due to some unwinding of dovish BoE bets after the CPI print.
While cable’s direction is often more tied to broader dollar dynamics, the EURGBP’s recent surge warns that markets are losing confidence in the UK growth story... just saying.
Back to 0%?
The Swiss National Bank (SNB) will likely lower its policy rate to 0% this morning, as trade uncertainty lingers and the franc stays firm.
Even though rising geopolitical tensions helped put a floor under the USDCHF last week, the EURCHF still trades near its lowest levels since the euro launched, and is not looking like it would reverse course anytime soon.
Of course, a rate cut may not even dampen franc demand and the SNB could be brought to revisit negative rates later this year, or the next.
Low interest rates support investment and growth. But negative rates, while sometimes effective, can distort financial system equilibrium. They squeeze commercial banks, reduce profitability, and weaken lending capacity – ultimately weighing on the economy. Excessively low rates also risk over-indebtedness, deter foreign investment, and challenge Switzerland’s ability to attract capital.
The SMI has notably lagged US and European peers since the April 2 rebound, partly due to the strong franc, partly due to trade uncertainties.
When it comes to franc, Switzerland has weathered a strong franc for decades. Its financial and industrial bases are solid, and investor confidence in the Swiss economy – beyond banks and chocolate – remains anchored in innovation and specialization. But trade uncertainties are proving toxic, and it’s not clear that lower rates alone will offer much of an antidote.
Will SNB Cut Policy Rates Back to Zero?
In focus today
Central bank rate decisions are again in the spotlight with the Swiss National Bank (SNB) this morning followed by Norges Bank (NB) and the Bank of England (BoE).
We expect the SNB to deliver a final cut, cutting the policy rate by 25bp to 0%. Markets are pricing 30bp for the meeting. Inflation continues to undershoot the SNB's forecast and while a 50bp cut is possible, we think the SNB will stick with a smaller 25bp cut and if necessary, commence FX intervention to weaken the Swiss Franc before lowering into negative territory.
The BoE is expected to keep the Bank rate unchanged at 4.25 in line with market and consensus pricing. Recent data has surprised to the downside and in our opinion, this supports the notion of further quarterly cuts ahead. For more on our take see Bank of England Preview, 13 June.
On a similar note, we anticipate that Norges Bank will likely leave rates unchanged and marginally lower the rate path. Most importantly, we think that Norges Bank will stick to its message of two cuts this year, with the first one in September.
Markets are closely eyeing the possible involvement of the US in the Israel-Iran conflict. According to sources familiar with the matter, senior US officials are preparing for the possibility of a strike on Iran in the days ahead. The uncertainty was not alleviated by US President Trump speaking at the White House said "I may do it. I may not do it. I mean, nobody knows what I'm going to do,".
In Sweden at 8:00 CET, both monthly and quarterly inflation expectations from Origo are released. The quarterly figures will be particularly interesting, as the previous data remained elevated, and we anticipate a slight decrease.
Overnight, Chinese loan prime rates will be set but are expected to stay unchanged as they were lowered last month with 1Y at 3.00% and 5Y at 3.50%. Additionally, we get May inflation data from Japan. It will be interesting to see if Japan continues to have the 'wrong' kind of inflation, namely inflation not driven by spending growth.
Economic and market news
What happened yesterday
In the US, the Fed kept monetary policy unchanged at 4.25-4.5% as widely expected. The 'dots' still signal two 25bp cuts in 2025 and the GDP forecast was revised down. The policy statement was left almost untouched, apart from omitting: "[committee] judges that the risks of higher unemployment and higher inflation have risen", referring to peak trade war uncertainty easing. Fed Chair Powell provided no clear signals for the market, repeating that "policy is in a good place". We continue to expect the Fed will resume rate cuts from September and cut twice in 2025 followed by three more cuts in 2026. Read more in our Fed review: Waiting for clarity, 18 June.
In Sweden, the Riksbank cut the policy rate by 25bp to 2.00% in line with consensus expectations, but against our call for it to remain unchanged. Additionally, the central bank opened the door for another cut later this year, although global uncertainty and unrest continue to weigh on the outlook. Following the announcement, there was a relatively muted reaction in the SEK, but we would not be too surprised to see EUR/SEK edge slightly higher over the coming weeks as the (albeit small) risk of a 'hawkish' surprise at today's meeting did not materialise.
In the euro area, the final inflation report confirmed the flash release, showing inflation at 1.9% y/y and core at 2.3% y/y. Details show that the larger than expected increase in euro area HICP inflation back in April was due to mainly seasonal effects from the timing of Easter. This is visible in the details for May where "transport services" fell back to 1.9% y/y after rising 7.8% y/y in April. Package holidays also declined to 0.9% y/y in May following an increase of 8.6% y/y in April.
The final data allows a calculation of the 'LIMI' indicator of domestic inflation. The indicator declined from 3.9% y/y to 3.8% y/y while momentum increased slightly. This shows that there is still an elevated inflation pressure in domestic inflation, which is a hawkish argument, amid headline inflation dipping below target. Yet, wage growth is the main driver of domestic inflation, and the elevated pressure reflects previous wage increases, so we do expect domestic inflation to fall in the second half of the year as wage growth is coming down.
In the UK, CPI for May was a bit of a mixed bag with stronger headline and weaker services than expected. Headline at 3.4% y/y (cons: 3.3%, prior: 3.5%), core at 3.5% (cons: 3.5%, prior: 3.8%) and importantly, services dropped to 4.7% y/y (cons: 4.8%, prior: 5.4%). The large drop in services is due to the timing of Easter, which pushed last month's print higher and a wrongful overestimation by the ONS of the increase in road tax in April. This should not be a game changer for the BoE decision released today.
Equities: Despite a heavy flow of geopolitical headlines, a rich macro calendar, and significant central bank meetings on both sides of the Atlantic, financial markets barely moved yesterday. Equities were broadly unchanged, and the same was true across fixed income and most alternative asset classes. Sector performance in equities was muted as well, though tech managed a mild outperformance - largely on the back of idiosyncratic news flow rather than macro or policy shifts. In the US yesterday, Dow -0.1%, S&P 500 -0.03%, Nasdaq +0.1% and Russell 2000 +0.5%. This morning, sentiment has turned more negative: equity markets across Asia are in the red, led by Hong Kong where Chinese stocks are down just over 2%. Futures in both Europe and the US point lower as we head into the session.
FI and FX: Risk sentiment was neutral through yesterday's session with global equities closing roughly unchanged. Last night's FOMC meeting was perceived as being roughly neutral in markets, with only a marginal impact on US Treasury yields. The Fed pricing was little changed, with 18bp still priced for September and around 48bp of easing priced for the full year. EUR/USD hovered around 1.15 throughout the session, while EUR/GBP ended the day close to unchanged as UK CPI failed to spur a big market reaction. EUR/SEK edged higher throughout the session, trading above 11 for the first time since early May, following the Riksbank's 25bp cut in the morning. The oil price (Brent) was unchanged at USD76.5.
USD/CAD Daily Outlook
Daily Pivots: (S1) 1.3650; (P) 1.3677; (R1) 1.3718; More...
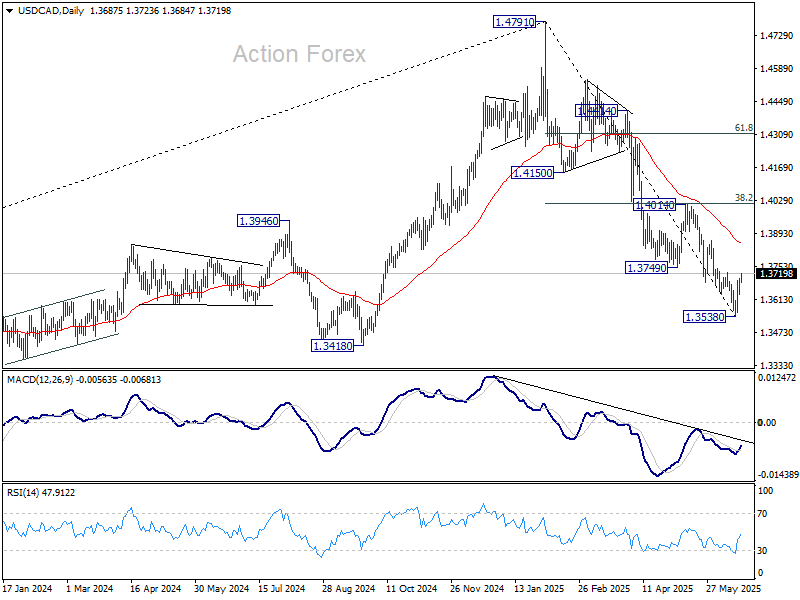
USD/CAD's rebound from 1.3538 extended higher, but stays below 1.3749 support turned resistance. Intraday bias remains neutral, and further decline is expected. On the downside, below 1.3633 minor support will bring retest of 1.3538 first. Firm break there will resume larger fall from 1.4791. However, considering bullish convergence condition in 4H MACD, firm break of 1.3749 will indicate short term bottoming, and bring stronger rebound back to 1.4014 resistance.
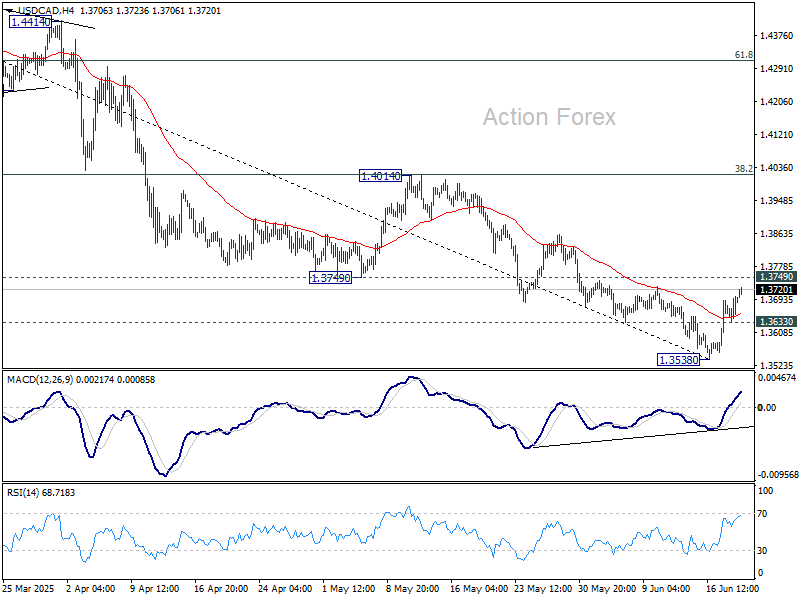
In the bigger picture, price actions from 1.4791 medium term top could either be a correction to rise from 1.2005 (2021 low), or trend reversal. In either case, further decline is expected as long as 1.4014 resistance holds. Next target is 61.8% retracement of 1.2005 (2021 low) to 1.4791 at 1.3069.
Dollar Firms as Fed Embraces Caution Over Tariff-Driven Inflation; SNB and BoE Next
Dollar strengthened broadly in the wake of Fed’s policy decision overnight, although upside momentum remains measured. On the one hand, the updated dot plot maintained projection of two rate cuts in 2025. On the other hand, Chair Jerome Powell offered little to reinforce that view. Instead, he bluntly acknowledged that none of the rate path projections are held “with a great deal of conviction”. His message was clear: monetary policy will remain on hold until the inflationary effects of tariffs are more fully understood.
Powell’s remarks were notably direct regarding tariffs, warning that a "meaningful increase in inflation" is widely expected in the coming months as costs ripple through supply chains. He stressed that Fed needs to observe how this pass-through plays out before taking action. “We’ll make smarter and better decisions if we just wait a couple of months,” Powell stated. The remark underlined a broader message of caution and patience, especially as the 90-day tariff truce edges toward expiration.
With Fed now behind, attention turns to SNB and BoE, both announcing decisions today. SNB is widely expected to cut its policy rate to zero amid rising deflation risks and sustained strength in Swiss Franc. For BoE, the market is looking beyond an expected hold at 4.25% to the internal vote composition and tone of guidance. Most analysts still expect the next rate cut to arrive in August, but divisions within the MPC remain a key focus.
In currency markets, Dollar has emerged as the week's top performer so far, lifted by Powell's pragmatism and Fed’s refusal to front-run uncertain inflation developments. Aussie and Kiwi are also holding firm. At the other end, Sterling remains the weakest major, followed by Swiss Franc and Loonie. Euro and Yen are trading mid-pack.
Overall, price action across the board reflects the continued hesitancy among traders to take strong directional views. Major pairs remain largely within recent ranges, but the Dollar's mild bullish drift signals that in times of uncertainty, the greenback still commands safe-haven preference, particularly with the Fed anchoring policy to incoming inflation clarity.
In Asia, at the time of writing, Nikkei is down -0.88%. Hong Kong HSI is down -1.72%. China Shanghai SSE is down -0.66%. Singapore Strait Times is down -0.34%. Japan 10-year JGB yield is down -0.02 at 1.436. Overnight, DOW fell -0.10%. S&P 500 fell -0.03%. NASDAQ rose 0.13%. 10-year yield rose 0.004 to 4.397.
Fed holds steady but upgrades inflation path, slower easing ahead
As expected, Fed left interest rates unchanged at 4.25%–4.50%, with all FOMC members voting in favor of the decision. The real focus was on the revised projections, which revealed a cautious shift: while two rate cuts remain penciled in for 2025, the pace of easing slows meaningfully beyond that.
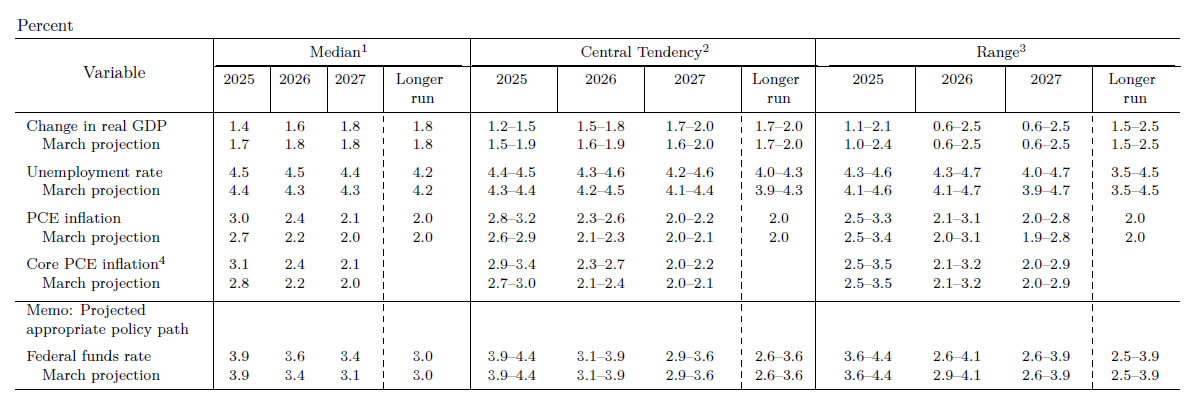
The median forecast now puts the federal funds rate at 3.6% by the end of 2026, up from 3.4% previously, and 3.4% by the end of 2027, up from 3.1%. This implies only one cut per year after 2025. The change suggests that the Fed is growing more concerned about stickier inflation, particularly as tariff-related price effects take longer to dissipate.
Inflation forecasts were lifted meaningfully. Headline PCE inflation is now expected to run at 3.0% in 2025, up from 2.7% previously, before easing to 2.4% in 2026 and 2.1% in 2027. Core PCE projections followed a similar pattern, raised to 3.1% in 2025 from 2.8% in March. These changes reflect Fed’s acknowledgment of tariff-related price pressures filtering through the economy more persistently than previously assumed.
Meanwhile, growth forecasts were trimmed, with real GDP now seen expanding just 1.4% in 2025, down from 1.7%. The 2026 estimate was also reduced from 1.8% to 1.6%. However, the unemployment rate is expected to remain relatively stable, only nudging up to 4.5% in 2025 and holding near that level through 2027.
The slight upward drift in the unemployment forecast likely reflects this softer growth outlook, though the impact is not severe enough to force Fed’s hand.
Overall, the message is clear: while cuts are still on the table, the Fed is prepared to ease more slowly and less deeply than markets had hoped. With tariffs adding upward pressure on prices but not severely denting the labor market, policymakers are likely to remain in wait-and-see mode, calibrating their response carefully.
SNB Poised to Cut, BoE Faces Divided Path
Attention is on two key central bank decisions today, SNB and BoE.
SNB kicks off at 7:30 GMT and is widely expected to deliver a 25bps rate cut, bringing the policy rate back to 0.00%. Speculation about a return to negative rates has intensified after Swiss CPI dipped into deflation at -0.1% yoy in May. While Chair Martin Schlegel has downplayed the importance of a single data point, he has remained open to using negative rates again if disinflation proves persistent.
The Swiss central bank faces a complicated backdrop. A stronger Swiss Franc—driven by haven flows amid the global trade war, Middle East conflict, and lingering Russia-Ukraine war—has intensified deflation risks. Euro's strength on the back of expected fiscal expansion in Germany and the EU has provided some breathing room. Still, deflation pressures remain elevated. SNB is likely to signal readiness to act further, whether through rate cuts or FX intervention, should inflation remain subdued.
Later in the day, BoE takes the stage at 11:00 GMT. The Bank is expected to keep its policy rate unchanged at 4.25%, with Governor Andrew Bailey maintaining a message of "gradual and cautious" easing. While recent economic data—including GDP and labor market indicators—have disappointed, BoE faces added complexity from surging oil prices driven by geopolitical tensions. The central bank may be wary of loosening policy too quickly under such volatile global conditions.
Internal divisions remain a key story at the BoE. In May, the vote was notably split: five members favored a 25bps cut, two wanted a larger 50bps move, and two preferred holding. Today’s voting breakdown will give a clearer view of where consensus is forming. While a Reuters poll suggests most economists expect cuts in August and again in Q4, much will depend on how services inflation evolves and whether external shocks abate.
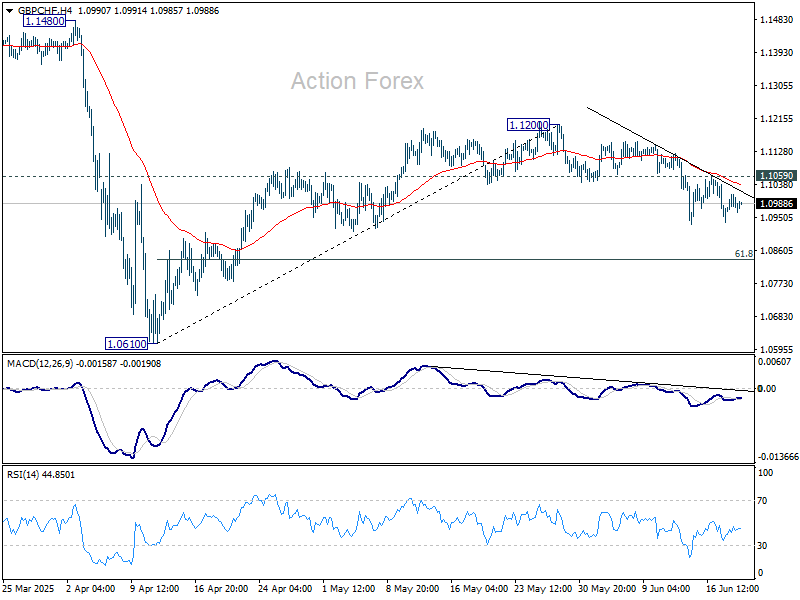
Technically, GBP/CHF's decline from 1.1200 is still in progress. Deeper fall is in favor as long as 1.1059 resistance holds. Next target is 61.8% retracement of 1.0610 to 1.1200 at 1.0835.
Considering GBP/CHF was rejected by 55 W EMA as seen in the weekly chart, firm break of 1.0835 would argue that fall from 1.1675 is ready to resume through 1.0610 low.

Australia jobs fall -2.5k in May, but full-time hiring and hours worked offer Support
May’s Australian employment data surprised to the downside, with a -2.5k decline compared to expectations of a 19.9k gain. Yet beneath the weak headline, the composition was stronger than it appears: full-time jobs surged 38.7k while part-time jobs plunged by -41.1k.
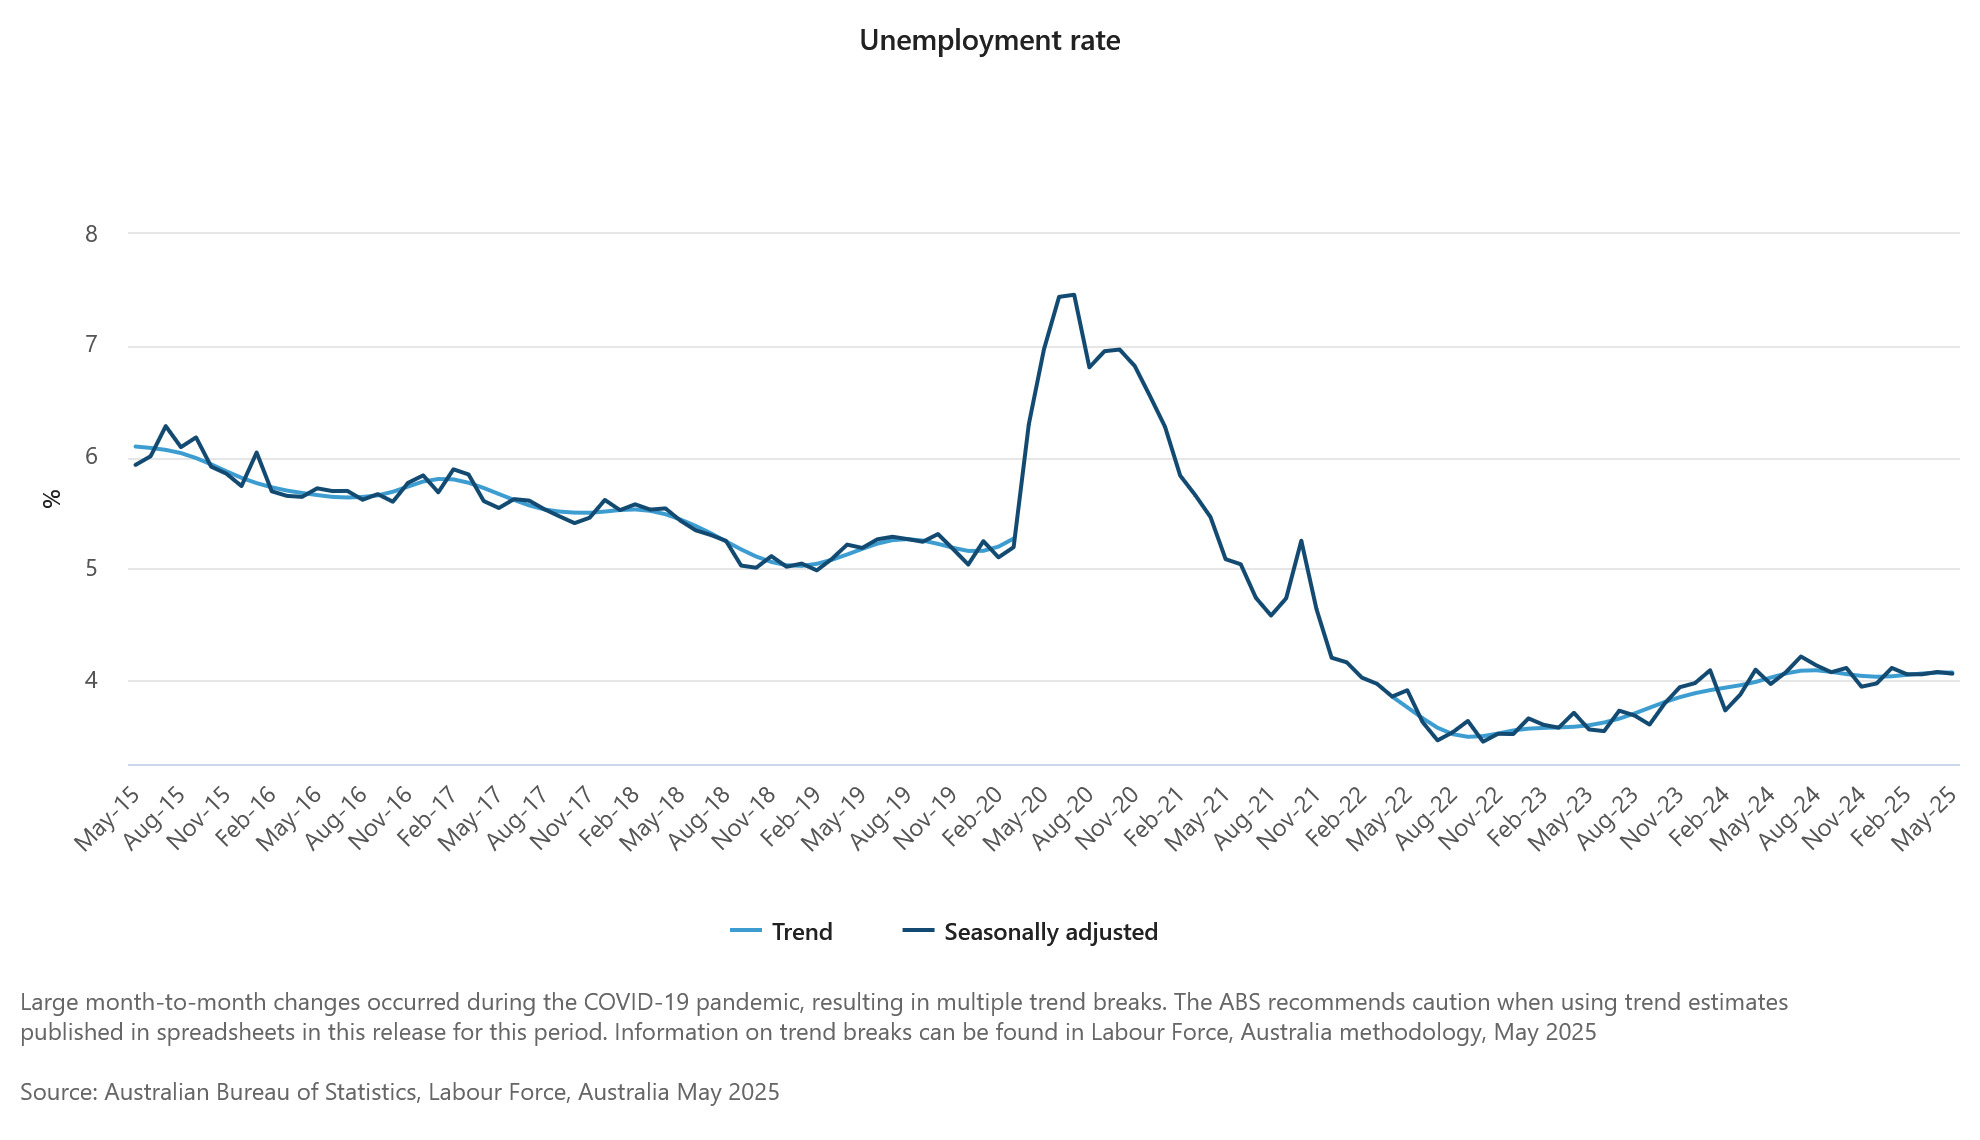
Unemployment rate was unchanged at 4.1%, and the participation rate edged down from 67.1%to 67.0%, both suggesting a labor market that’s cooling slightly, but not cracking.
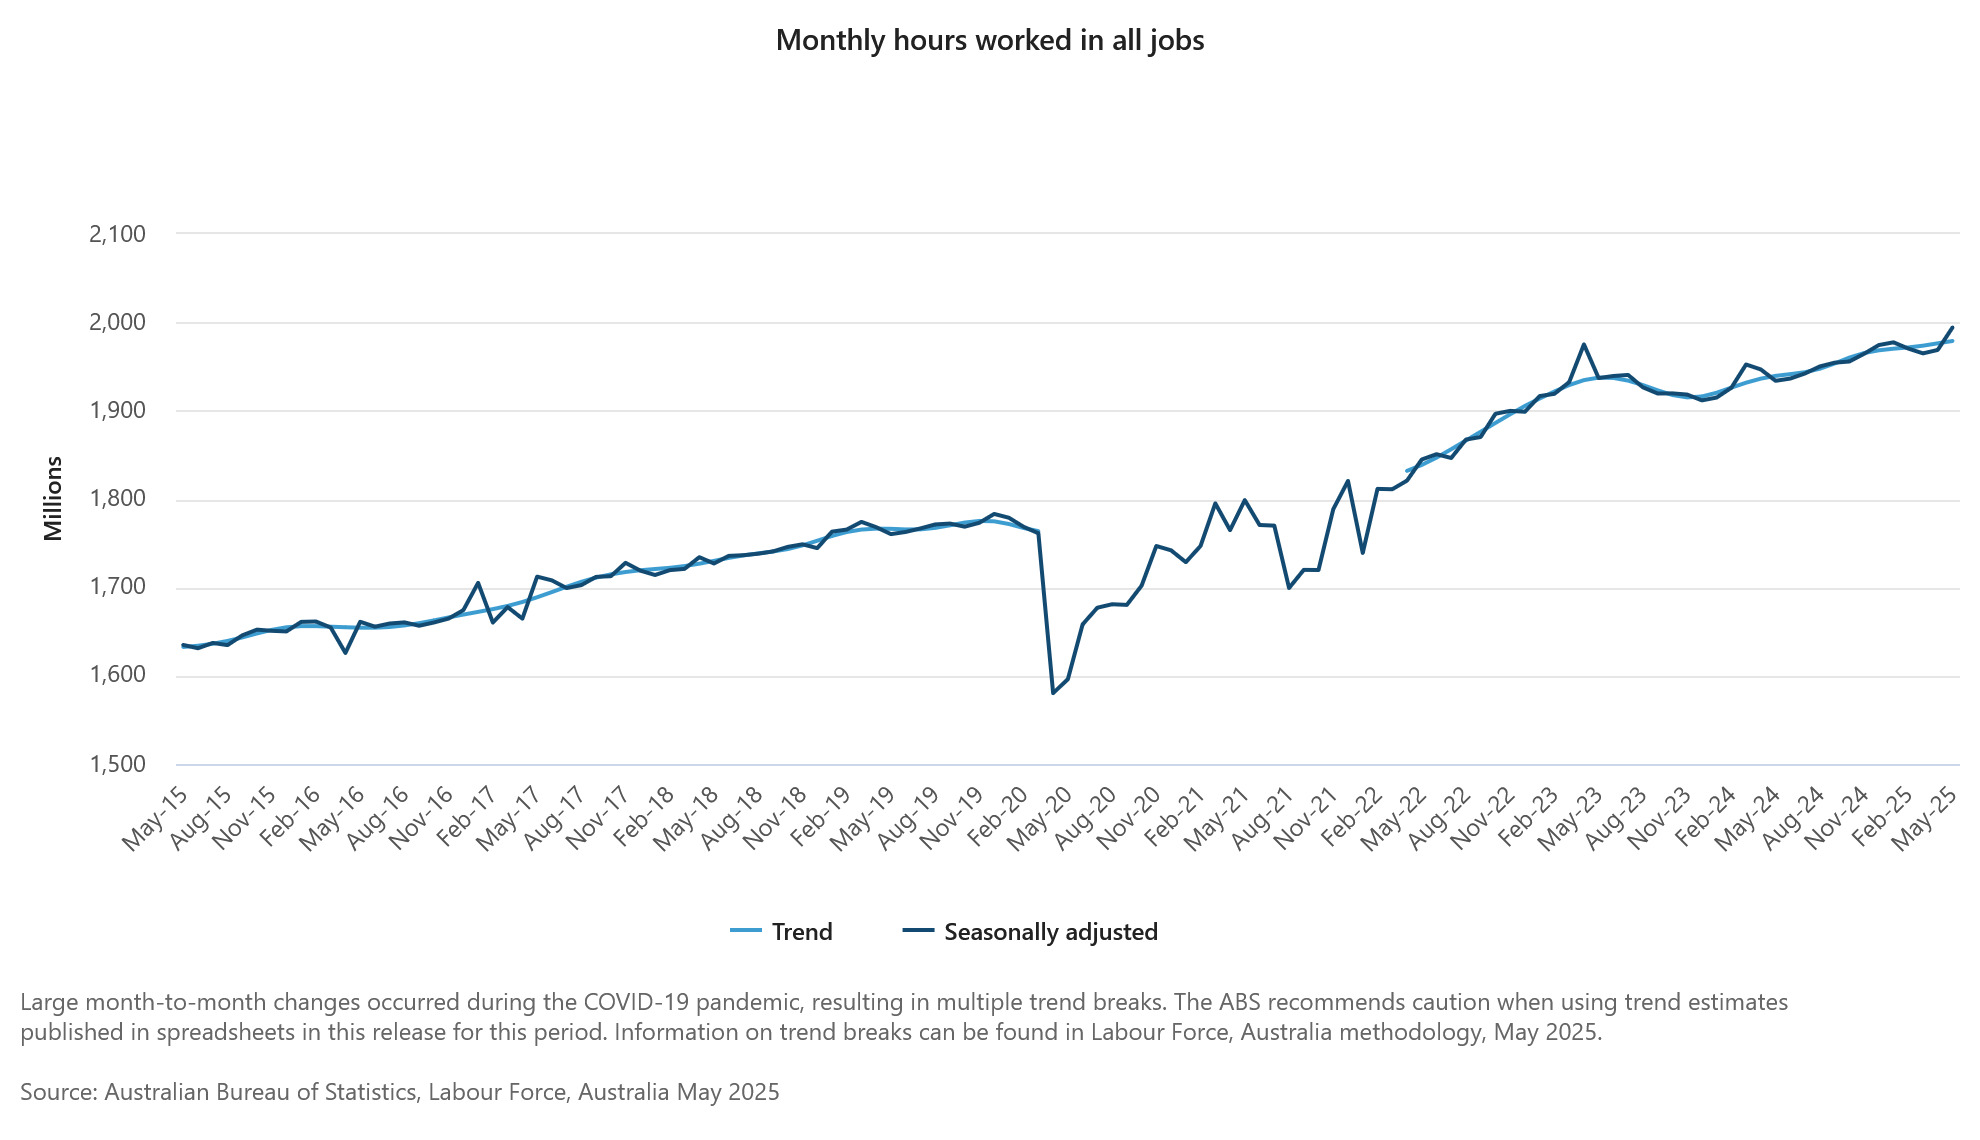
A sharp 1.3% mom rebound in total hours worked provides further reassurance, marking a recovery from recent holiday and weather-driven softness.
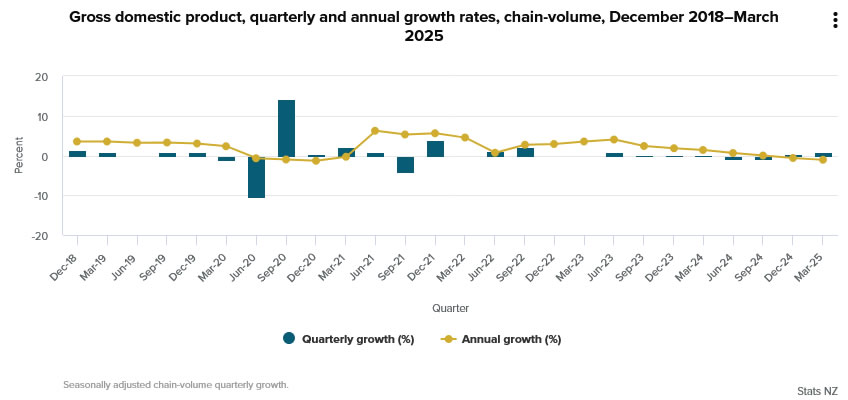
NZ GDP tops forecasts with 0.8% growth in Q1
New Zealand’s GDP grew 0.8% qoq in Q1, slightly ahead of expectations of 0.7% qoq. On a per capita basis, output rose 0.5% qoq.
Gains were broad-based, with all major sectors contributing positively: goods-producing industries led the way at 1.3% qoq, followed by primary industries at 0.8% qoq, and services at 0.4% qoq. Manufacturing and business services were standout performers among the detailed industries, helping to drive the recovery.
Despite the quarterly uptick, GDP contracted by 1.1% over the year to March 2025.
USD/CAD Daily Outlook
Daily Pivots: (S1) 1.3650; (P) 1.3677; (R1) 1.3718; More...
USD/CAD's rebound from 1.3538 extended higher, but stays below 1.3749 support turned resistance. Intraday bias remains neutral, and further decline is expected. On the downside, below 1.3633 minor support will bring retest of 1.3538 first. Firm break there will resume larger fall from 1.4791. However, considering bullish convergence condition in 4H MACD, firm break of 1.3749 will indicate short term bottoming, and bring stronger rebound back to 1.4014 resistance.
In the bigger picture, price actions from 1.4791 medium term top could either be a correction to rise from 1.2005 (2021 low), or trend reversal. In either case, further decline is expected as long as 1.4014 resistance holds. Next target is 61.8% retracement of 1.2005 (2021 low) to 1.4791 at 1.3069.
SNB Poised to Cut, BoE Faces Divided Path
Attention is on two key central bank decisions today, SNB and BoE.
SNB kicks off at 7:30 GMT and is widely expected to deliver a 25bps rate cut, bringing the policy rate back to 0.00%. Speculation about a return to negative rates has intensified after Swiss CPI dipped into deflation at -0.1% yoy in May. While Chair Martin Schlegel has downplayed the importance of a single data point, he has remained open to using negative rates again if disinflation proves persistent.
The Swiss central bank faces a complicated backdrop. A stronger Swiss Franc—driven by haven flows amid the global trade war, Middle East conflict, and lingering Russia-Ukraine war—has intensified deflation risks. Euro's strength on the back of expected fiscal expansion in Germany and the EU has provided some breathing room. Still, deflation pressures remain elevated. SNB is likely to signal readiness to act further, whether through rate cuts or FX intervention, should inflation remain subdued.
Later in the day, BoE takes the stage at 11:00 GMT. The Bank is expected to keep its policy rate unchanged at 4.25%, with Governor Andrew Bailey maintaining a message of "gradual and cautious" easing. While recent economic data—including GDP and labor market indicators—have disappointed, BoE faces added complexity from surging oil prices driven by geopolitical tensions. The central bank may be wary of loosening policy too quickly under such volatile global conditions.
Internal divisions remain a key story at the BoE. In May, the vote was notably split: five members favored a 25bps cut, two wanted a larger 50bps move, and two preferred holding. Today’s voting breakdown will give a clearer view of where consensus is forming. While a Reuters poll suggests most economists expect cuts in August and again in Q4, much will depend on how services inflation evolves and whether external shocks abate.
Technically, GBP/CHF's decline from 1.1200 is still in progress. Deeper fall is in favor as long as 1.1059 resistance holds. Next target is 61.8% retracement of 1.0610 to 1.1200 at 1.0835.
Considering GBP/CHF was rejected by 55 W EMA as seen in the weekly chart, firm break of 1.0835 would argue that fall from 1.1675 is ready to resume through 1.0610 low.
Australia jobs fall -2.5k in May, but full-time hiring and hours worked offer Support
May’s Australian employment data surprised to the downside, with a -2.5k decline compared to expectations of a 19.9k gain. Yet beneath the weak headline, the composition was stronger than it appears: full-time jobs surged 38.7k while part-time jobs plunged by -41.1k.
Unemployment rate was unchanged at 4.1%, and the participation rate edged down from 67.1%to 67.0%, both suggesting a labor market that’s cooling slightly, but not cracking.
A sharp 1.3% mom rebound in total hours worked provides further reassurance, marking a recovery from recent holiday and weather-driven softness.
NZ GDP tops forecasts with 0.8% growth in Q1
New Zealand’s GDP grew 0.8% qoq in Q1, slightly ahead of expectations of 0.7% qoq. On a per capita basis, output rose 0.5% qoq.
Gains were broad-based, with all major sectors contributing positively: goods-producing industries led the way at 1.3% qoq, followed by primary industries at 0.8% qoq, and services at 0.4% qoq. Manufacturing and business services were standout performers among the detailed industries, helping to drive the recovery.
Despite the quarterly uptick, GDP contracted by 1.1% over the year to March 2025.