Sample Category Title
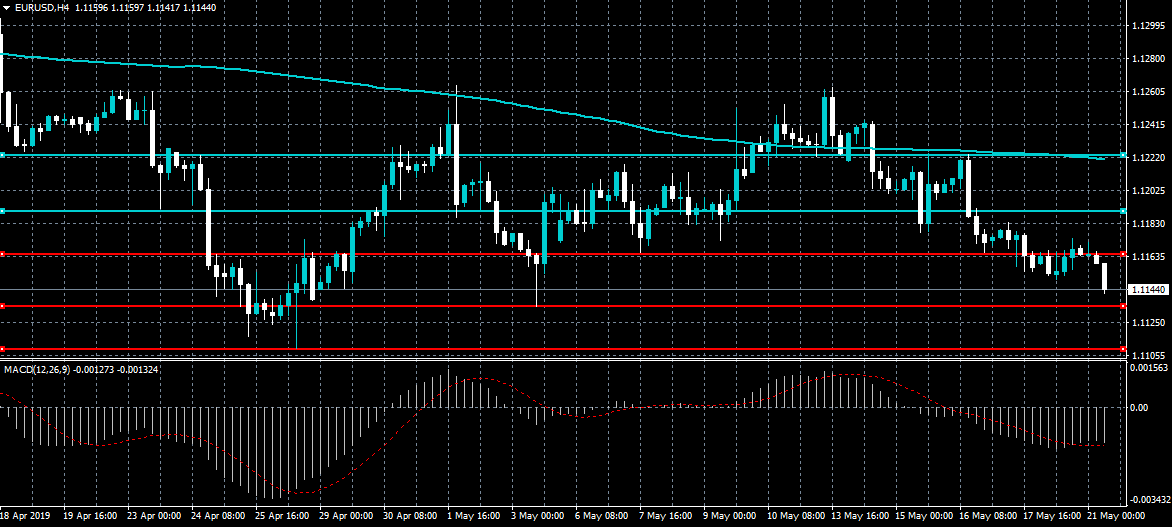
EURUSD 1.1135 Upcoming Support
The euro has continued to weaken against the US dollar during the European trading session, with the pair falling to a fresh weekly trading low. Sellers are now approaching the 1.1135 support level, although major breakout support is located at the 1.1110 level. The four-hour time frame is also showing that the EURUSD pair may be creating a large head and shoulders pattern.
The EURUSD pair is heavily bearish while below the 1.1165 level, key technical support is found at the 1.1110 and 1.1060 levels.
If the EURUSD pair moves above the 1.1165 level, key technical resistance is found at the 1.1190 and 1.1234 levels.
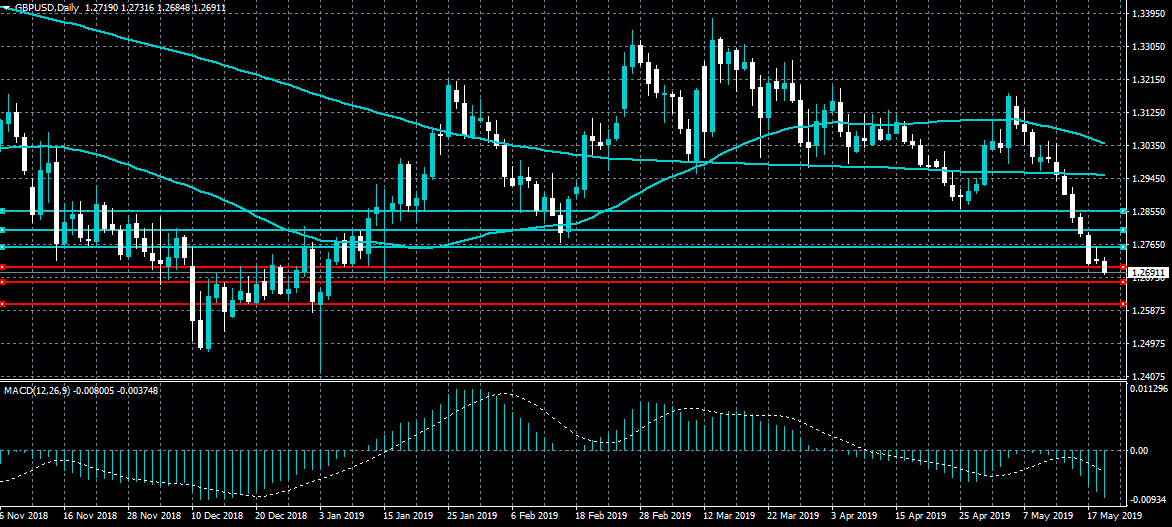
GBPUSD Now Under 1.2700
The British pound has fallen below the 1.2700 level against the US dollar as the pair looks set to post eight consecutive days of trading losses. The GBPUSD pair is increasingly likely to target the 1.2660 level now that the 1.2700 support level has been breached. Traders now look to the release of the UK inflation data and the start of the European elections this coming Thursday.
The GBPUSD pair is heavily bearish while trading below the 1.2700 level, key support is located at the 1.2660 and 1.2600 levels.
If the GBPUSD pair trades above the 1.2700 level, key intraday resistance is found at the 1.2730 and 1.2756 levels.
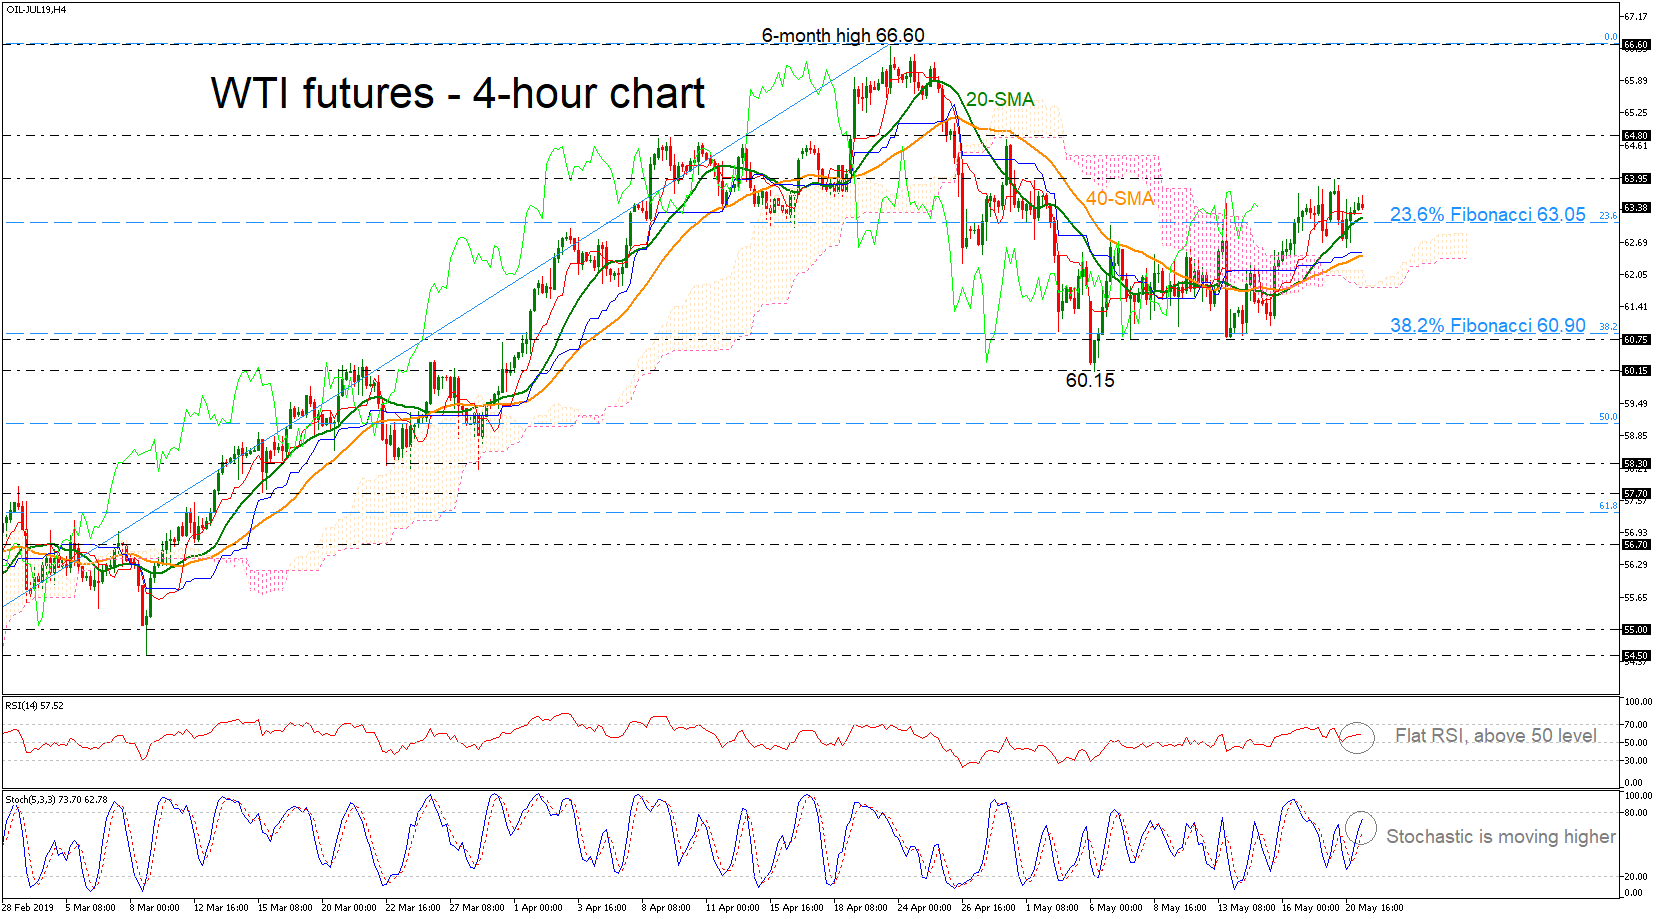
WTI Crude Futures Stand Above 23.6% Fibonacci, Slightly Bullish
West Texas Intermediate (WTI) crude oil futures returned back above the 23.6% Fibonacci retracement level of the upleg from 51.60 to 66.60, around 63.0, holding above the red Tenkan-sen line and the 20-simple moving average (SMA) in the 4-hour chart. The stochastic oscillator is approaching the overbought levels, giving signals for more upside pressure, however, the RSI indicator is flattening in the positive area.
Should the price edge higher, positive momentum could probably last until the 63.95 strong resistance obstacle. Beating this top, the door could open for the 64.80 barrier before challenging the six-month high again.
On the downside, the 23.6% Fibonacci mark of 60.90 and the 20-SMA could act as significant support levels. A failure to hold above these lines could strengthen the sell-off towards the 40-SMA currently at 62.40 and the lower surface of the Ichimoku cloud near 61.80.
In brief, WTI oil futures are looking slightly positive in the short-term thanks to the climb above the 23.6% Fibonacci.
The Analytical Overview Of The Main Currency Pairs
The EUR/USD currency pair
Technical indicators of the currency pair:
Prev Open: 1.11602
Open: 1.11650
% chg. over the last day: +0.05
Day's range: 1.11443 – 1.11722
52 wk range: 1.1111 – 1.2009
EUR/USD remains in a bullish mood. Right now EUR is consolidating around 1.11450-1.11650. The market participants keep watching the Washington/Beijing trading conflict. Threats of further actions escalated after the US sanctioned Chinese tech giant Huawei. Further descend of the quotes remain possible. You should open positions from the key levels.
At 17:00 (GMT+3:00) the US will publish the secondary real estate sales report.
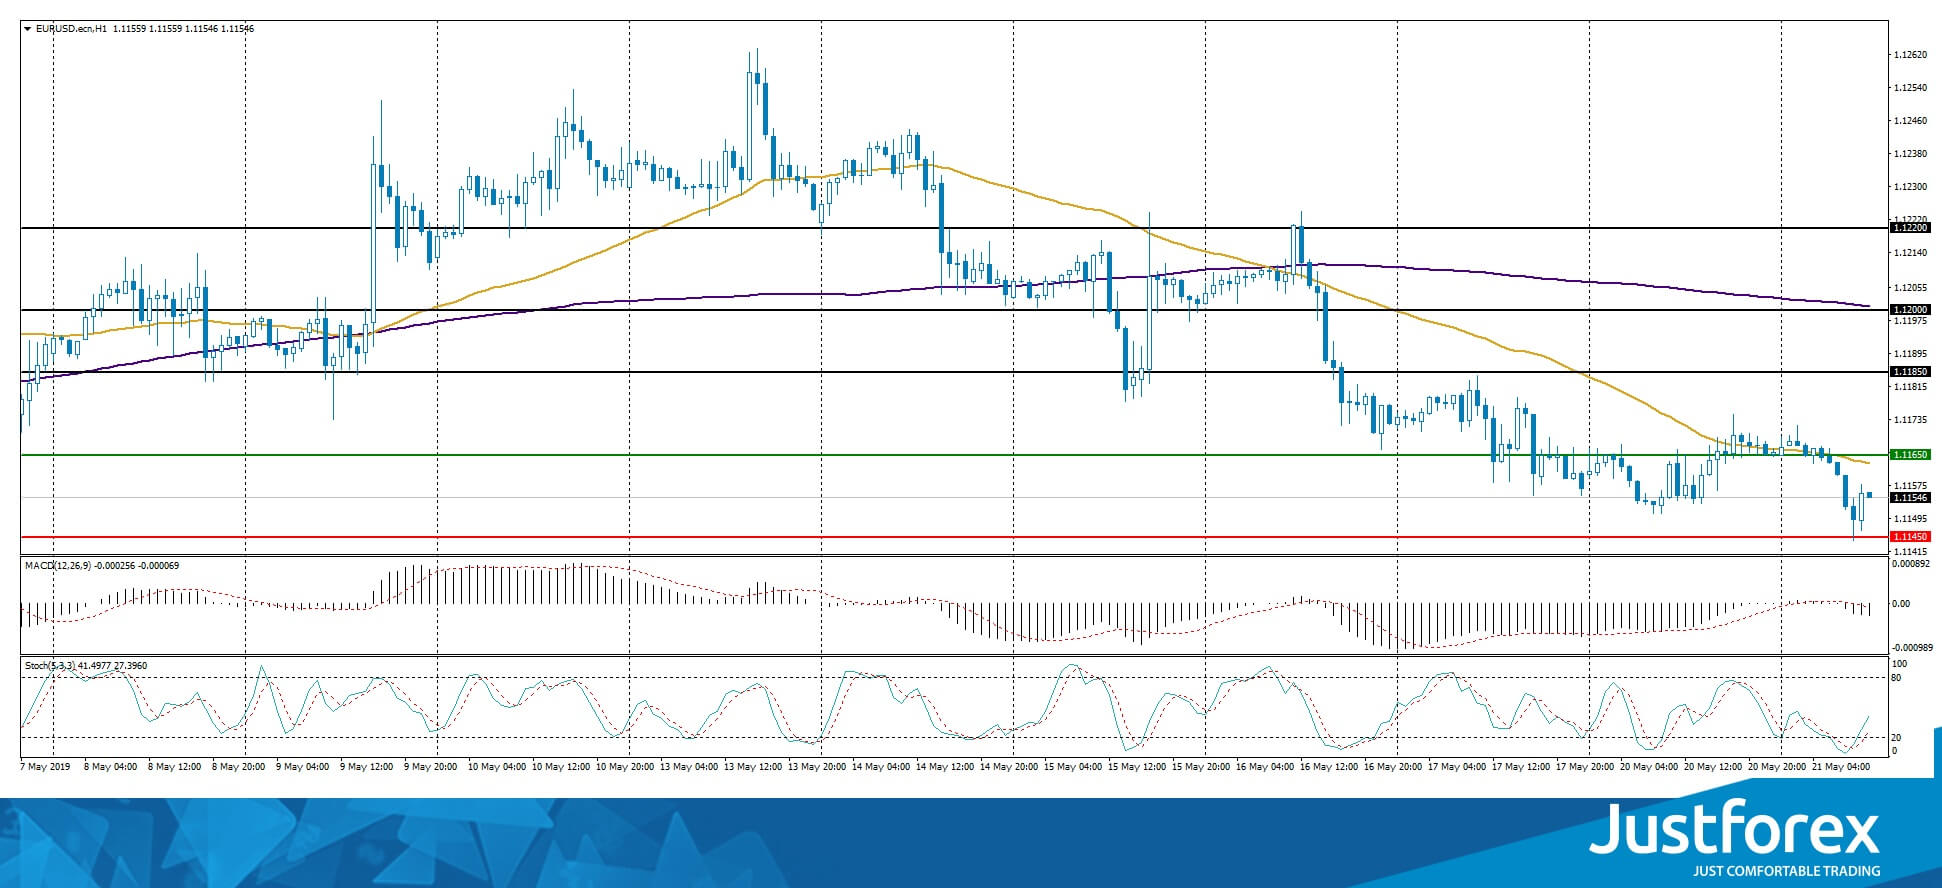
The price fixed below 50 MA and 200 MA which points towards the power of the sellers.
The MACD histogram is in the negative zone and below the signal line which gives a strong signal towards selling EUR/USD.
The Stochastic Oscillator is in the neutral zone, the %K line is above the %D line which points towards a bullish mood.
Trading recommendations
Support levels: 1.11450, 1.11200, 1.11000
Resistance levels: 1.11650, 1.11850, 1.12000
If the price fixes below 1.11450, expect further descend toward 1.11200-1.11000.
Alternatively, the quotes can recover toward 1.11800-1.12000.
The GBP/USD currency pair
Technical indicators of the currency pair:
Prev Open: 1.27303
Open: 1.27210
% chg. over the last day: -0.02
Day's range: 1.26853 – 1.27322
52 wk range: 1.2438 – 1.3631
GBP/USD keeps showing a negative trend. The ambiguousness regarding Brexit pushed the GBP down. Theresa May earlier stated that she wants to present a brave new offer to the lawmakers in order to reach the Brexit agreement. The local support and resistance levels are 1.26800 and 1.27150. The trading instrument can descend further. You should open positions from the key levels.
At 11:30 (GMT+3:00) the Bank of England will publish the inflation report.
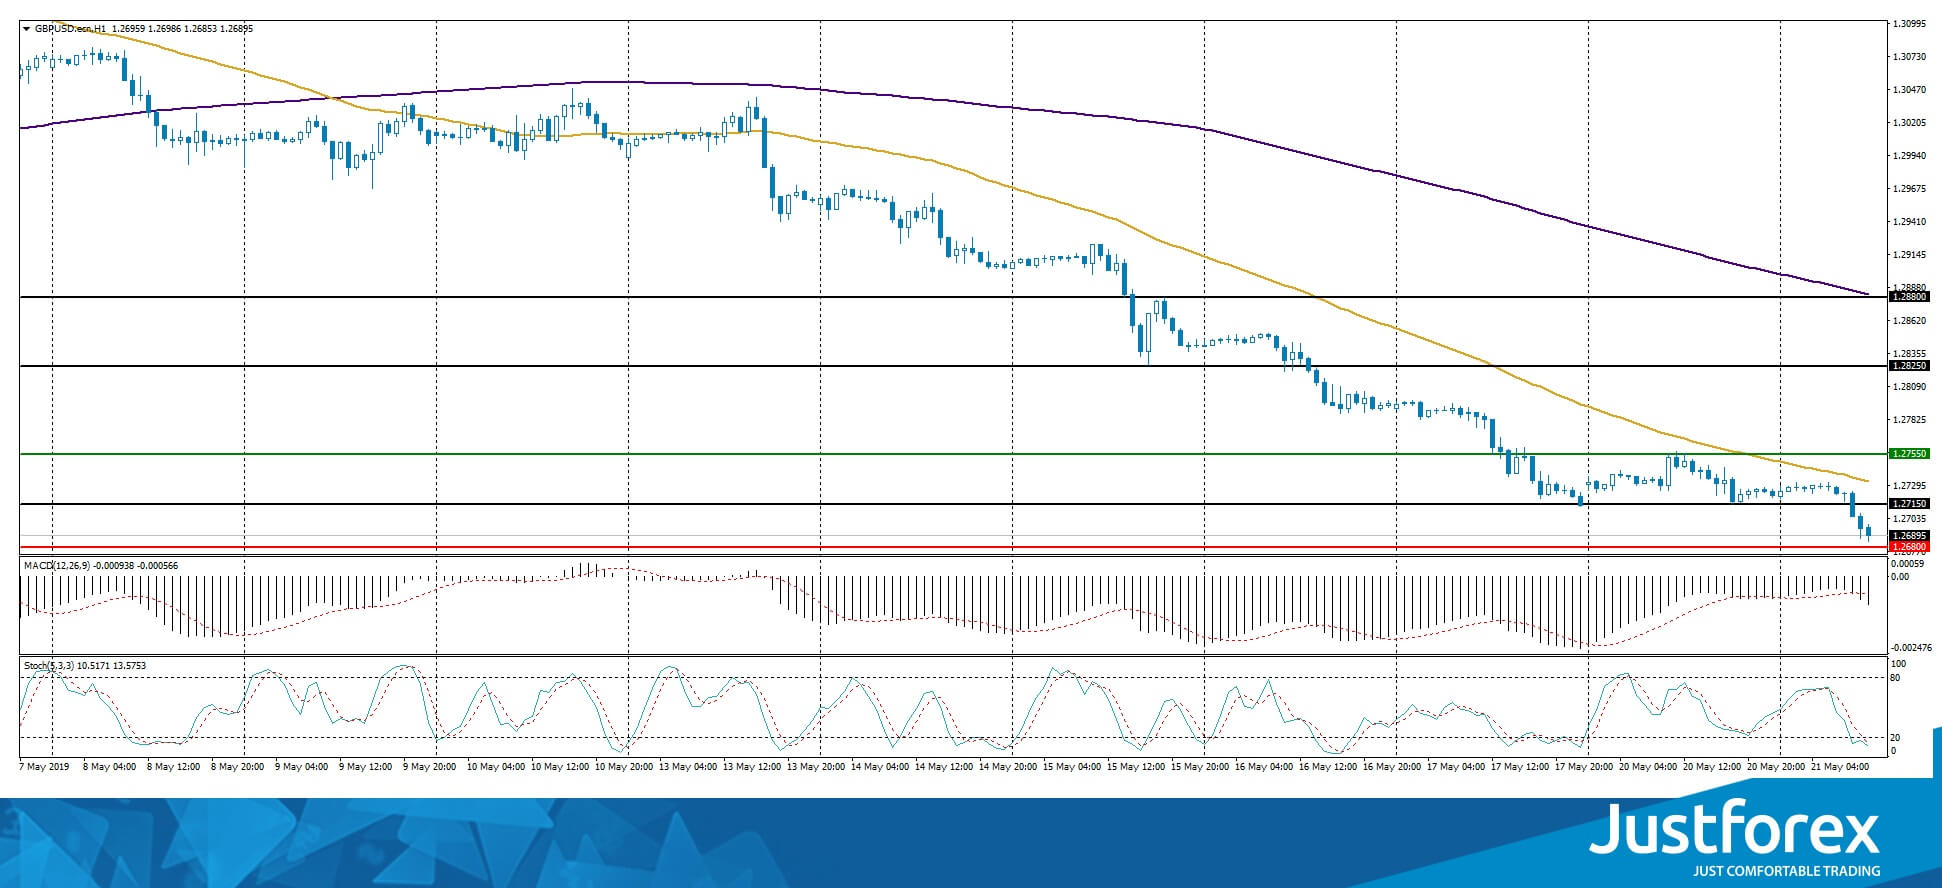
The price fixed below 50 MA and 200 MA which points to the power of the sellers.
The MACD histogram is in the negative zone and below the signal line which indicates a signal to sell GBP/USD.
The Stochastic Oscillator is in the oversold zone, the %K line is below the %D line which gives a weak signal to sell GBP/USD.
Trading recommendations
Support levels: 1.26800, 1.26500
Resistance levels: 1.27150, 1.27550, 1.28250
If the price fixes below the 1.26800, expect further descend toward 1.26500-1.26300.
Alternatively, the quotes can recover toward the round 1.28000.
The USD/CAD currency pair
Technical indicators of the currency pair:
Prev Open: 1.34399
Open: 1.34246
% chg. over the last day: -0.14
Day's range: 1.34194 – 1.34355
52 wk range: 1.2727 – 1.3664
USD/CAD keeps showing an ambiguous technical picture. The trading instrument is consolidating. The local support and resistance levels are 1.34200 and 1.34450. The financial market participants are waiting for additional drivers. Keep an eye on the oil quotes and open positions from the key levels.
The Economic News Feed for 21.05.2019 is calm.
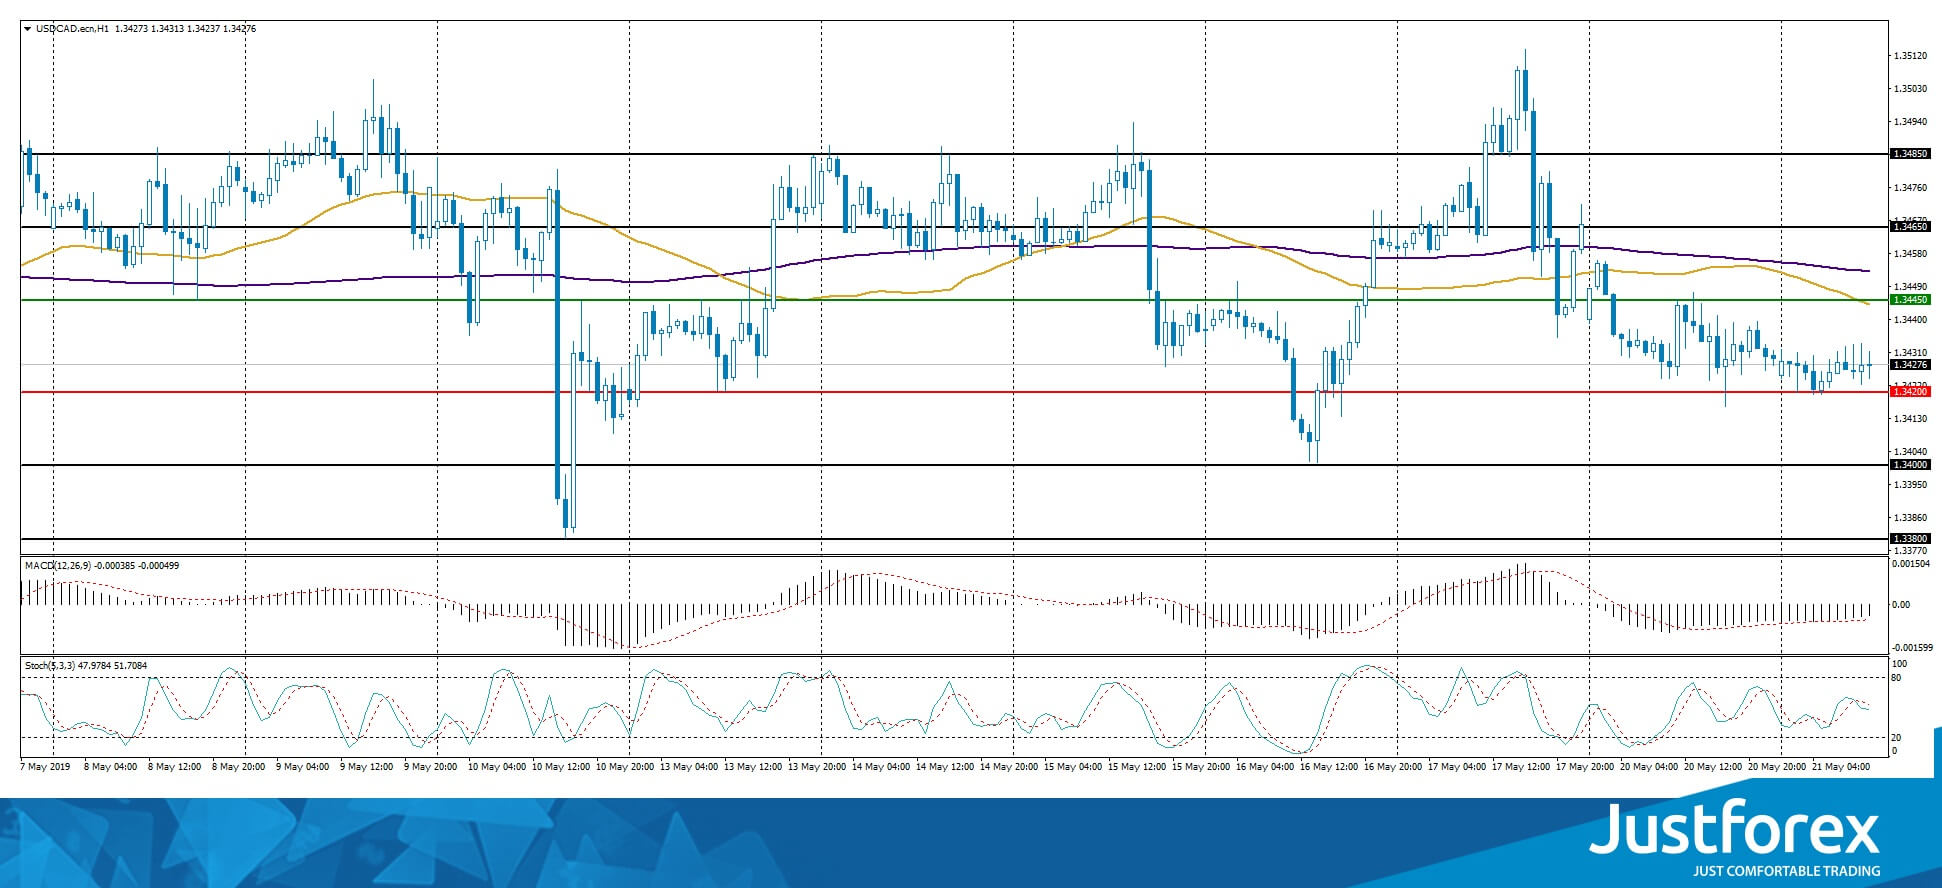
The price fixed below 200 MA which points towards the power of the sellers.
The MACD histogram is in the negative zone but above the signal line which gives a weak signal to sell USD/CAD.
The Stochastic Oscillator is in the neutral zone, the %K line started to cross the %D line. There are no signals at the moment.
Trading recommendations
Support levels: 1.34200, 1.34000, 1.33800
Resistance levels: 1.34450, 1.34650, 1.34850
If the price fixes below 1.34200, expect further descend towards 1.34000-1.33800.
Alternatively, the quotes can grow towards 1.34700-1.34850.
The USD/JPY currency pair
Technical indicators of the currency pair:
Prev Open: 110.103
Open: 110.068
% chg. over the last day: -0.07
Day's range: 110.010 – 110.263
52 wk range: 104.97 – 114.56
USD/JPY stabilized. The technical picture is ambiguous. The local support and resistance are 110.000 and 110.300. The demand for the safe assets remains due to the US/China trading conflict. The trading instrument can descend further.
The Economic News Feed for 21.05.2019 is calm.
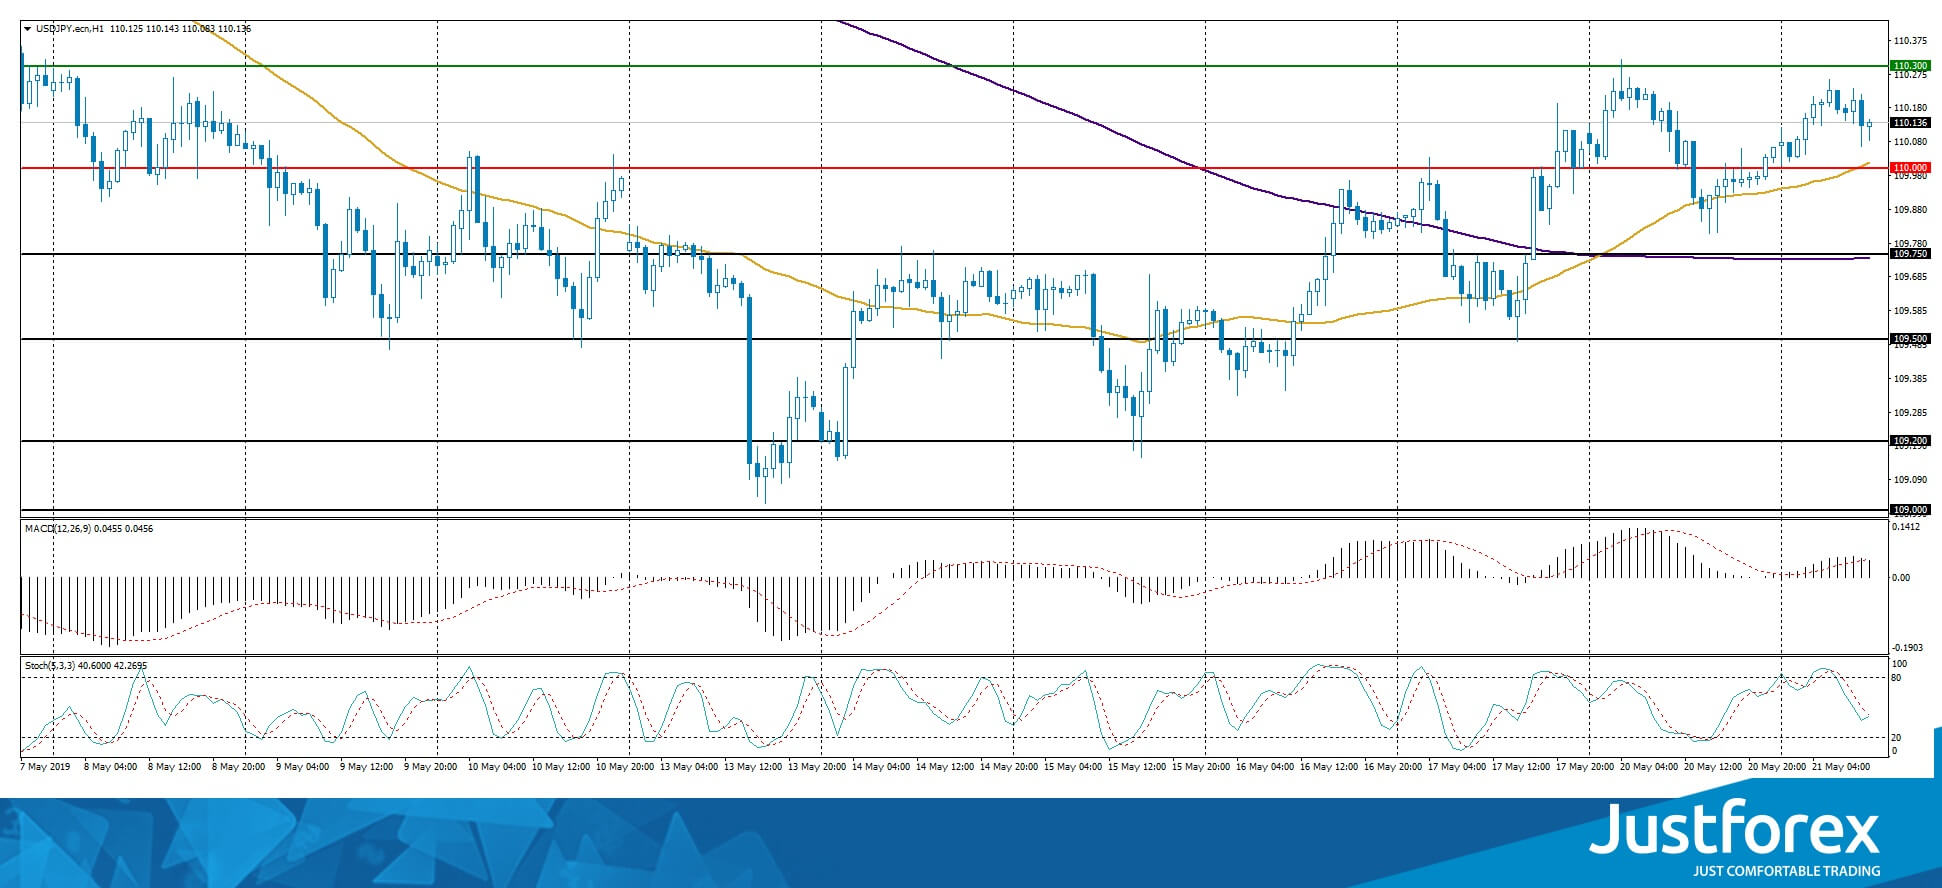
The price fixed above 50 MA and 200 MA which points towads the power of the buyers.
The MACD histogram is in the positive zone but below the signal line which gives a weak signal towards buying USD/JPY.
The Stochastic Oscillator is in the neutral zone, the %K line is crossing the %D line. There are no signals at the moment.
Trading recommendations
Support levels: 110.000, 109.750, 109.500
Resistance levels: 110.300, 110.700
If the price fixes below the round 110.000, expect further descend towards 109.750-109.500.
Alternatively, the quotes can grow towards 110.600-110.800.
The Dollar Index Is Holding Key Highs
Demand for the greenback is still high enough. At the moment, the dollar index is consolidating near annual highs. The trade conflict between the US and China is in the focus of attention. Concerns about further escalation of the trade war have increased significantly after Washington imposed sanctions on the Chinese telecom giant Huawei. The recovery of the 10-year US government bonds yield supports the US currency.
Uncertainty concerning Brexit continues to put pressure on the British pound. British Prime Minister Theresa May said that she would present a "new bold offer" to lawmakers in a final attempt to conclude a Brexit deal. The Australian dollar fell after the publication of the RBA monetary policy meeting minutes. The head of the Central Bank said that the regulator would consider the issue of lowering interest rates at the meeting in June. Today, investors will assess important economic releases from the UK and the US.
Oil quotes show positive dynamics. At the moment, futures for the WTI crude oil are testing the mark of $63.45 per barrel.
Market Indicators
- Yesterday, the bearish sentiment prevailed in the US stock market: #SPY (-0.66%), #DIA (-0.30%), #QQQ (-1.69%).
- The 10-year US government bonds yield is recovering. Currently, the indicator is at the level of 2.41-2.42%.
The news feed on 2019.05.21:
- Bank of England inflation report hearings at 11:30 (GMT+3:00);
- Existing home sales in the US at 17:00 (GMT+3:00).
Euro Edges Lower, Markets Brace For Soft Eurozone Consumer Confidence
EUR/USD has posted slight losses on Tuesday. Currently, the pair is trading at 1.1148, down 0.16% on the day. On the release front, there are no major events for a second successive day. The eurozone releases consumer confidence and the U.S. posts existing home sales.
Voters in all 28 members of the European Union will head to the polls for a 4-day election, beginning on Thursday, to elect members to the European Parliament. Election turnout has been on the decline, with only 43% of eligible voters casting a vote in 2014. Key issues included the economic slowdown, the migrant crisis and the rise in Euroskpeticism. Euro-skeptics increased their representation in parliament from 12% to 25% in the last election, and with the dramatic increase in strength of populist parties, this trend could well continue. A strong showing by parties with an anti-EU agenda could weaken the euro. As well, the outcome of the vote could have an impact on the choice of the new head of the ECB, as Mario Draghi steps down in October, after an eight-year term.
The eurozone remains mired in a slowdown, and the German locomotive has also lost a step. Still, there was positive news in Germany and the eurozone last week, as GDP and inflation headed upwards. German Preliminary GDP improved to 0.4% in the first quarter, after a flat zero reading in Q4 of 2018. In the eurozone, Flash GDP also climbed to 0.4% in the first quarter, up from 0.2% in Q4. On the inflation front, inflation indicators impressed, with sharp gains in April. Final CPI climbed 1.7%, matching the forecast. This was up sharply from 0.8% in March. Final Core CPI rose 1.3%, edging above the estimate of 1.2%. This marked the strongest gain since March 2013. The ECB recently stated that it had no plans to raise interest rates prior to the spring of 2020, but if GDP and inflation numbers continue to improve, the ECB could raise rates earlier than this timeline.
WTI Oil Outlook: Near-Term Action Is In Neutral Mode And Looks For Fresh Direction Signals
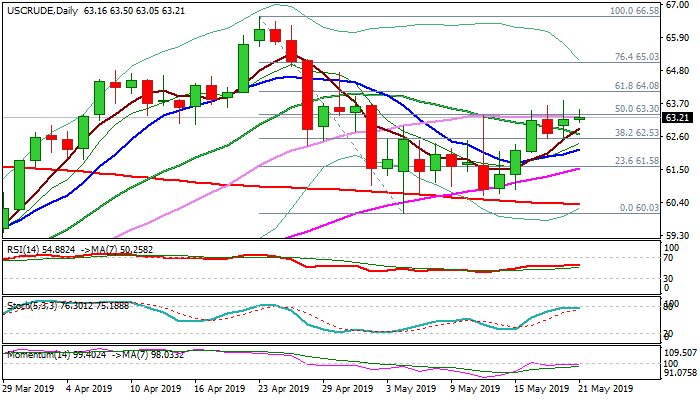
WTI oil holds within tight range on Tuesday after the third consecutive failure to make sustained break above cracked $63.30 pivot (50% retracement of $66.58/$60.03/30SMA). Key factors that influence oil prices, US/Iran tension that threaten of escalation and fears of global slowdown on escalation of US/China trade war, keep in balance for now, holding oil prices in directionless near-term mode. Weakening daily studies (weakening momentum after repeated failure to break into positive zone and stochastic turning south after touching the border of overbought zone) keep the downside vulnerable. Bearish scenario needs initial signal on break below the lows of past two days at $62.53 (also broken Fibo 38.2%), with extension and close below 10SMA/daily cloud top ($62.16/02) needed to generate reversal signal. On the other side, eventual break and close above $63.30 pivot would signal extension of recovery leg from $60.03 (6 May low) towards next pivotal barrier at $64.08 (Fibo 61.8% of $66.58/$60.03 bear-leg). Traders will look for fresh direction signals from US API crude stocks data, due later today.
Res: 63.30, 63.78, 64.08, 64.73
Sup: 63.05, 62.85, 62.53, 62.16
Trade War, AUD Back Under Pressure
Trade War Escalation
Escalated tensions between the US and China remain the dominant driver in financial markets. Risk aversion overnight was reduced as the US Commerce Department stated it would provide temporary licenses for U.S exports to Huawei. Thus reducing the negative impact of last week announced blacklist order against Huawei. This reprieve comes just hours after Google indicated it would end access to popular sites on the Android operating system. This recent move by the US is a clear signal that tensions have moved beyond a “trade war” and a highly negative development. Markets are still pricing in a positive end-result, judged by relative steadiness in equity markets. Asia shares were broadly sportive today with Shanghai up 1.23%. Yet recent aggressive actions by both the US and China to widen tariffs on each other exports have pushed out the timeline for a trade deal. Which in our view, has increased the likelihood of greater stress and possibility of failure.
The market has been blindsided by the sudden escalation and expansion between the US and China trade dispute. Equity volatility has jumped while the S&P 500 dropped 4% in early May. News flow from Washington and Beijing was a deal was imminent. China reversal on details previously agreed upon was a deep hit. Ratcheting up the tariffs on both side, in theory, adds up to $300 billion.
AUD pursued by its old demons
The relief in AUD following the surprising reelection of PM Scottt Morrison conservative coalition for another four years was short-lived, as convictions of investors that the Reserve Bank of Australia will be cutting its Cash rate by 0.25 percentage points during its 4 June 2019 meeting is growing. The RBA policy minutes from May meeting confirmed worries over growth, the labor market and a slowdown in household consumption. Further pressure can be expected on the Aussie.
Indeed, the news is not good for both the RBA and the newly elected government as Australian treasurer Josh Frydenberg confirmed that time is running out to implement the Liberal Nation coalition election promise of a tax legislation, which is supposed to provide a tax relief for 10 million of low- and middle-income class households for 2019/20 financial years. Whether this would be implemented in 2019 and 2020 doesn’t change much for the RBA anyway, since it is highly likely that it will reduce its record low key rate to 1.25%. Furthermore, in the event of a non-applicable tax rebate for this year, we should see rising criticism against the majority government.
AUD/USD is currently trading at 0.6873, a 16-years low (-2.50% year-to-date) and approaching 0.6865 short-term.
USDJPY Outlook: Bulls Show Strong Indecision At Key Fibo Barrier
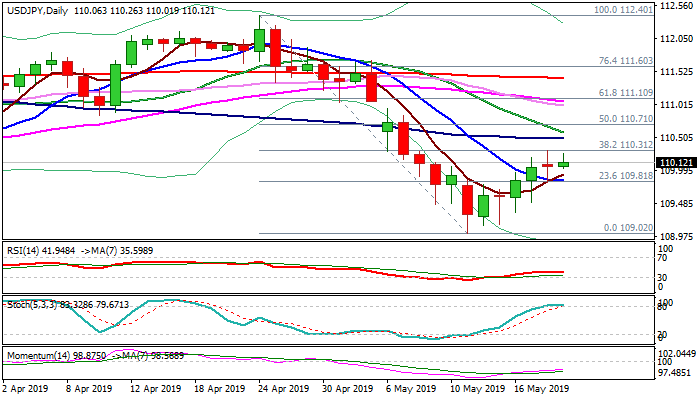
Bulls attempt to regain traction after Monday’s recovery stalled at key Fibo barrier at 110.31 (38.2% of 112.40/109.02) and daily action ended in long-legged Doji, signaling strong indecision.
The dollar moved higher in early Tuesday’s trading on comments from Fed Chief Powell, who argued against cutting interest rates and relief on Huawei case, but still lacking strength for final push through 110.31 pivot.
Overbought daily stochastic adds to concerns about repeated failure at 110.31 that would add to the downside risk, but initial signal of reversal would require fall and close below 10 SMA (109.83).
Conversely, close above 110.31 would generate initial signal of bullish continuation.
Res: 110.31, 110.49, 110.58, 110.71
Sup: 110.01, 109.93, 109.83, 109.49
EUR/JPY Stranded Between SMAs
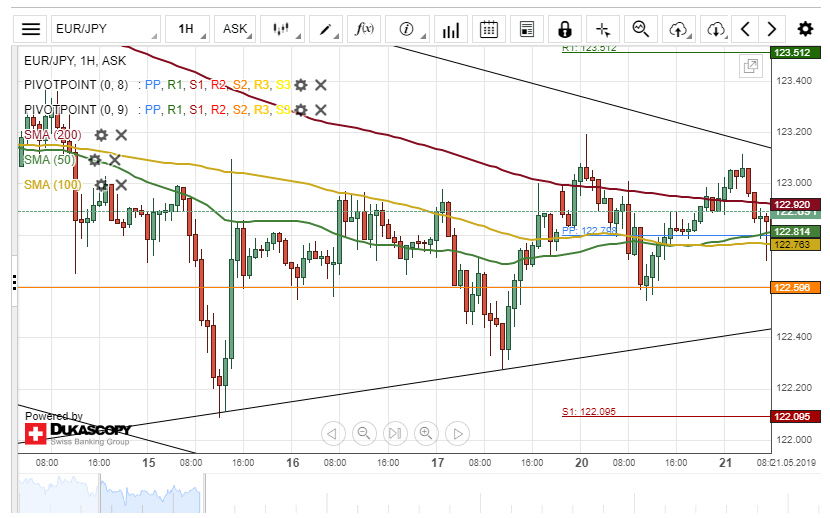
The single European currency depreciated 62 base points against the Japanese Yen on Monday. However, the currency pair regained some of its lost points at the end of yesterday's trading session.
The exchange rate is currently stranded between SMAs. The 200-hour simple moving average is providing resistance for the pair, while the 50– and 100-hour SMAs are providing support.
By and large, the currency exchange rate might continue its upside movement today. A breakout through the upper boundary of the descending channel pattern could occur within this session.