

Sample Category Title
GBP/USD Outlook: Bears Show Signs Of Fatigue Above 200SMA But No Signals Of Reversal So Far
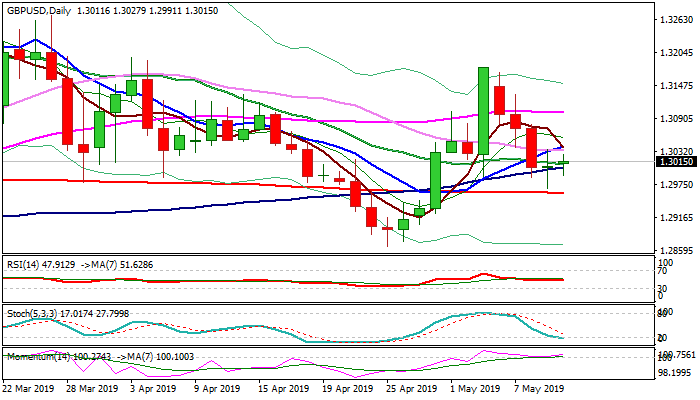
Cable holds within narrow range in European trading on Friday and attempts to stabilize above psychological 1.30 support.
Thursday's long-legged Doji suggests that strong three-day fall might be running out of steam and profit-taking may prompt recovery.
With existing hopes of deal in US/China talks, risk aversion showed initial signs of stall that could help pound to recover some of this week's losses.
On the other side, lack of progress in Tory/Labor Brexit talks weighs and maintains negative sentiment.
Daily techs are mixed, but hopes for recovery remain in play while the price holds above key 200SMA.
The pound showed mild reaction on mixed UK data, as GDP came in line with expectations, Industrial / Manufacturing output showed better than expected numbers, while construction output fell below consensus.
Brexit remains key driver and current pessimism may keep sterling at the back foot.
Focus turns towards US inflation data due later today, for fresh signals.
Near-term action holds above cracked Fibo support at 1.2985 (61.8% of 1.2865/1.3179), which managed to limit several attempts lower and close below would generate bearish signal, confirmation of which would need sustained break below 200SMA(1.2959).
At the upside, converged 30,10, 5 SMA's (1.3034/38) mark pivotal barrier, close above which would generate initial signal of formation of reversal pattern on daily chart.
Res: 1.3027, 1.3038, 1.3059, 1.3077
Sup: 1.2985, 1.2959, 1.2939, 1.2900
Investors Are Following The US-China Talks
The US dollar fell slightly against a basket of major currencies. The dollar index (#DX) closed in the negative zone (-0.07%). Investors are closely monitoring the development of the trade relationship between the US and China. According to the US President, Donald Trump, countries will probably close a deal this week. "It's possible to do it, they're all here. The vice premier one of the most respected men one of the highest officials in China is coming," Trump said in Washington on Thursday. Also, the US President said that he might soon hold talks with Chinese President Xi Jinping by telephone.
Yesterday, mixed economic data were also published in the United States. Thus, the producer price index rose by 0.2% in April, which met the expectations of experts. However, initial jobless claims rose to 228K, while investors expected an increase by 215K. Today, we expect important economic data from the US, the UK, and Canada.
The "black gold" prices are consolidating. At the moment, futures for the WTI crude oil are testing the mark of $62.15 per barrel.
Market Indicators
- Yesterday, sales were observed in the US stock market: #SPY (-0.30%), #DIA (-0.47%), #QQQ (-0.54%).
- The 10-year US government bonds yield is at 2.44-2.45%.
The news feed on 2019.05.10:
- UK GDP data at 11:30 (GMT+3:00);
- Manufacturing production in the UK at 11:30 (GMT+3:00);
- Core consumer price index in the US at 15:30 (GMT+3:00);
- Statistics on the labor market in Canada at 15:30 (GMT+3:00).
10 Year US Notes Points Lower, And GBPJPY Can Stop Its Weakness!
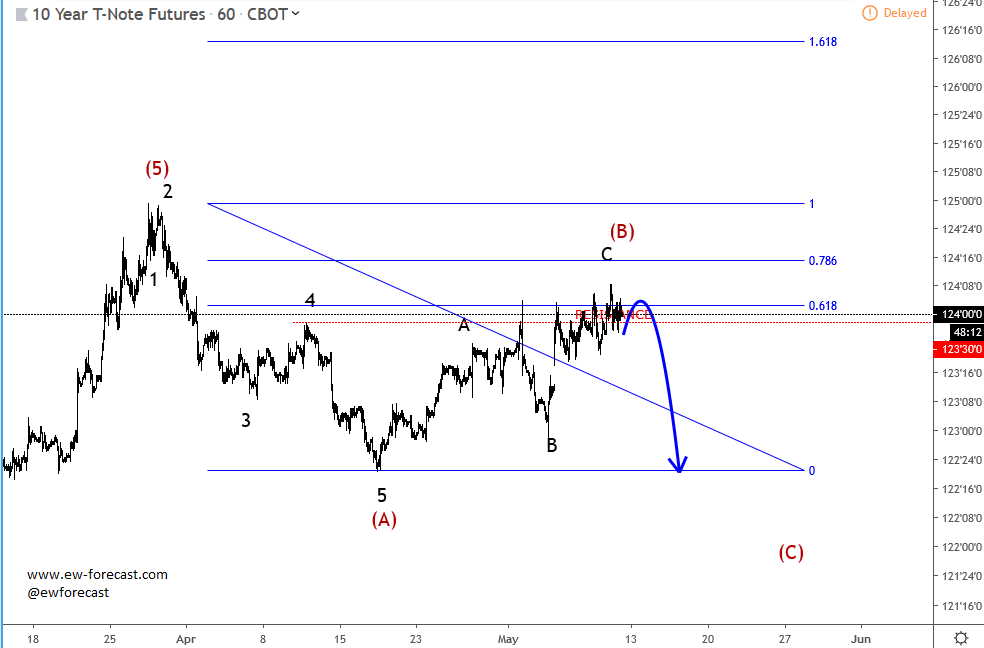
In risk-off mode commodity currencies and XXX/JPY pairs will benefit, especially if 10 year US notes are headed down based on 1h wave count which is pointing down for wave C). In such case even very weak GBPJPY would stabilize, but after wave five which is around the corner.
10 Year US Notes, 1h
GBPJPY, 1h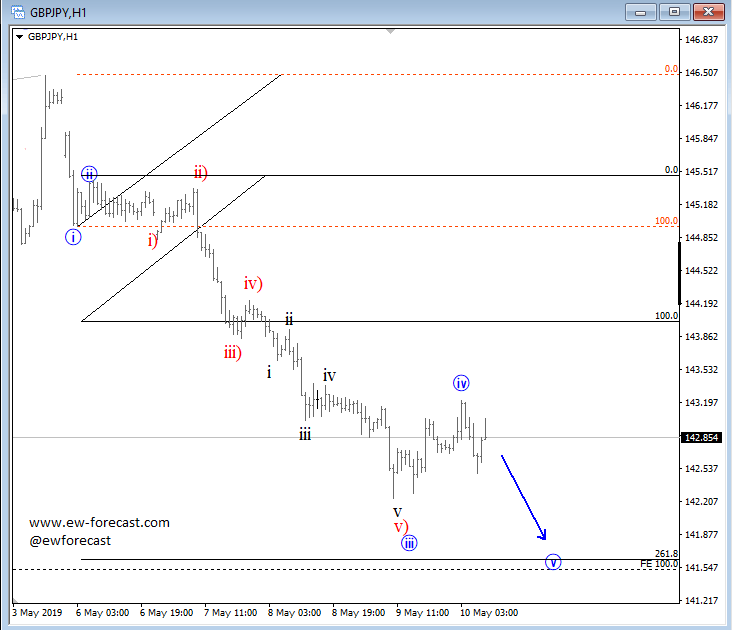
EUR/AUD Aims Lower, While AUD/USD Can Face A Bigger Bullish Turn!
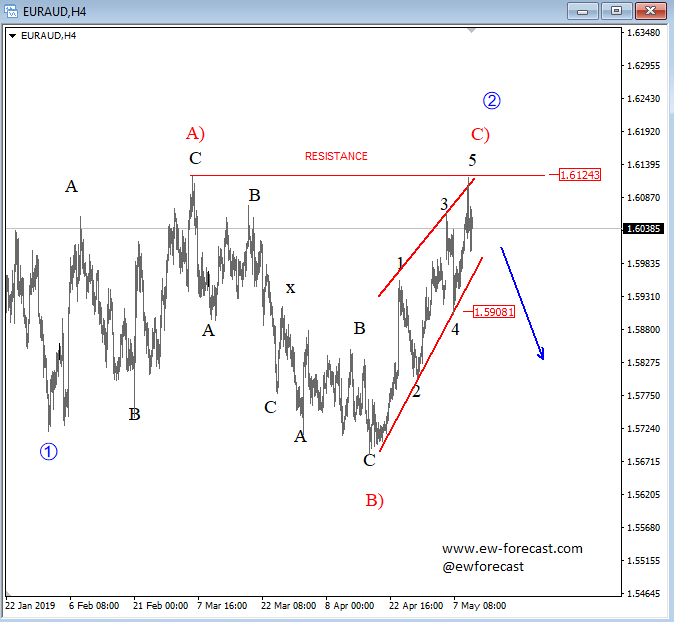
In risk-on mode EURAUD may see a drop which turned down from interesting resistance, but still have to see lower trendline of an ending diagonal broken to confirm a top in place. This pair may come in play when AUDUSD completes wave five which is not the case yet...
EURAUD, 4h
Price on AUDUSD is still trapped in a triangle pattern, which is a continuation pattern, and points into a final leg lower.
AUDUSD, 1h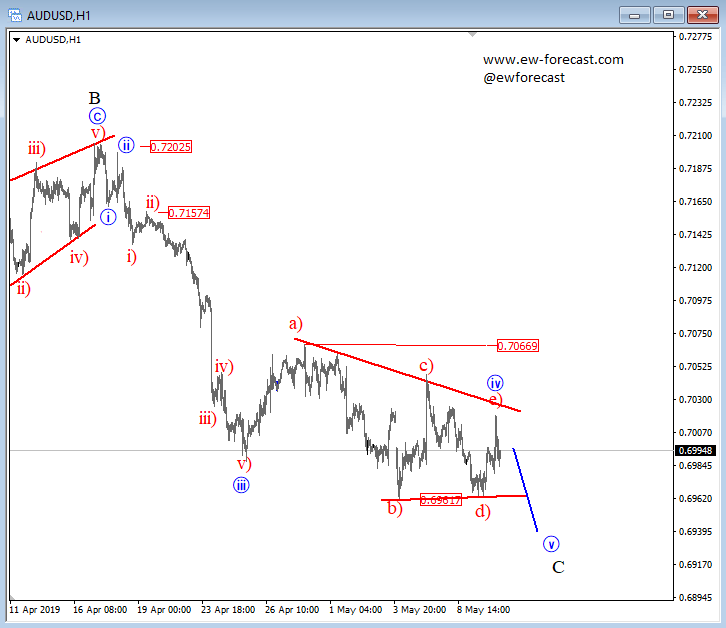
Markets Turn To Growth As Bad News Are Priced In
The United States imposed an increased 25% tariffs on Chinese goods worth $200 billion. China, in turn, promised retaliation. Nevertheless, both countries officials note that there remains a chance for a deal as early as this week. The horrendous difference between the words of politicians and their actions cause an increase in market volatility. In our opinion, the general mood at the end of the week is may be described as “buy rumours, sell facts”. That is, the actual introduction of tariffs may indicate a turnaround in the markets for growth, since this bad news may be already priced in.
Stocks
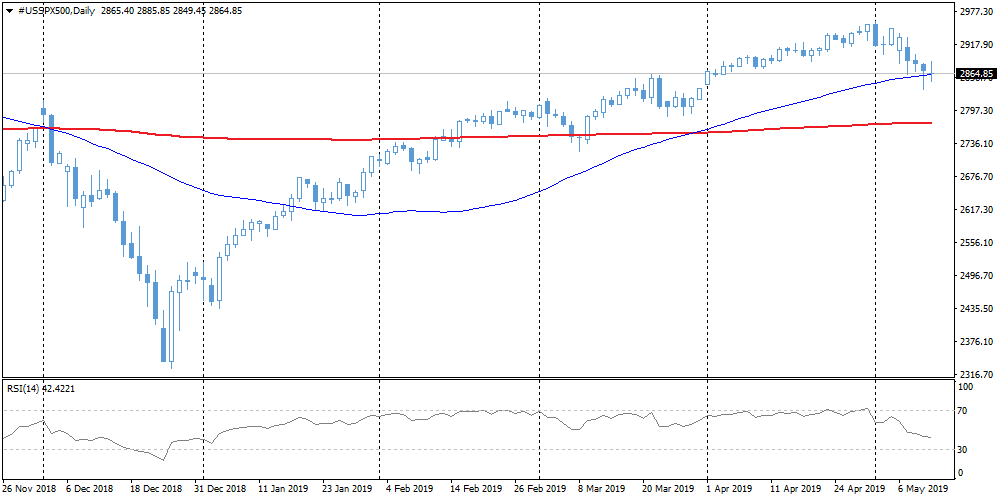
On Friday, we saw fluctuations between a sharp decline and growth in Chinese bourses. By the end of the Asian session, China A50 pushed off from 12,500, closing the week near 13,000. Futures on the S&P 500 received support at a decline to 2850, offsetting the initial decline. As for technical analysis, it is important that the S&P 500 remained above the 50-day average at the end of the trading session on Thursday. A 0.4% decline at the end of the day looks like a victory for the bulls after a 1.7% intraday drop. The closing of the week above 2860 (MA50 level) can be a strong bullish sign for the market. However, it is important to remember that news regarding the US and Chinese trade deal can break the technical picture.
EURUSD
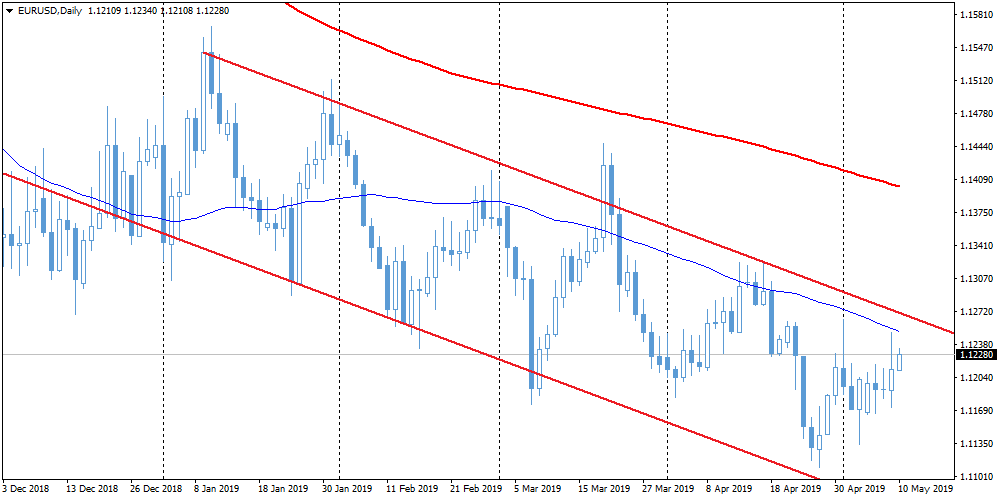
The dollar fell sharply on Thursday, prompting the growth of the EURUSD pair from 1.1190 to 1.1250. The pair remains within the downtrend, but since the end of May, it moves from its lower limit to the upper one. At the moment, this trading channel resistance goes through 1.1270, but even earlier, at 1.1255, the pair can meet serious resistance in the form of MA50. Since the end of February EURUSD fails to consolidate above this level. It will be possible to talk about the first signs of breaking the downward trend only after the close of the week above these levels.
Gold
This week, gold rose to $1,285 and is testing the resistance of the downward channel. The recent growth momentum was driven by increased investor demand for defensive assets. However, in the future, gold will have to pass an important test. A sharp growth above $1,285 at the end of the week may be evidence of the downward trend breakdown. Nevertheless, for the time being there is still a greater chance of maintaining pressure on gold.
EUR/USD Could Trade Sideways
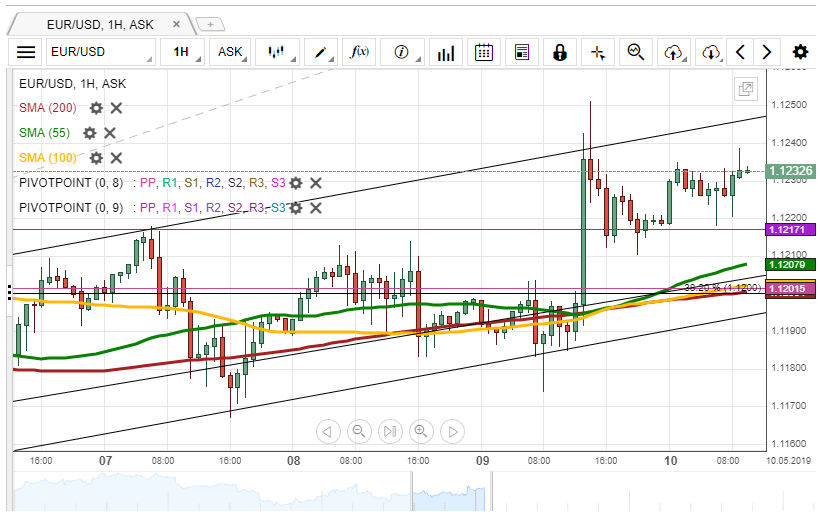
Yesterday, the EUR/USD currency pair jumped to the psychological level at the 1.1230 mark.
Given that the pair is supported by the monthly PP at 1.1217 mark, it is likely, that bulls could prevail in the market in the nearest future. A possible upside target is the psychological level at 1.1250.
On the other hand, it is expected, that the exchange rate could trade sideways, trying to breach the given resistance.
It is unlikely, that the rate could decline lower than the 1.1200 mark due to the support level formed by the 55-, 100– and 200-hour SMAs, the weekly PP and the Fibo 38.20%.
GBP/USD Might Decline To 1.2960
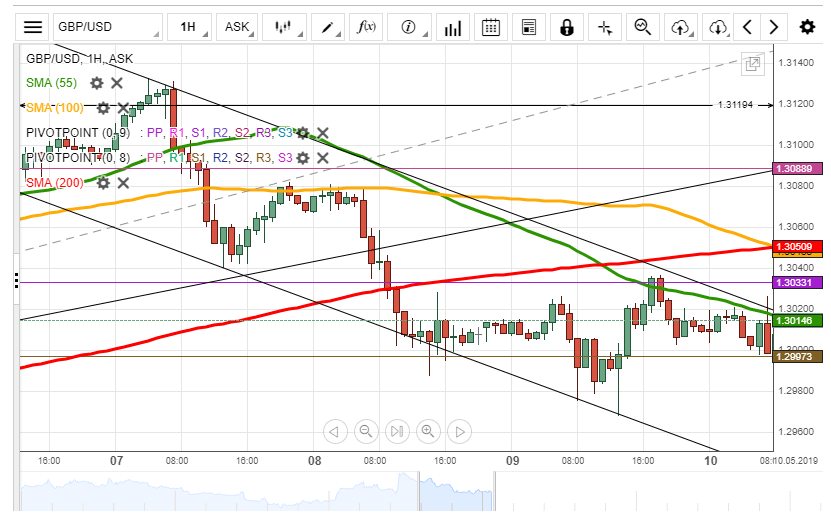
During the previous trading session, the GBP/USD exchange rate traded sideways between the weekly S1 and the monthly PP, located at 1.2997 and 1.3033 respectively.
Given that the rate is pressured by the 55-hour moving averages at 1.3017, it is likely, that some downside potential could prevail in the market. In this case, the currency pair could decline to the 1.2960 mark.
However, if the given support level holds, it is expected, that the pair could continue to trade sideways. Technically, it is unlikely, that the rate could surpass the 1.3050 level due to the resistance of the 100– and 200-hour SMAs.
USD/JPY Tests Resistance Level
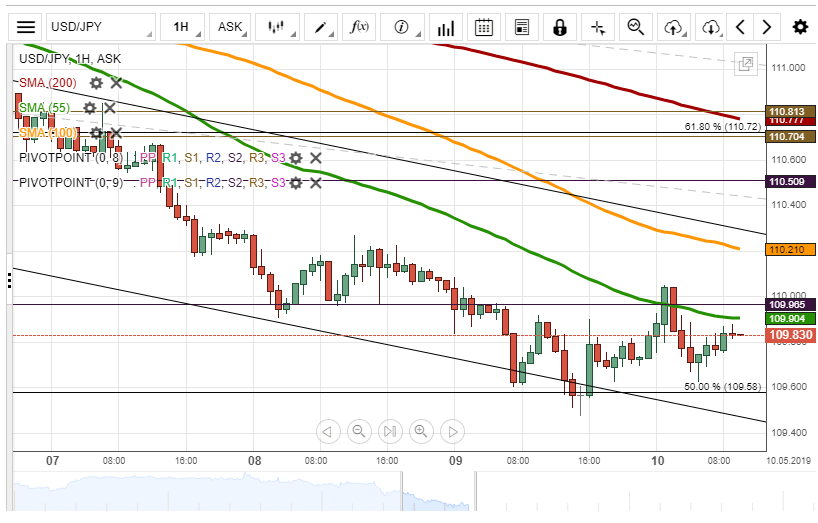
On Thursday, the USD/JPY exchange rate traded sideways near the support level—the Fibonacci 50.00% retracement at 109.58.
During Friday's morning, the rate was testing the resistance level formed by a combination of the weekly S3, the monthly S2 and the 55-hour SMA at 109.97.
If the given resistance holds, it is likely, that the currency pair could surpass the given support and decline. The nearest potential downside target is the 109.50 mark.
However, if the given support holds, it is expected, that the pair could continue to trade sideways.
XAU/USD Supported By Moving Averages
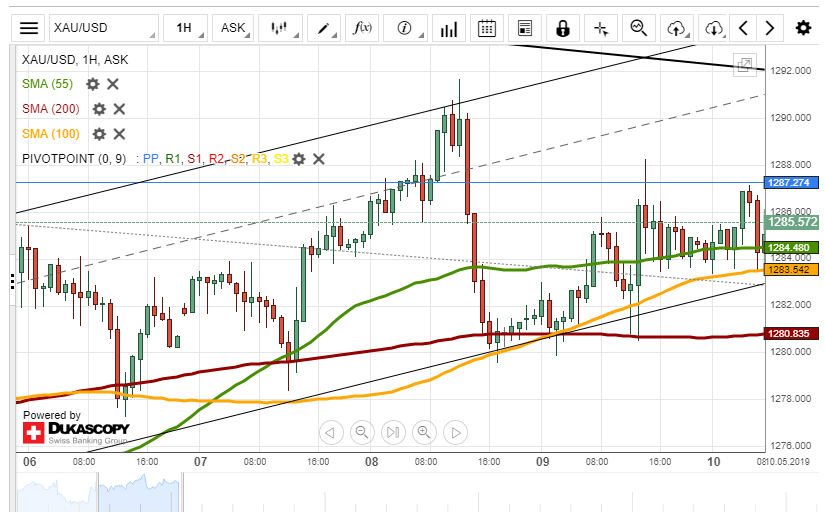
Yesterday, the XAU/USD exchange rate reached the resistance level formed by the monthly PP at 1,287.27.
Given that the rate is supported by the 55– and 100-hour SMAs located circa 1,284.00, it is likely, that some upside potential could prevail in the market. The gold could surpass the given resistance and reach the upper boundary of the falling wedge pattern at 1,290.00.
On the other hand, the price for gold could trade sideways between the given resistance and support. From a theoretical point of view, it is unlikely, that bears could prevail in the market, as the pair is trading within the short-term ascending channel.
Markets Stabilise As Trump Raises Tariffs
Rollercoaster week as trade talks take centre stage
Investors needed nerves of steel throughout the week as Donald Trump’s tweet sent financial markets up and down in rocky trading sessions. The VIX index, which is broadly viewed as a fear measure, spiked as high as 23.4 compared to 13 last Friday as global equities collapsed to multi-month lows. On Friday, President Trump carried out his threats and raised tariffs on $200 billion of tariff goods. At the same time, he said that President Xi Jinping wrote him a “beautiful letter”, suggesting that China was ready to make some concessions and to finally move forwards with the trade deal. The Donald concluded by saying that he has “no idea what’s going to happen.”
On Friday morning, investors were cautiously optimistic that the situation would ease before the weekend. Equities were mostly blinking green across the screens, while in the FX market, safe haven currencies gave up previous gains. Emerging market currencies were also better bid with the TRY, HUF and THB up 1%, 0.33% and 0.65% respectively. Unfortunately, according to a statement release on Friday, the Chinese government will have no choice but to “take necessary countermeasures.” Friday trading would most likely be as chaotic as the ones from the rest of the week. Trump would most likely drop another angry/enthusiastic tweet on Sunday; therefore, investors should make sure to avoid carry positions over the weekend. Happy trading.
Oil to firm
WTI is now building a base above the $60 handle. Looking forward we anticipated that crude oil will continue to firm over the summer. Our expectation for tighter market conditions is based on demand from US summers driving season and low gasoline inventories. Ultra strong household position indicates that 2019 vacation spending will be healthy. On the supply side, US sanction on Iranian production has slowed to levels not seen since 2013 and scheduled maintenance in North Sea and Caspian Sea will limit immediate production reaction. So far, Saudi Arabia has not increased production to OPEC assured 10.3mn output to manage higher prices. This week negative US-China trade news has marginally weighted on crude prices.
Outside of cyclical development, we remain constructive on oil prices due to broader structural changes. Since the US unilaterally withdrew from the Joint Comprehensive Plan of Action (JCPOA) tension between the two nations have only increased. In November 2018 the US re-imposed all sanctions on Iran with the US extending waver on imported Iranian crude for six months. On April 22nd the US state department announced that no more waivers would be allowed after May 2nd, 2019. The US geopolitical strategy to manage Iran is focused on reducing Iran’s oil-based revenue to zero. Oil price development remains related to Iran production decline and Saudi motivation to gain market share by raising output levels.