Sample Category Title
EUR/USD Mid-Day Outlook
Daily Pivots: (S1) 1.1173; (P) 1.1213 (R1) 1.1251; More.....
No change in EUR/USD's outlook as it's staying in range of 1.1111/1264. Intraday bias remains neutral and more consolidation could be seen. But still outlook will remain bearish as long as 1.1324 resistance holds. Larger down trend is expected to resume sooner or later. On the downside, break of 1.1111 low will target 100% projection of 1.1569 to 1.1176 from 1.1448 at 1.1105 next. However, firm break of 1.1324 will be an early sign of larger trend reversal. In such case, further rise would be seen back to 1.1448 resistance for confirmation.
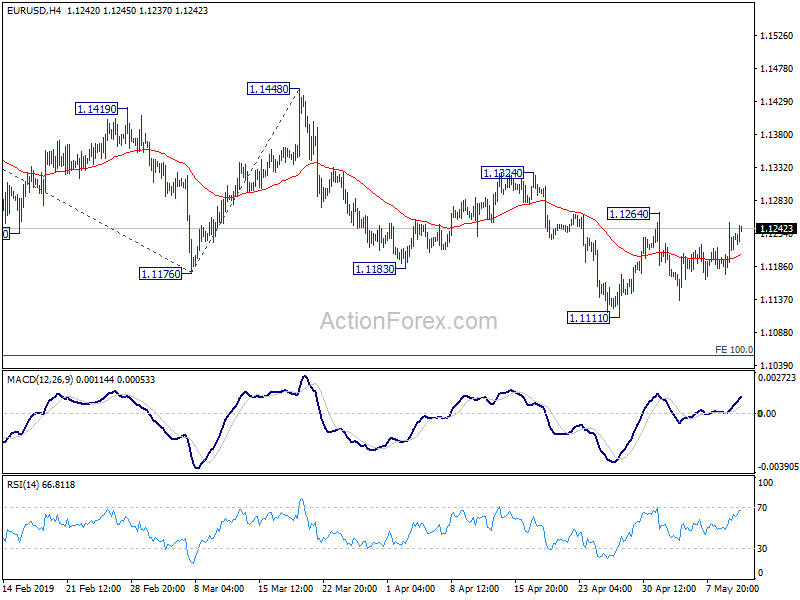
In the bigger picture, down trend from 1.2555 (2018 high) is still in progress. Current fall should now target 78.6% retracement of 1.0339 (2016 low) to 1.2555 (2018 high) at 1.0813. Sustained break there will pave the way to retest 1.0339. On the downside, break of 1.1448 resistance is needed to be the first sign of medium term bottoming. Otherwise, outlook will stay bearish in case of rebound.
GBP/USD Mid-Day Outlook
Daily Pivots: (S1) 1.2969; (P) 1.3003; (R1) 1.3037; More...
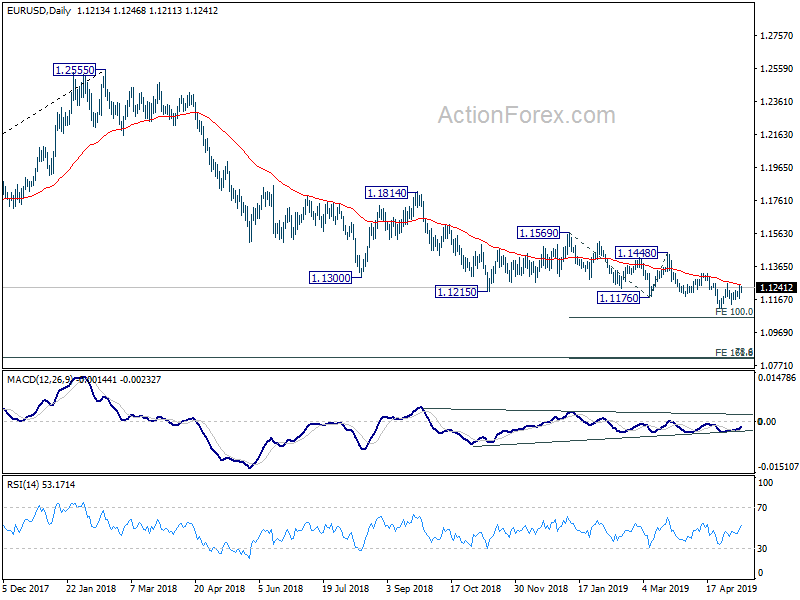
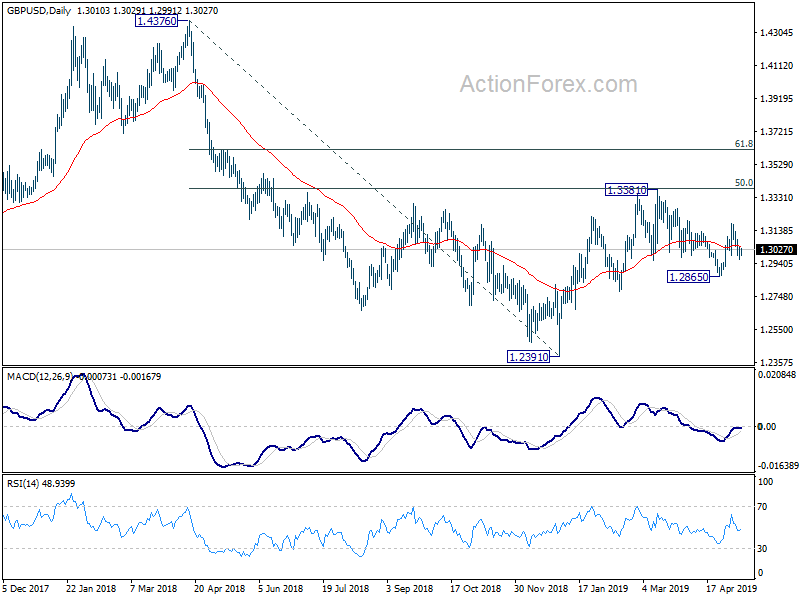
As GBP/USD's is still capped by 4 hour 55 EMA, focus remains on 1.2987 support. Decisive break there will confirm that rebound from 1.2865 has completed at 1.3176 already. More importantly, this will revive that bearish case that rebound from 1.2391 has completed at 1.3381. And intraday bias will be turned to the downside for 1.2865 support for confirming bearishness. Nevertheless, on upside, above 1.3176 will target a retest on 1.3381 high next.
In the bigger picture, medium term decline from 1.4376 (2018 high) halted and made a medium term bottom after hitting 1.2391. Rebound from 1.2391 is seen as a corrective move for now. In case of another rise, strong resistance could be seen around 61.8% retracement of 1.4376 to 1.2391 at 1.3618 to limit upside. On the downside, break of 1.2773 support will suggests that such corrective rise is completed and bring retest of 1.2391 low first.
USD/JPY Mid-Day Outlook
Daily Pivots: (S1) 109.45; (P) 109.78; (R1) 110.10; More...
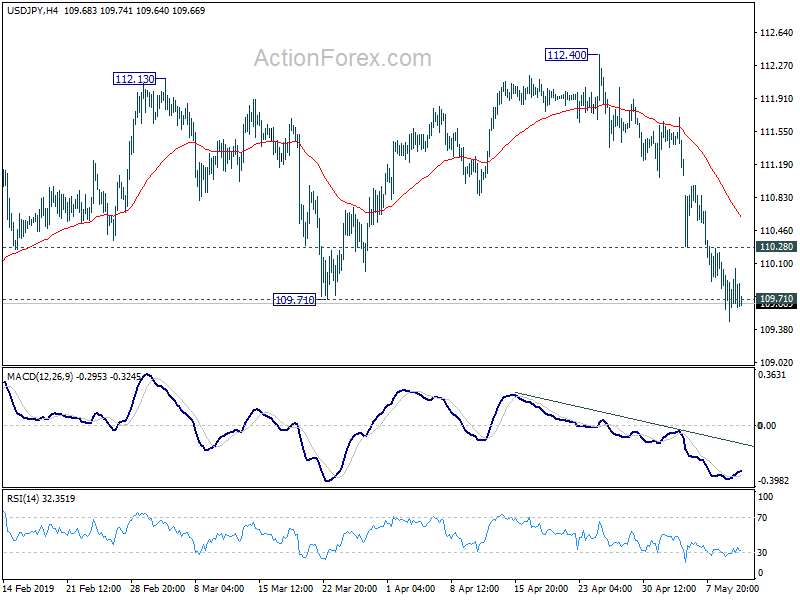
With 110.28 minor support intact, intraday bias in USD/JPY remains on the downside despite diminishing downside momentum. Sustained break of 109.72 key support will confirm completion of rebound from 104.69 at 112.40 on bearish divergence condition in daily MACD. Deeper decline should then be seen back to retest 104.69 low. On the upside, though, rebound from current level and break of 110.28 minor resistance will mix up near term outlook. Intraday bias will be turned neutral in this case first.
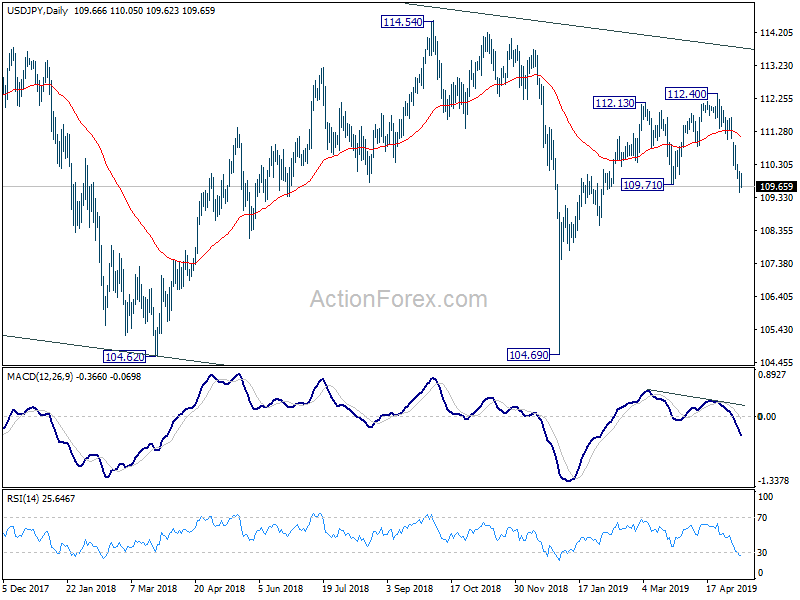
In the bigger picture, USD/JPY is staying inside falling channel from 118.65. Thus, there is no confirmation of trend reversal yet. Sustained break of 109.71 will argue that rebound from 104.69 is completed. And the down trend from 118.65 is still in progress. But at this stage, in case of break of 104.69, we'd expect strong support above 98.9 (2016 low) to contain downside an bring rebound.
Canada: April Brought Record Hiring
- An impressive 106.5k additional Canadians were working in April – the largest single monthly gain on record, and nearly an order of magnitude above market expectations. The unemployment rate fell only a notch to 5.7% as the participation rate rose.
- The composition of the gains was as impressive as the headline. Gains were largely full-time (+73.0k), largely private sector (+83.8k), and entirely in employees (+106.5k). Self-employment was unchanged.
- Leading the charge were the construction industry, adding 29.2k net positions after four months of declines, and retail and wholesale trade, where 32.4k net jobs were added.
- Regionally, it was again Ontario (+47.1k) and Quebec (+37.9k) in the driver's seat, but it was also encouraging to see a relatively solid 21.4k net positions added in Alberta.
- Wages for permanent employees were up 2.6% year-on-year basis, in the fifth month of acceleration. Total hours worked were up 0.4% month-on-month, finally breaking through their prior, November peak.
- With the impressive headline addition, the six month trend rose to 51.4k – the strongest it has been since 2002.
Key Implications
- Wow. This was by and large a solid report. Nearly every indicator of quality came in strong this month: the best-ever gain came with solid full-time job growth, all in employees (rather than self-employed), more Canadians were drawn into labour markets, and wages were up. Chalk this one up as a solid message that employers still have faith in the Canadian economy.
- If there is an area that raises questions, it is again hours worked. Despite the nearly 107k jobs added (i.e. a 0.6% monthly rise), and the 88k full-time positions therein (+0.5%), total hours worked were up only 0.4% in April. This suggests that, as strong as the headline looks, the implication for growth may not be as robust.
- Indeed, while we are not going to complain about the jobs numbers of late, their strength is a bit of a mystery when other economic indicators paint a more modest picture of the Canadian economy. The result over the past few years has been an absence of productivity gains, likely compounded by the lackluster investment numbers. It appears likely that this disconnect resolves itself through a more modest pace of hiring as the year progresses, alongside a recovery of economic activity. However, as today's data demonstrates, expect a few surprises along the way.
US 100 Index Corrects Lower, but Broader Picture Still Positive
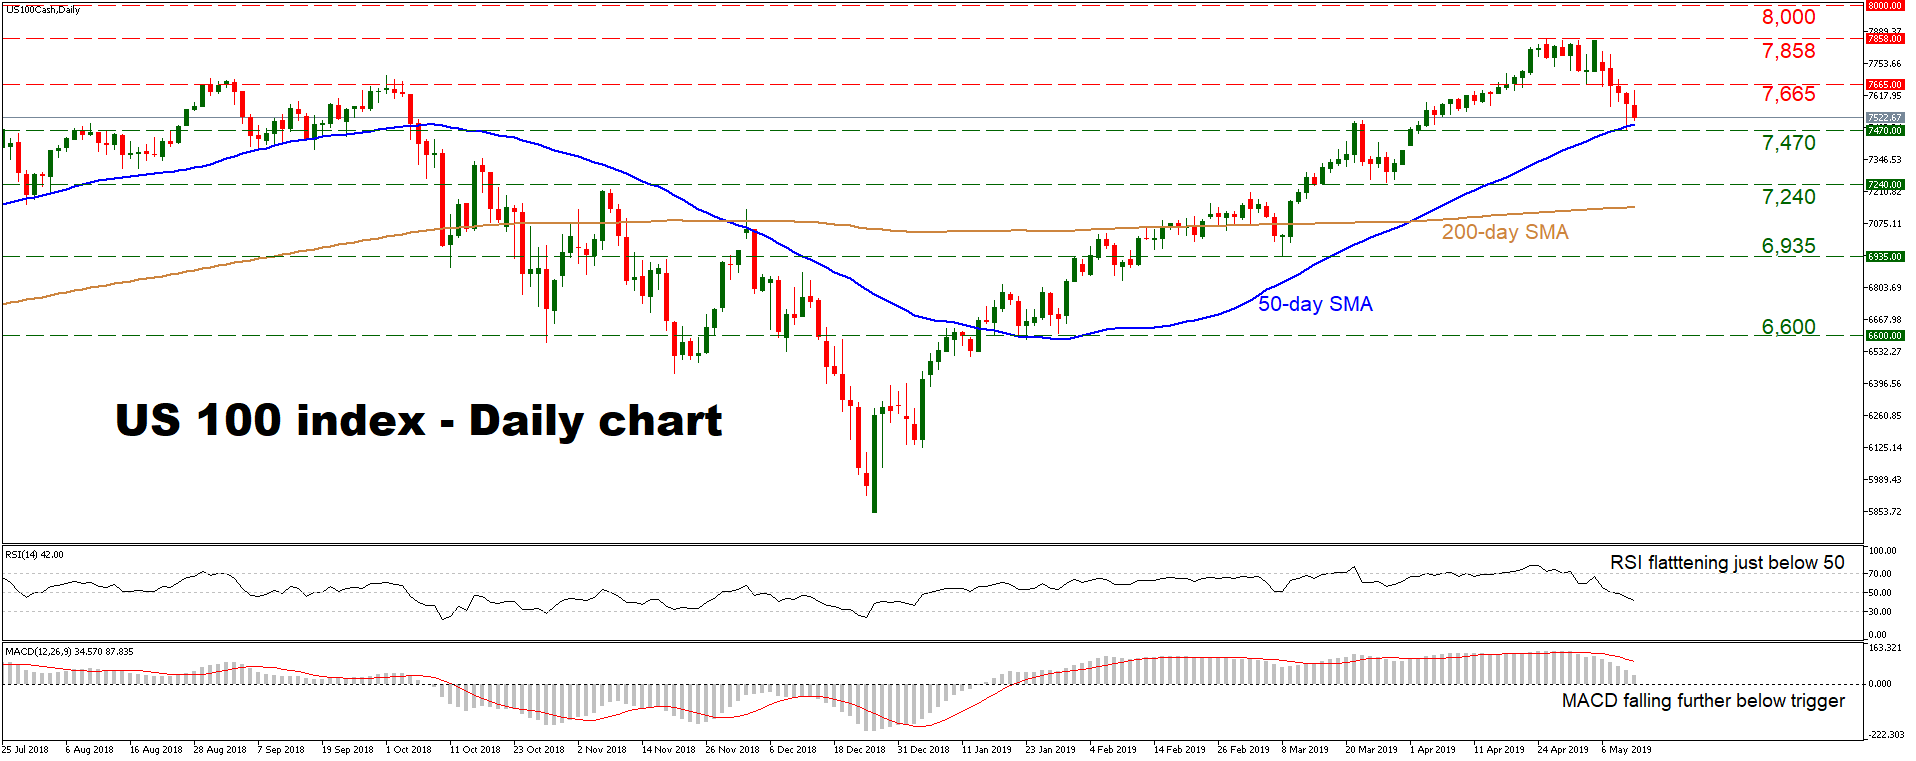
The US 100 index retreated this week, after reaching a new all-time high in late April. However, the bears have so far been unable to push the price below the 50-day simple moving average (SMA), and as long as that remains the case, the broader outlook still seems positive.
In case of further declines, a first line of support may be found near the crossroads of the 7,470 zone and the 50-day SMA, currently at 7,493. A decisive break below that area would turn the picture to a more neutral one, and open the door for a test of the 7,240 territory.
On the flipside, a rebound in the market may encounter resistance near 7,665, marked by the inside swing low on May 2, with an upside break paving the way for the all-time high of 7,858.
In short, the bigger picture is still positive, with a clear break below 7,470 and the 50-day SMA needed to change that.
DAX Jumps as German Exports Rebound, Thyssenkrupp Soars
The volatility continues for the DAX, which has been marked by wild swings throughout the week. The index is up 0.69% on Friday, after sliding 1.7% on Thursday. Currently, the DAX is at 12,057 points.
In economic news, Germany’s trade balance trade surplus widened to EUR 20.0 billion in March, up from EUR 18.7 billion a month earlier. This is the first time that the trade surplus has exceeded the EUR 20-billion level since May. A surge in exports was responsible for the larger trade surplus. German exports increased by 1.5% in March, well above the estimate of -0.3%. This was a marked improvement from February, when exports declined by 1.3%.
The DAX has also received a boost from Thyssenkrupp, which has jumped 17.5% on Friday. The stock soared after the company said it was abandoning plans to split into two separate divisions. Investors cheered this announcement, but the stock has a long way to recover, having fallen over 40% in the past year
After recording weekly gains for seven straight weeks, the DAX has hit a brick wall. The index has fallen 2.9% this week, as escalating trade tensions between China and the U.S. have rocked the equity markets. The U.S. slapped new tariffs on China at midnight on Thursday, raising the tariffs on some $200 billion in Chinese goods from 10% to 25%. Trump had announced the measure on Sunday, and global equity markets have been in flux the entire week, as risk appetite has waned. There had been hopes that the unpredictable U.S. president would change his mind ahead of the midnight Thursday deadline, but those hopes were dashed. China has promised retaliatory measures against the U.S. move. Despite these tensions, a high-level Chinese delegation is in Washington to continue the trade talks, and the markets are hoping that cooler heads prevail and a trade agreement between the two largest economies in the world is not far off.
Canada Employment Surges Higher Again in April
- Headline employment was up 107k in April – that was the largest increase in more than 40 years. The unemployment rate fell to 5.7% from 5.8% despite an uptick in the labour force participation rate
- Wage growth ticked up to 2.5% from 2.4%
The month-over-month headline employment swings are notoriously volatile – so there is reason to take even a 107k increase with a big grain of salt. But this is also not the first strong employment report we’ve seen for Canada. The employment count is up 426k from a year ago, for a whopping average monthly increase of 36k per month over that period. The typically more-stable unemployment rate dipped back close to cycle lows at 5.7% in April despite a tick up in the labour force participation rate. The soft spot in the labour market data remains wages, but year-over-year growth in average hourly earnings did tick up for a third straight month, rising to 2.5% in April from 2.4% in March. The recent drift higher is encouraging but the pace is still slower than would normally be expected with labour markets otherwise looking quite tight.
The Bank of Canada already knew that labour markets were looking solid when they moved sharply to the sidelines in terms of future interest rate hikes over the last few months. CPI inflation pressures still look quite benign and wage growth isn’t at a rate yet that would make the central bank worried about prices starting to move unsustainably higher. Household debt growth has still slowed and global growth concerns have not gone away with US and China trade tensions escalating once again this week. That should still leave the Bank of Canada with plenty of flexibility to hold off on interest rate hikes any time soon. The data also, though, continues to argue that a cut is at least as unwarranted at the moment.
US Inflation Back at 2% Despite Headwinds from Strong US Dollar
- The headline CPI index rose 0.3% month-over-month in April, lifting the year-over-year rate to a five-month high of 2.0%
- Gasoline prices rose for a third consecutive month, pushing energy inflation back into positive territory for the first time since November
- Core inflation was up just 0.1% month-over-month, but the year-over-year rate still ticked higher to 2.1%
- Rising shelter costs offset a third consecutive monthly decline in core commodity prices (particularly apparel and used vehicles)
At the last FOMC meeting, Chair Powell fielded plenty of questions on the recent decline in core PCE inflation. Core CPI has seen a similar slowdown since mid-2018, though it drew a bit less attention (it’s still running at or above 2%, and it’s not the Fed’s preferred measure). As Powell pointed out, slower price growth in some individual components is weighing on inflation. Apparel prices, for instance, are falling at their fastest year-over-year rate since 2003. US dollar appreciation to the tune of 6% is likely a factor there. As with PCE, measures of CPI that filter out such idiosyncratic price movements point to a steadier inflation trend than the standard headline and core measures suggest. That supports Powell’s view that the recent slowdown in inflation should ultimately prove transitory. But for the time being, inflation readings give the Fed little reason to deviate from their “patient” mantra.
GBPJPY Retains Downside Bias On Bear Pressure
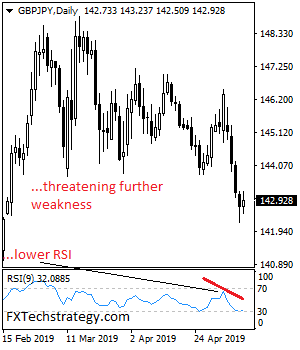
GBPJPY retains downside bias on bear pressure as it looks to follow through lower in the days ahead. further on Wednesday following its price extension. On the downside, support comes in at the 142.50 level where a violation will aim at the 142.00 level. A break below here will target the 141.50 level followed by the 141.00 level. Conversely, resistance is seen at the 143.50 level followed by the 144.00 level. A cut through that level will set the stage for a move further higher towards the 144.50 level. Further out, resistance resides at the 145.00 level. All in all, GBPJPY retains downside bias on bear pressure.
USD/CAD Mid-Day Outlook
Daily Pivots: (S1) 1.3456; (P) 1.3480; (R1) 1.3502; More...
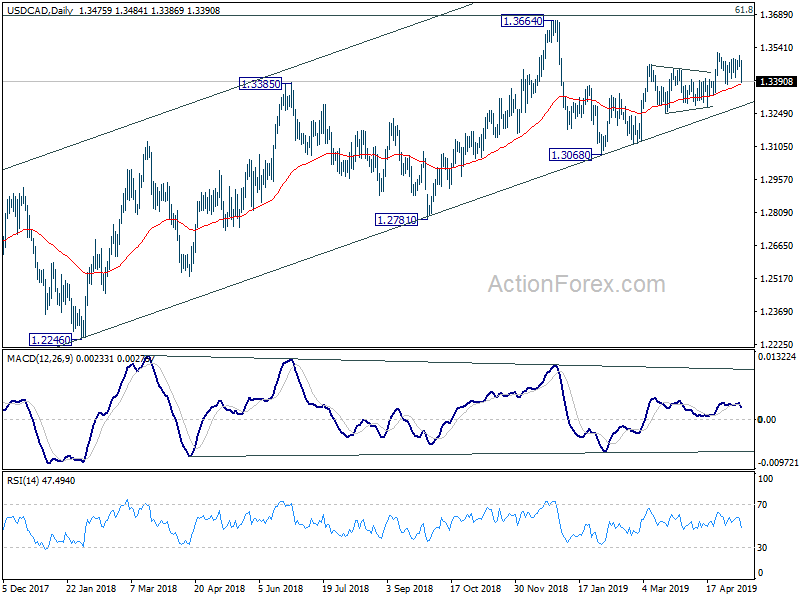
USD/CAD dives sharply as fall from 1.3505 accelerates. Still, outlook is unchanged that price actions from 1.3521 are seen as a corrective pattern. While break of 1.3376 minor support cannot be ruled out, downside should be contained above 1.3274 support to bring rise resumption. On the upside, firm break of 1.3521 will resume the whole rise from 1.3068 to retest 1.3664 high. However, decisive break of 1.3274 support will indicate completion of 1.3068 and turn outlook bearish.
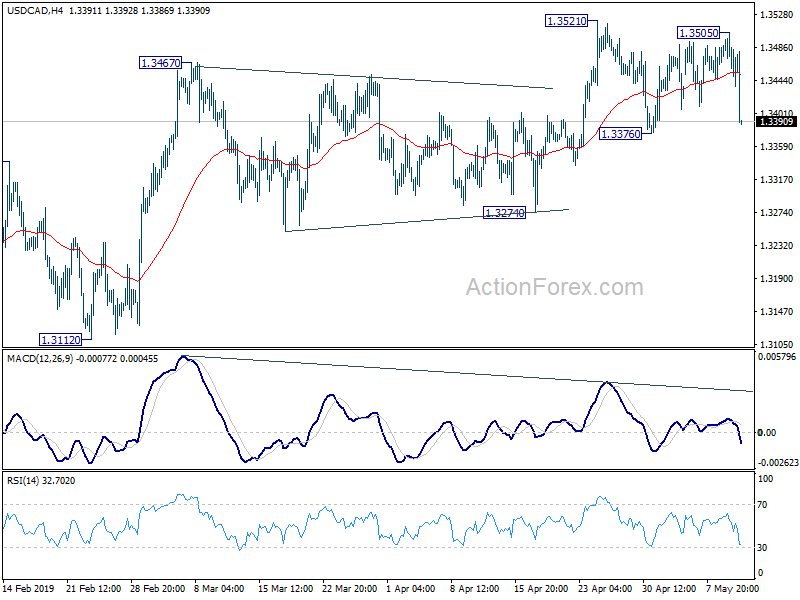
In the bigger picture, USD/CAD is staying well inside medium term rising channel (support at 1.3278). Thus, the up trend from 1.2061 (2017 low) should be in progress. On the upside, decisive break of 61.8% retracement of 1.4689 (2016 high) to 1.2061 at 1.3685 will pave the way to 78.6% retracement at 1.4127 next. This will remain the favored case as long as 1.3068 support holds. However, sustained break the channel support will be the first sign of medium term reversal. Firm break of 1.3068 would confirm.