Sample Category Title
UK Hammond hails Q1 GDP growth in all major sectors
UK Chancellor of Exchequer Philip Hammond hailed that 0.5% growth in Q1 GDO was good news, with growth in all major sectors. He added, "we’re investing billions in our infrastructure and skills to boost jobs & wages".
https://twitter.com/hmtreasury/status/1126774295944777728
GBPUSD Remains Weak
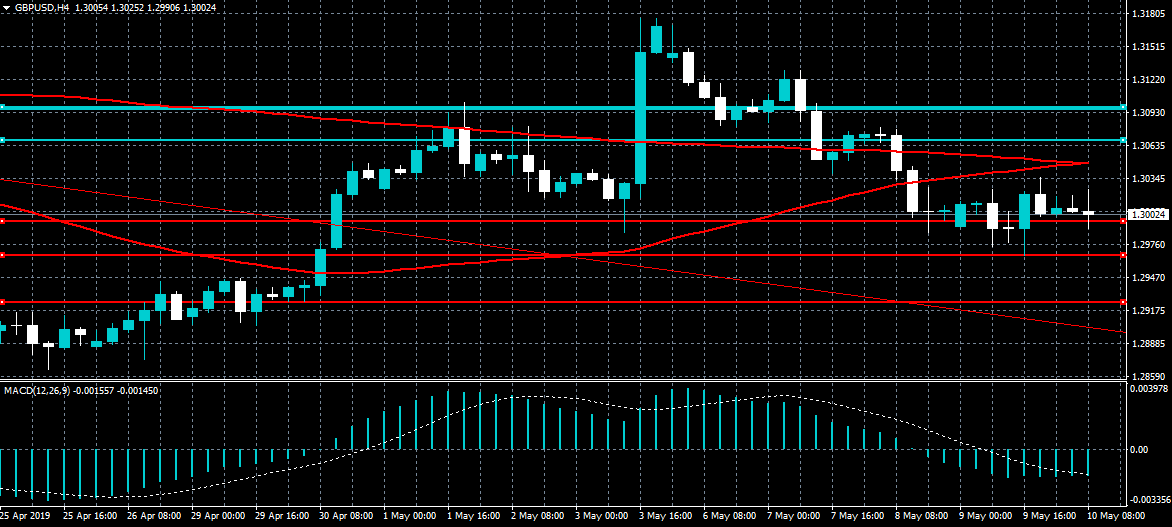
The British pound is still consolidating around the 1.3000 level against the US dollar following the release of mixed GDP data from the UK economy during the European trading session. The four-hour time frame is showing that a sustained break under the 1.2990 level will likely trigger the next round of GBPUSD selling. The bearish pattern on the four-hour time frame also shows the 1.2800 level as a potential downside target.
The GBPUSD pair is only bullish while trading above the 1.3064 level, key resistance is located at the 1.3100 and 1.3130 levels.
If the GBPUSD pair trades below the 1.2990 level, key intraday support is found at the 1.2966 and 1.2910 levels.
USDJPY 108.80 Upcoming Support
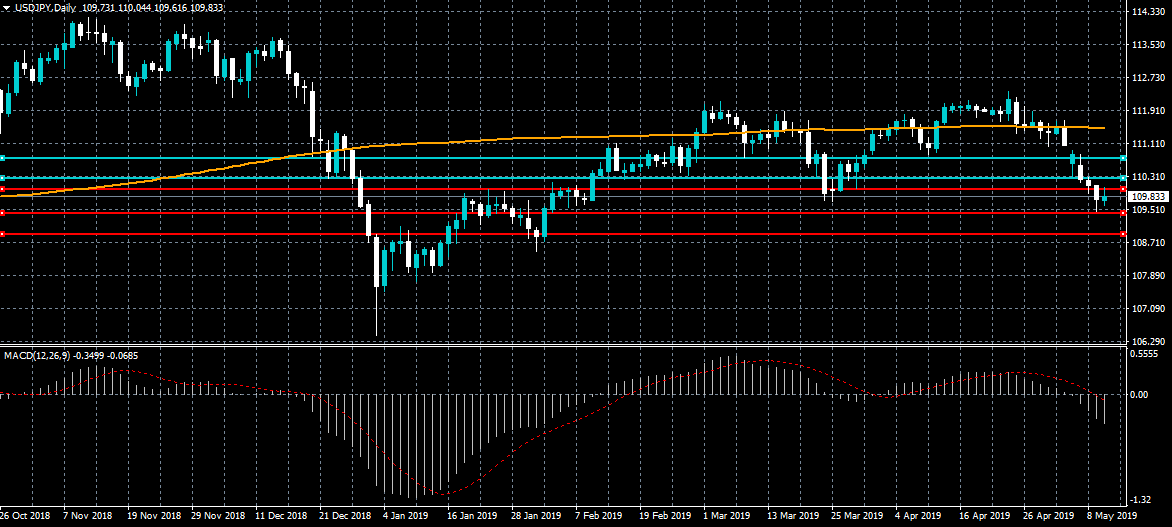
The US dollar remains vulnerable to further losses against the Japanese yen after the United States announced the start of fresh trade tariffs on Chinese imports this morning. The USDJPY pair is technically weak below the 110.00 level and could soon target the 108.80 level. The next downside technical breakout in the USDJPY pair will likely occur if the 109.40 support is broken.
The USDJPY pair is heavily bearish while trading below the 110.00, key intraday support is found at the 109.40 and 108.80 levels.
If the USDJPY pair trades above the 110.00 level, key intraday resistance is found at the 110.25 and 110.60 levels.
Greenback Falls Ahead Of CPI And China Tariffs
The Japanese yen declined slightly against the USD after the country released its earnings and spending data. In March, the average cash earnings declined by 1.9%, which was worse than the expected drop of -0.5%. This was the worst decline in more than four years. In the same month, household spending rose by a yearly rate of 2.1%, which was better than the expected 1.7%. On a MoM basis, spending increased by 0.1%.
The US dollar index declined after Trump said that new China tariffs will go into effect later today. In a statement yesterday, the president also threatened to add more tariffs. This happened as China’s Liu He arrived in Washington to continue the negotiations. Today, USD traders will focus on the US inflation data. In April, the core CPI is expected to rise by 2.1%, which will be higher than the 2.0% experienced in March. On a MoM basis, it is expected to rise by 0.2%. The headline CPI is expected to rise by 2.1%, higher than the previous 1.9%.
Traders will also pay close attention to the UK economic data. Data from the Office of National Statistics (ONS) is expected to show that the economy expanded by 1.8% in the first quarter. On a QoQ basis, it is expected to have expanded by 0.5%. In March, the manufacturing production is expected to rise by 1.3% while the industrial production is expected to rise by 0.5%. The trade deficit is expected to decline slightly to 13.8 billion pounds. In addition to the UK, traders will focus on the Canadian employment data where they expect the unemployment rate to remain unchanged at 5.8%.
EUR/USD
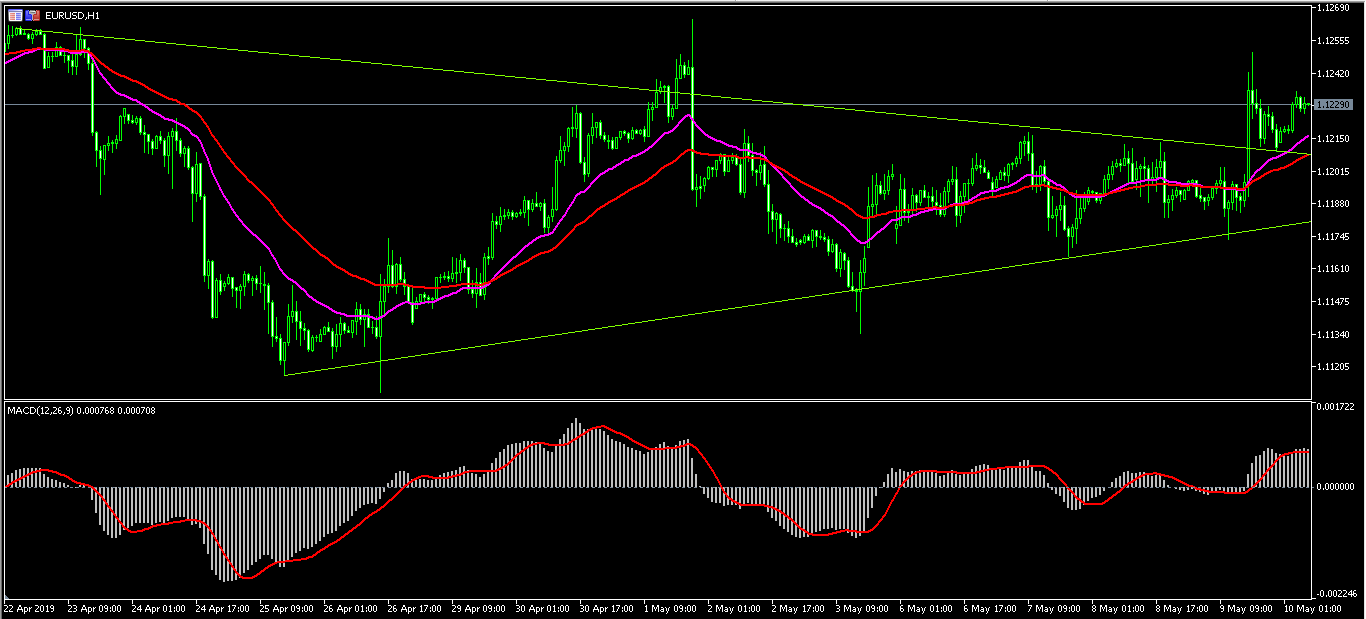
The EUR/USD pair rose sharply in overnight trading, breaking the previous triangle pattern. The pair reached a high of 1.1250 and eased a bit. It is now trading at 1.1230, which is slightly above the 25-day and 50-day moving averages on the hourly chart. This price is also above the upper line of the triangular pattern. The MACD has remained above the neutral line. Today, the pair could see some volatility as traders receive US CPI data and as the new tariffs on China goods come into effect.
USD/JPY
This week, the USD/JPY pair has continued the downward trend started in late April. The pair has dropped from a high of 112.40 to a low of 109.46. Today, the pair moved up slightly after the weak income data from Japan. The price is now below the 50-day and 25-day moving averages, while the RSI has remained along the oversold level. The pair could see some volatility ahead of the US CPI and trade news.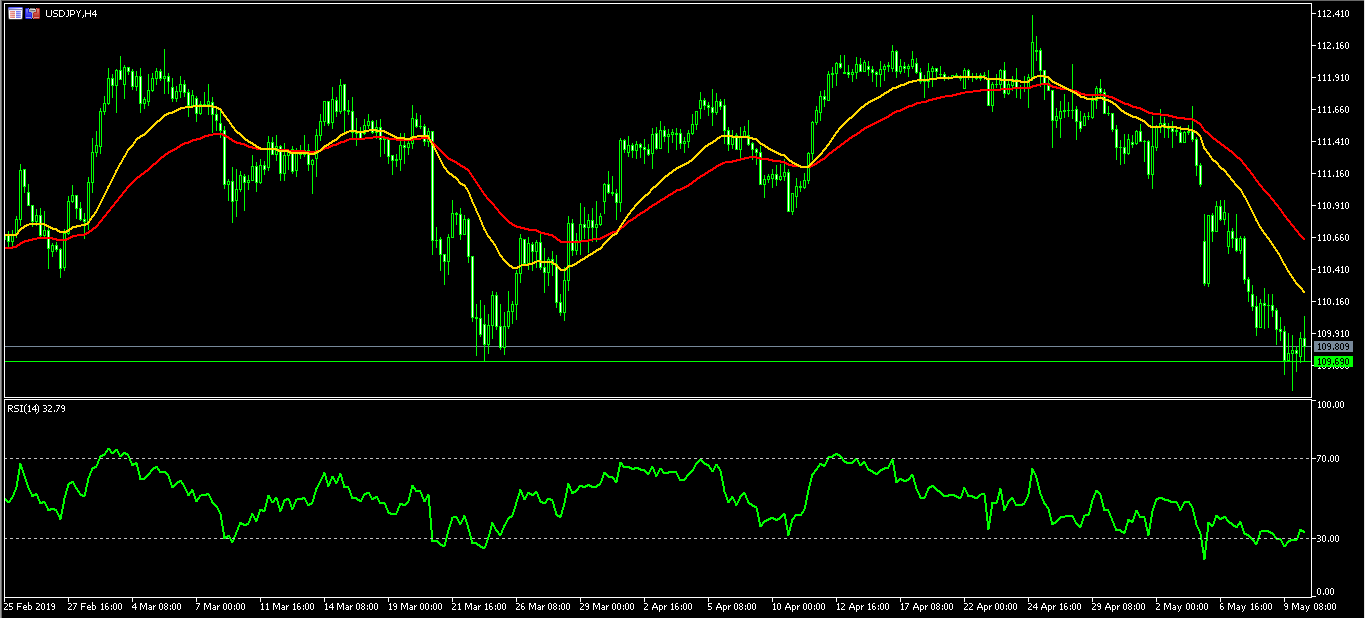
GBP/USD
The GBP/USD pair was relatively unmoved in today’s trading as investors waited for the UK data. The pair is trading at 1.3015, which is along the 50% Fibonacci Retracement level and the 25-day moving average. On the hourly chart, the volumes have declined while the accumulation/distribution indicator has remained a bit higher. Today, the pair will likely be a bit volatile because of the UK and US economic data.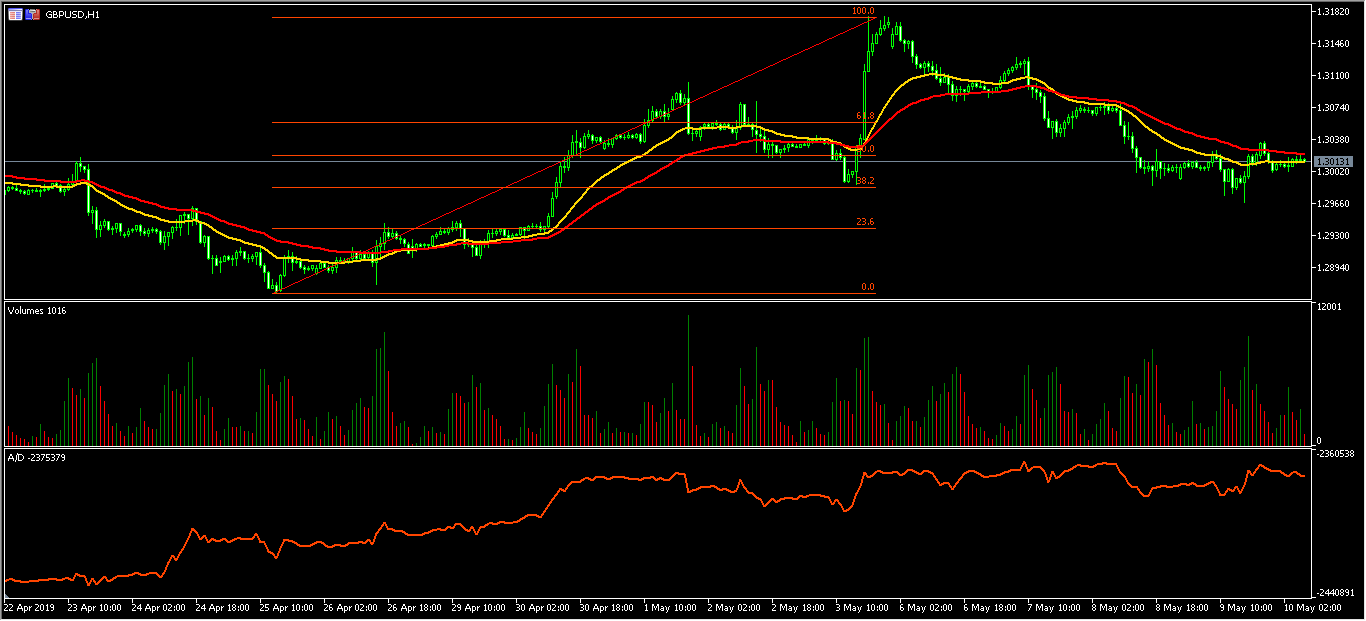
The Analytical Overview Of The Main Currency Pairs
The EUR/USD currency pair
Technical indicators of the currency pair:
Prev Open: 1.11912
Open: 1.12128
% chg. over the last day: +0.25
Day's range: 1.12123 – 1.12348
52 wk range: 1.1111 – 1.2009
EUR/USD started to grow and updated the local maximums. Yesterday, the US published weak economic reports, including the manufacturer's price index and the primary jobless claims. Right now the quotes are consolidating around 1.12100-1.12350. The financial market participants are waiting for the final decision regarding the US/China trading conflict. Keep an eye on this issue and open positions from the key levels.
At 15:30 (GMT+3:00) the US will publish an inflation report. Also keep an eye on the statement made by the FOMC representatives.
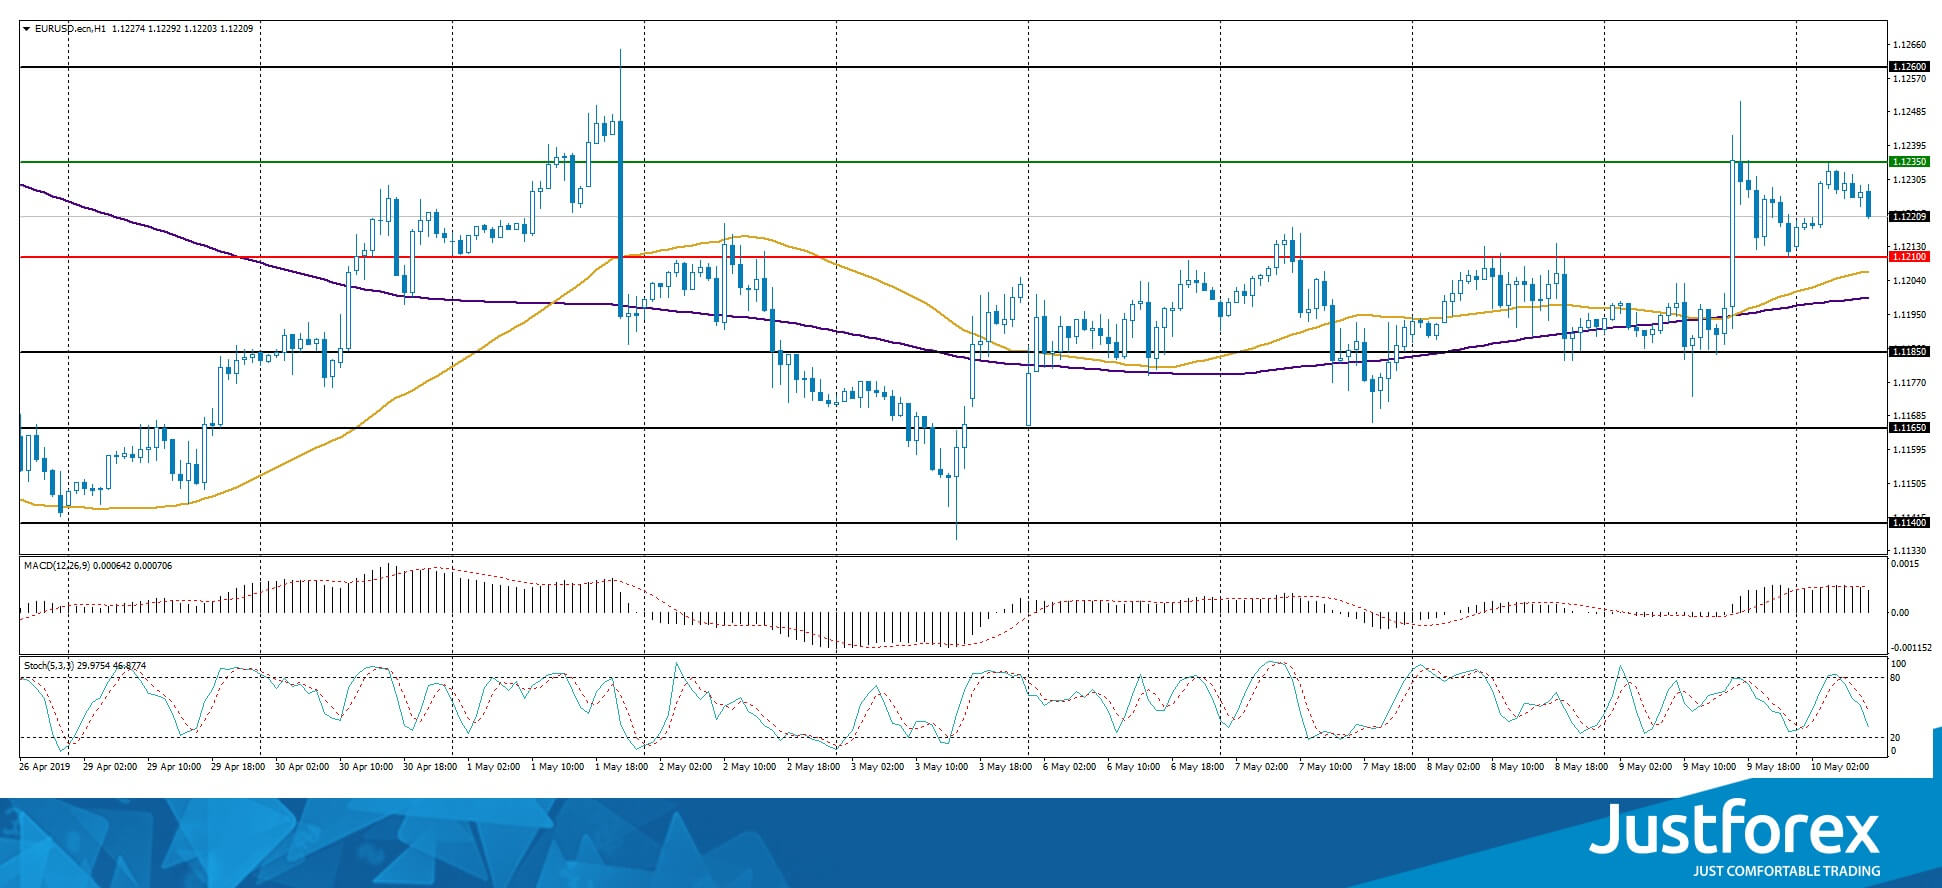
The price fixed above 50 MA and 200 MA which points to the power of the buyers.
The MACD histogram is in the positive zone but below the signal line which gives a weak signal to buy EUR/USD.
The Stochastic Oscillator is in the neutral zone, the %K line is below the %D line which points toward a bearish mood.
Trading recommendations
Support levels: 1.12100, 1.11850, 1.11650
Resistance levels: 1.12350, 1.12600
If the price fixed above 1.12350, expect further growth toward 1.12600-1.12800.
Alternatively, the quotes can descend toward 1.11850-1.11700.
The GBP/USD currency pair
Technical indicators of the currency pair:
Prev Open: 1.30059
Open: 1.30126
% chg. over the last day: +0.03
Day's range: 1.29968 – 1.30204
52 wk range: 1.2438 – 1.3631
GBP/USD has an ambiguous technical picture. GBP is moving sideways. The key support and resistance levels are 1.29800 and 1.30400. The investors are waiting for the UK GDP report for the first quarter of 2019. The experts are expecting for the increase in the economic growth soon. Keep an eye on the Brexit situation and open positions from the key levels.
The Economic News Feed for 10.05.2019:
GDP Report (UK) – 11:30 (GMT+3:00);
Industrial Production Volume (GB) – 11:30 (GMT+3:00);
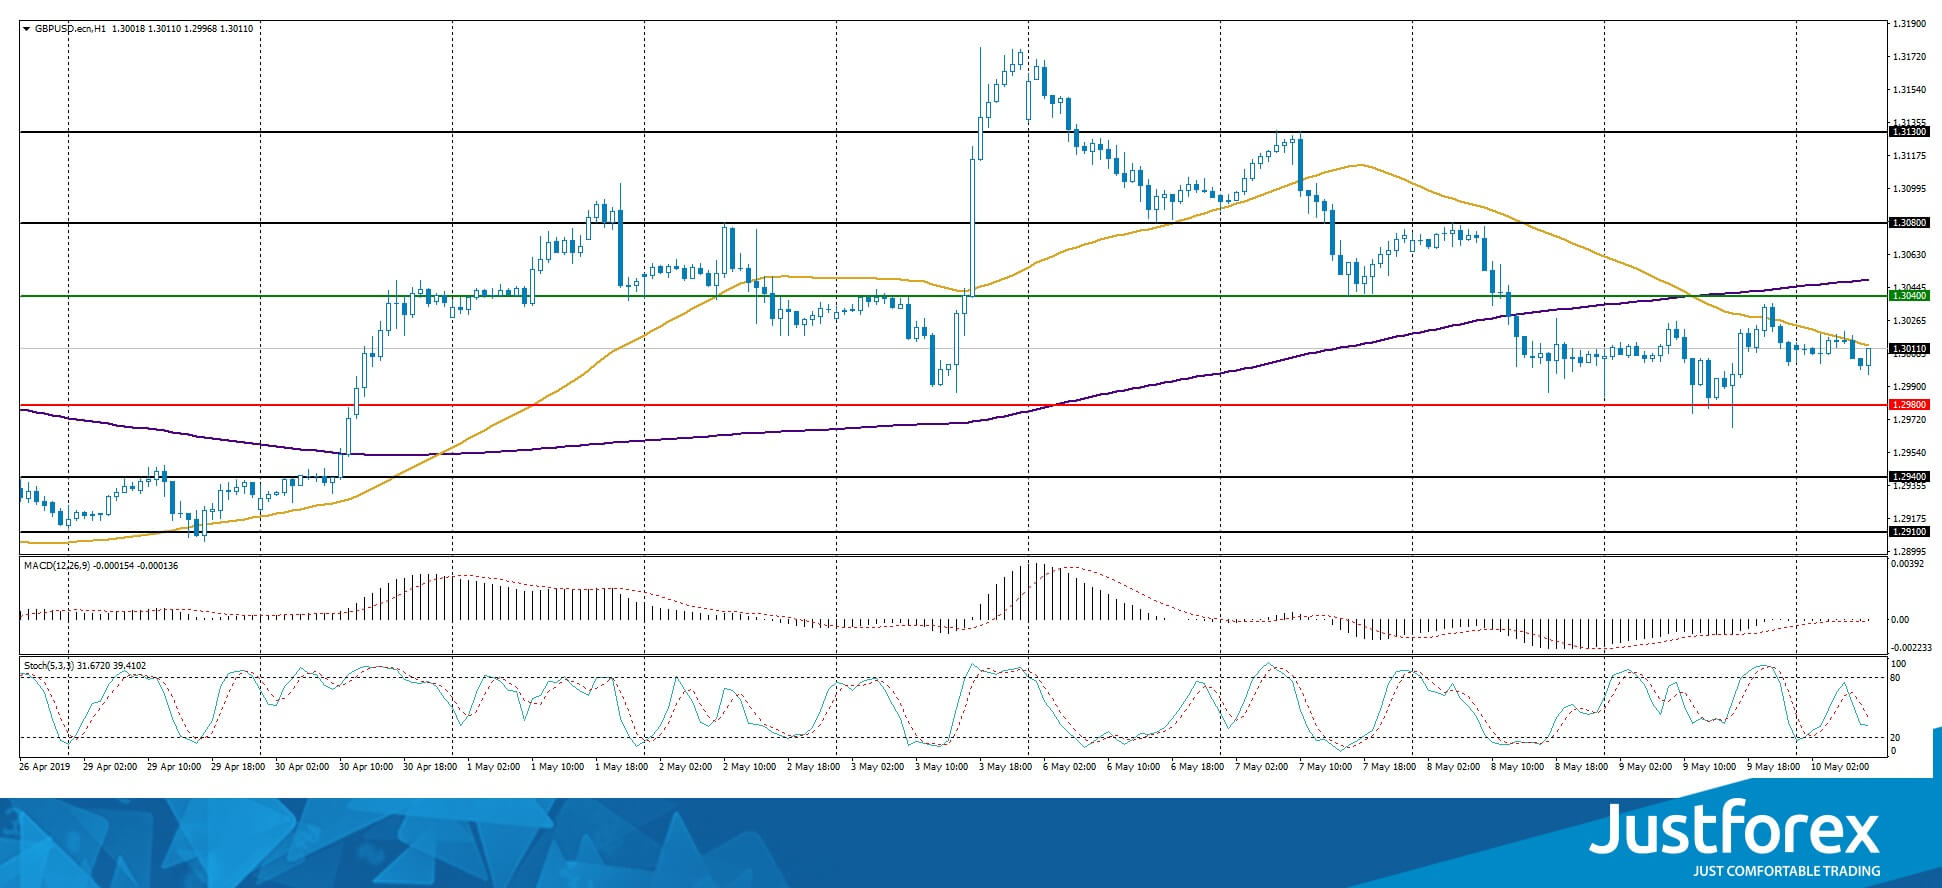
The indicators do not provide precise signalf, the price has crossed 50 MA.
The MACD histogram is close to 0.
The Stochastic Oscillator is in the neutral zone, the %K line is below the %D line which points to the bearish mood.
Trading recommendations
Support levels: 1.29800, 1.29400, 1.29100
Resistance levels: 1.30400, 1.30800, 1.31300
If the price fixes below 1.29800, expect further descend toward 1.29400-1.29100.
Alternatively, the quotes can recover toward 1.30800-1.31000.
The USD/CAD currency pair
Technical indicators of the currency pair:
Prev Open: 1.34759
Open: 1.34646
% chg. over the last day: -0.10
Day's range: 1.34355 – 1.34841
52 wk range: 1.2727 – 1.3664
USD/CAD remains ambiguous. The CAD keeps trading in a flat. The local support and resistance levels are 1.34350 and 1.34750. Today Canada will publish important statistic reports which may influence the balance of powers on USD/CAD. Keep an eye on the oil quotes dynamics and open positions from the key levels.
At 15:30 (GMT+3:00) Canada will publish a labour market report.
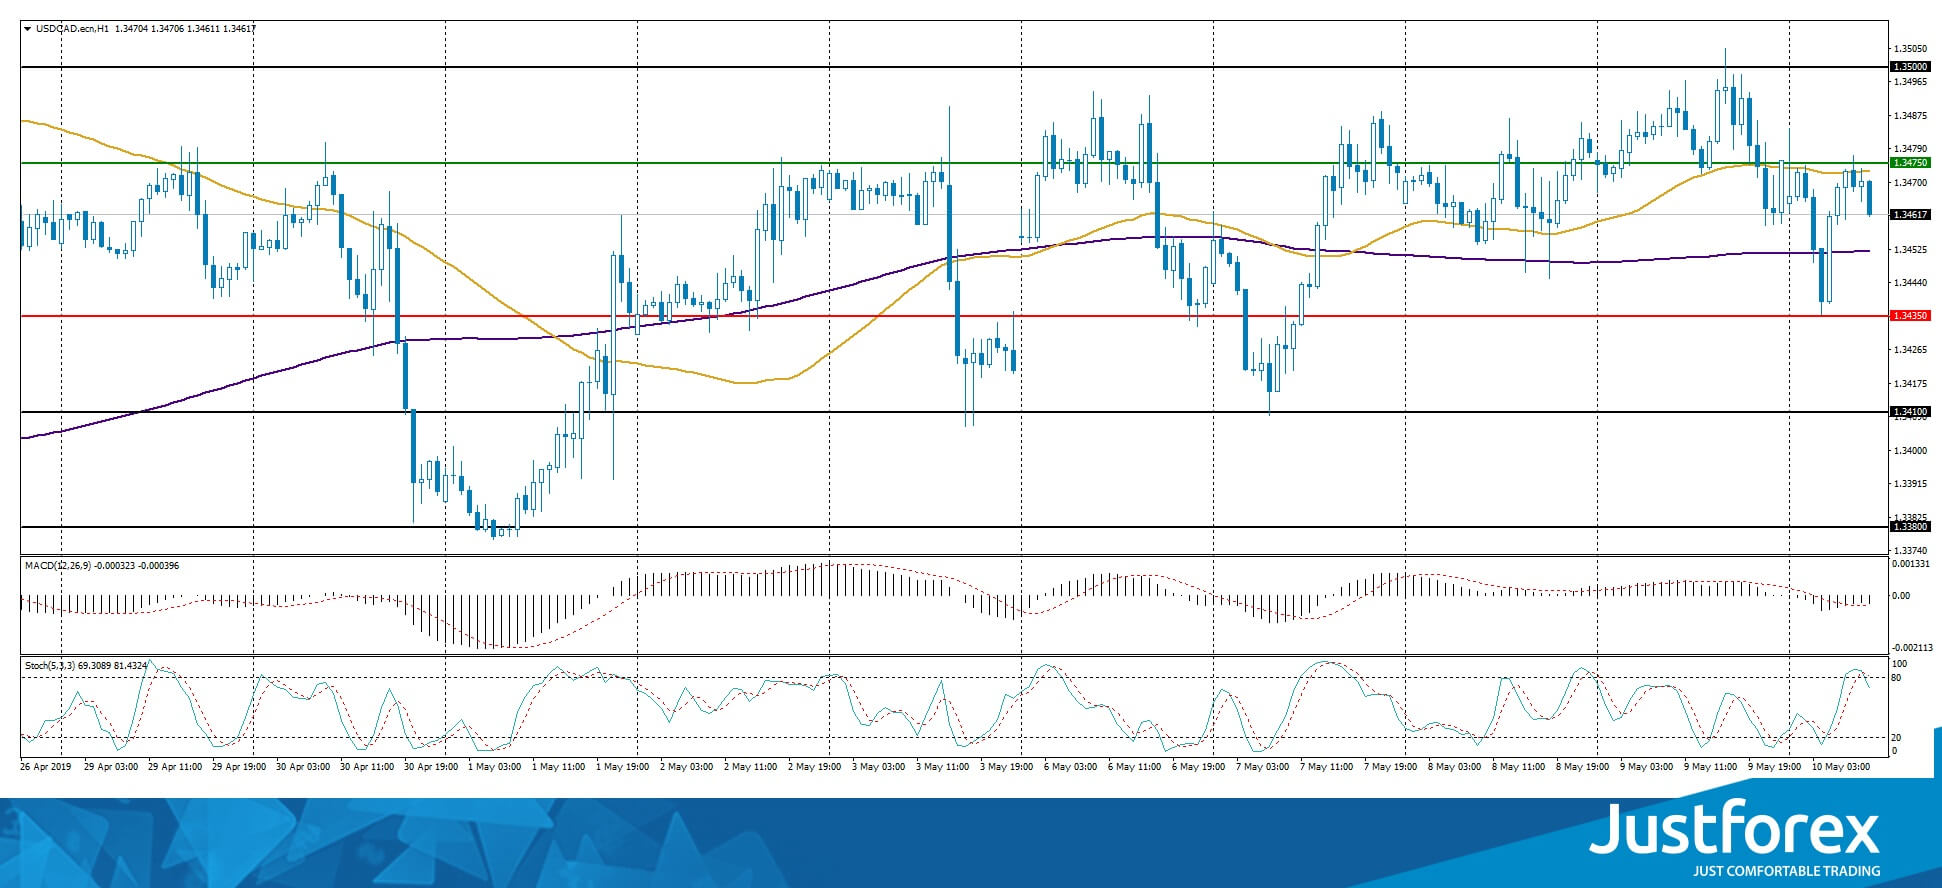
The indicators do not provide precise signals, the price has crossed 50 MA and 200MA.
The MACD histogram is in the negative zone and above the signal line which gives a weak signal to sell USD/CAD.
The Stochastic Oscillator is near the overbought zone, the %K line is crossing the %D line. There are no signals at the moment.
Trading recommendations
Support levels: 1.34350, 1.34100, 1.33800
Resistance levels: 1.34750, 1.35000, 1.35200
If the price fixes above 1.34750, consider buying USD/CAD. The price will ascend toward 1.35000-1.35300.
Alternatively, the price will descend toward 1.34000.
EUR/JPY Targets At 124.12
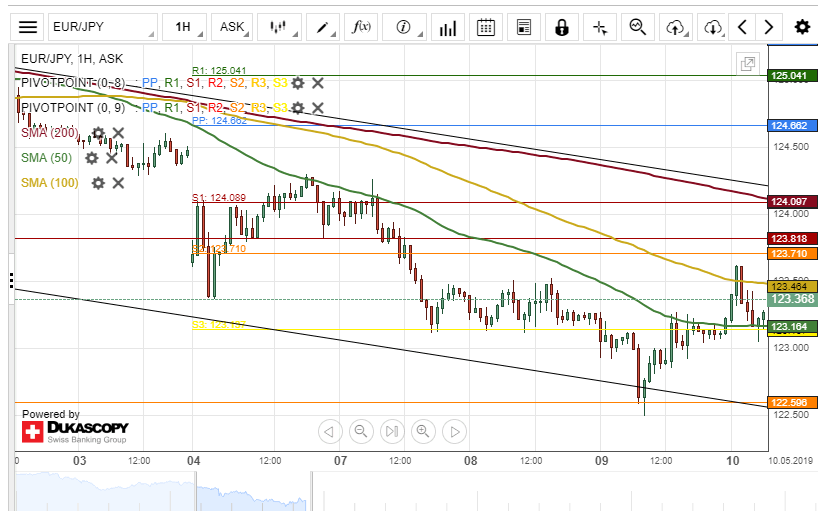
The Eurozone single currency bounced off the lower boundary of a descending channel pattern at 122.50 during Thursday's trading session.
Currently, the exchange rate is stranded between SMAs. The 100-hour simple moving average was providing resistance for the pair at 123.48, while the 50-hour SMA provided support at 123.16.
Most likely, a breakout from the moving averages is likely to occur during the following trading session.
A surge towards a resistance cluster formed by the 200-hour simple moving average and the weekly S1 at 124.08 will be the target for the Euro today.
AUD/USD Sets For Breakout
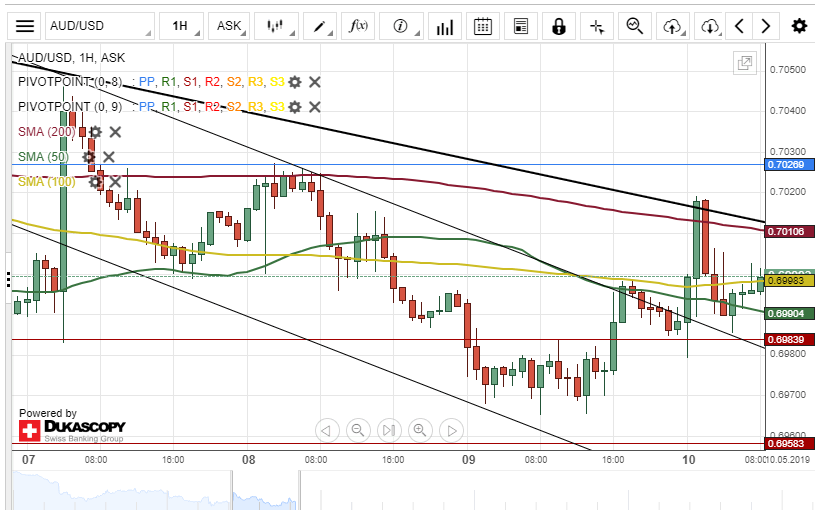
During the past 24 hours, the Australian Dollar has appreciated about 53 base points against the US Dollar. The currency pair breached the 200-hour simple moving average at 0.7011 during the Asian trading session on Friday.
The exchange rate is currently trading near the upper boundary of a descending channel pattern at 0.6998 and could be set for a breakout.
If this breakout occurs, a surge towards a resistance level at 0.7026 could be expected during the following trading session.
However, if the upper boundary of the channel pattern holds, bears would continue their dominance over the exchange rate today.
USD/CAD Fails To Break Resistance Line At 1.3484
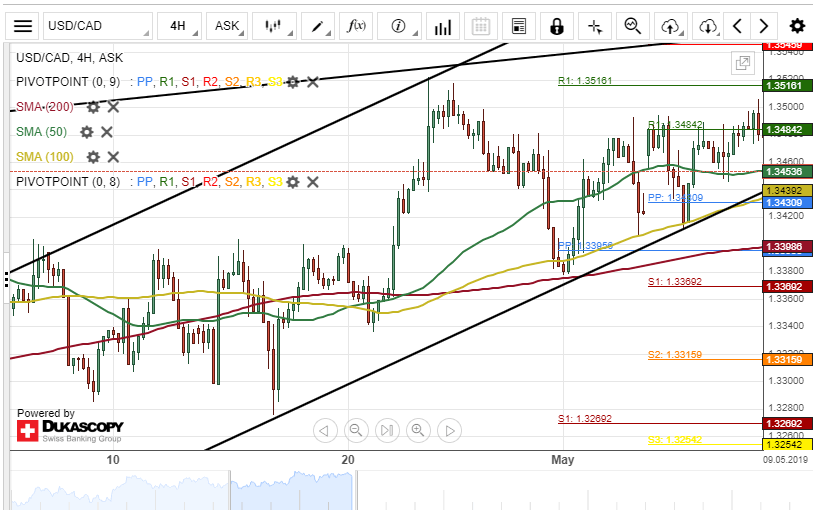
The US Dollar edged lower by about 50 base points against the Canadian Dollar on Thursday. The decline of the currency pair continued during the Asian trading session on Friday.
Given that the currency exchange rate has failed to break a resistance level at 1.3484, it is likely that the USD/CAD pair will decline during the following trading session. The potential downside target for bearish traders will be at the 1.3420 area.
Although, today's macroeconomic data releases scheduled at 12:30 GMT could play a significant role in the positioning of the currency pair today.
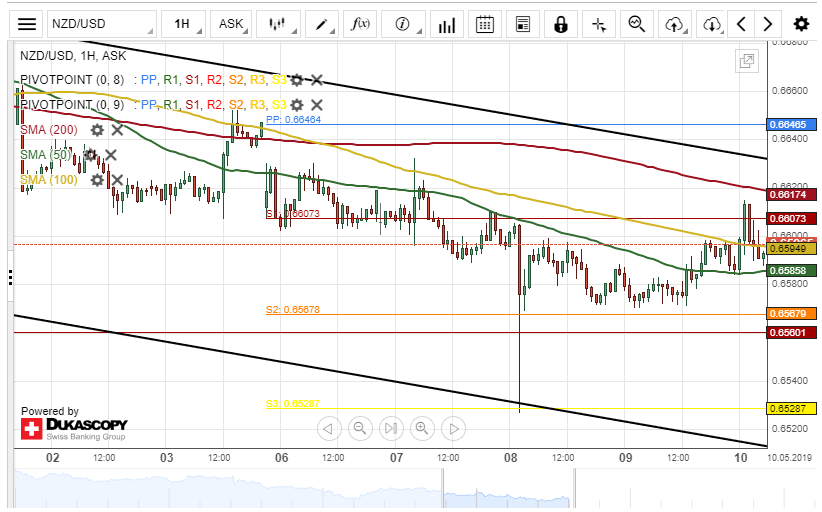
NZD/USD Likely To Edge Up
The New Zealand Dollar traded with low volatility against the US Dollar on Thursday. The currency pair tested the upper boundary of a descending channel pattern during the morning hours of today's trading session.
As for the near future, it is likely that the NZD/USD exchange rate will gain strength. The possible upside targets for bullish traders will be near the weekly pivot point at 0.6646.
Although, a resistance level formed by the 200-hour simple moving average at 0.6617 could hinder bulls from pushing the currency exchange rate higher during the following trading session.
BTCUSD $6,400 Major Resistance
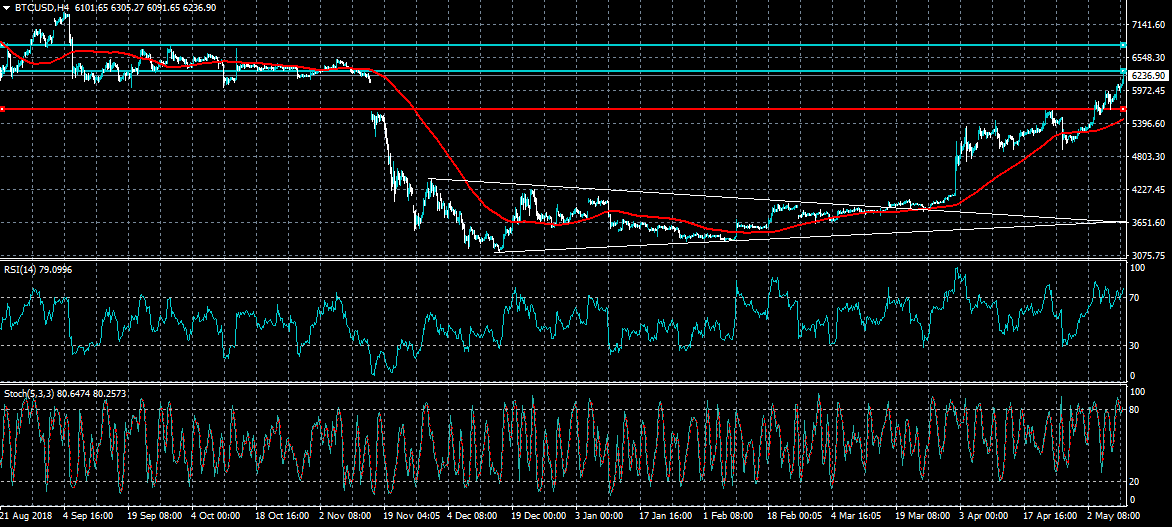
Bitcoin has advanced to a fresh 2019 trading high in early Friday trade, with number one cryptocurrency by market capitalization testing towards the $6,300 resistance level. The $6,400 level is the major resistance area to watch if the $6,300 level is broken. If the $6,400 level is breached, the four-hour time frame is showing that BTCUSD bulls could target the $6,900 resistance level.
The BTCUSD pair is bullish while trading above the $6,000 level, key intraday resistance is found at the $6,400 and $6,900 levels.
If the BTCUSD pair trades under the $6,800 level, sellers may test towards the $5,860 and $5,620 support levels.