Sample Category Title
Elliott Wave Analysis: EUR/USD And AUDUSD Update
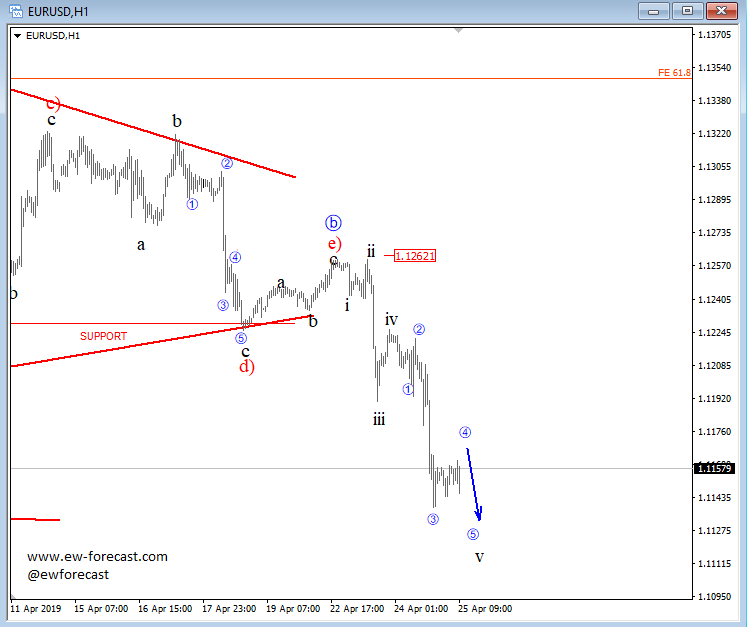
USD Index is still in uptrend, now in wave four so more upside is expected which can be supportive for overall dollar pairs, including USDJPY. USD Index can be headed up to 98.40/50 area, while EURUSD bears may continue towards 1.1100.
EURUSD, 1h
Aussie is also weakening against the buck, now seen in late stages of an extended wave three which managed to break below 0.7048 low that can become a resistance after an upcoming wave four bounce, which may be around the corner.
AUDUSD, 1h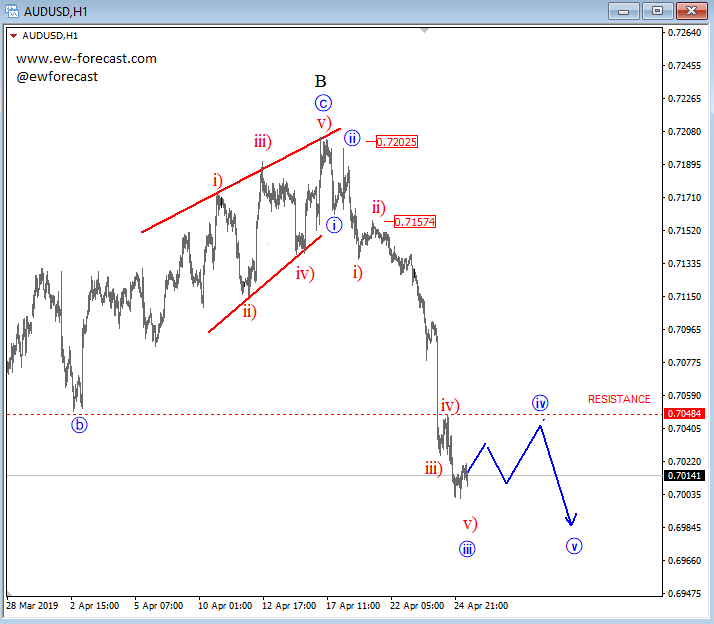
Oil Gathering Momentum As Brent Hits New Highs
Markets mixed as earnings season hots up
It's been an interesting morning in financial markets, not that you'd guess that based on the mixed trade being seen across Asia and Europe.
US futures are pointing to a similar start on Wall Street as well, which you'd typically associate with light newsflow but what we're currently seeing is anything but. We're getting earnings reports from a large number of major firms and the report card for the US has so far been far better than expected. Another 62 S&P 500 companies will report including Amazon, Intel and Ford so we're not going to be short of things to talk about.
Failed M&A deals is another common theme today, with the Sainsburys/ASDA merger being blocked by the CMA and talks between Deutsche Bank and Commerzbank being abandoned.
Oil gathering momentum as Brent hits new highs
Oil prices are on the rise again on Thursday, with the inventory data from API and then EIA over the last 48 hours merely causing a pause in the rally despite reporting large increases. It would appear traders are far more interested in oil waivers that were granted by the US to eight countries that expire in May, affecting up to a million barrels of oil purchases each day.
While it was reported that the US, Saudi Arabia and UAE will fill the void left by any shortfall, there are serious doubts about how and when this would be achieved. And when you consider the fact that two of the three are currently actively trying to curb output in order to rebalance the market and lift prices, you have to question the motivation to then step in and turn on the taps.
From a traders perspective, this means fresh six month highs in Brent crude, with WTI lagging slightly behind. What's interesting is that momentum doesn't appear to be lacking from the latest moves which suggests prices could continue to rise. Brent could face an interesting test around the $76-78 range, with WTI facing similar challenges around $67-69. Should these levels give way, it could be a very bullish signal for oil and recent moves suggest there is potential for this.
Gold bulls have reason to feel optimistic
Gold is trading in the green for a second day on Thursday, buoyed by some softness in the dollar. Gold bulls are also likely boosted by price action on Wednesday when the yellow metal made gains even as the greenback surged to a near two-year high. This is encouraged as the relationship between the two is usually negative but a stronger dollar failed to hold it back.
What's more, the recent break below $1,280 failed to generate downward momentum and each time a new low has been made it's quickly been bought into. That is hardly encouraging for those that hoped the breakout would bring about another wave of selling, especially against the backdrop of a stronger dollar. Hope is not entirely lost for bears though. Gold remains below $1,280 currently despite numerous tests which should be encouraging. What all this means is that $1,260 may in fact be a far more significant support level for the yellow metal, should it be tested.
Forex Technical Analysis: EUR/USD, USD/JPY, GBP/USD
EUR/USD
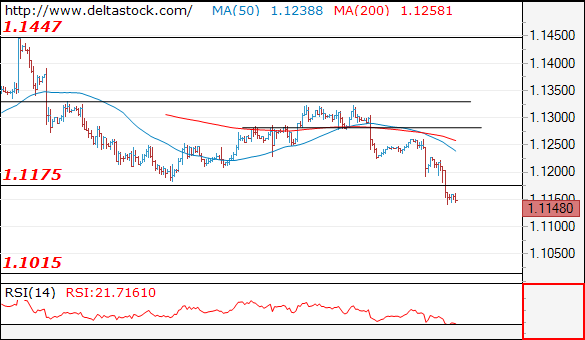
Current level - 1.1148
The pair broke through 1.1175 major low and the bias is bearish, for a slide towards 1.1010 area. Initial resistance is projected at 1.1175 and crucial is 1.1225.
| Resistance | Support | ||
| intraday | intraweek | intraday | intraweek |
| 1.1175 | 1.1330 | 1.1120 | 1.1010 |
| 1.1260 | 1.1450 | 1.1010 | 1.0860 |
USD/JPY
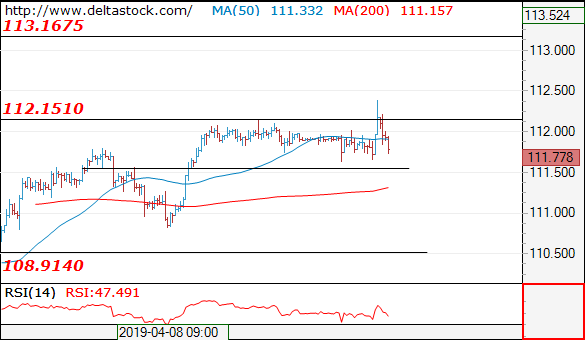
Current level - 111.77
The brief spike through 112.15 was followed by a return below the weekly resistance and current bias is neutral. Key support lies at 111.50.
| Resistance | Support | ||
| intraday | intraweek | intraday | intraweek |
| 112.15 | 113.20 | 111.50 | 108.90 |
| 113.20 | 114.50 | 110.50 | 107.40 |
GBP/USD
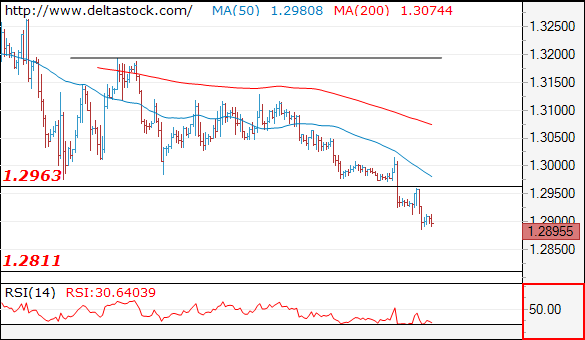
Current level - 1.2895
The downtrend is intact below 1.2960, for a slide towards 1.2810 area.
| Resistance | Support | ||
| intraday | intraweek | intraday | intraweek |
| 1.2960 | 1.3450 | 1.2810 | 1.2810 |
| 1.3015 | 1.3450 | 1.2810 | 1.2610 |
The US Dollar Index Has Updated Annual Highs
The US dollar has continued to strengthen against a basket of major currencies. The dollar index (#DX) set new annual highs and closed in the positive zone (+0.55%). Weak statistics from Germany hit the euro. Thus, the German IFO business climate index fell to 99.2, while experts expected the figure at 99.9. The Bank of Canada left its key interest rate unchanged at 1.75%, as investors forecasted. The regulator has lowered the forecast for economic growth in the country this year.
Today, the Bank of Japan, as expected, has left the key marks of monetary policy unchanged. The Central Bank intends to keep interest rates at a low level at least until the end of spring 2020.
Meanwhile, the first minister of Scotland, Nicola Sturgeon, wants the country to become an independent state after Brexit. The official intends to hold a second Scottish independence referendum if the UK leaves the EU. In September 2014, an independence referendum was already held in Scotland. However, 55.3% of Scots voted against Scotland’s exit from the UK.
Prices for Brent and West Texas Intermediate crude oil have surged in price after the United States announced its intention to return sanctions on Iran’s oil importers. However, yesterday the US authorities reported that despite the difficult situation in the global market, it is well supplied enough to avoid price glitches. US President Donald Trump is confident that Saudi Arabia and the United Arab Emirates will compensate for the shortage in the oil market. At the moment, futures for the WTI crude oil are testing the mark of $66.10 per barrel.
Market Indicators
- Yesterday, the bearish sentiment was observed in the US stock market: #SPY (-0.22%), #DIA (-0.21%), #QQQ (-0.32%).
- The 10-year US government bonds yield fell again. Currently, the indicator is at the level of 2.52-2.53%.
The news feed for 2019.04.25:
- Core durable goods orders in the US at 15:30 (GMT+3:00);
- Initial jobless claims in the US at 15:30 (GMT+3:00).
EUR/JPY Decline Continues
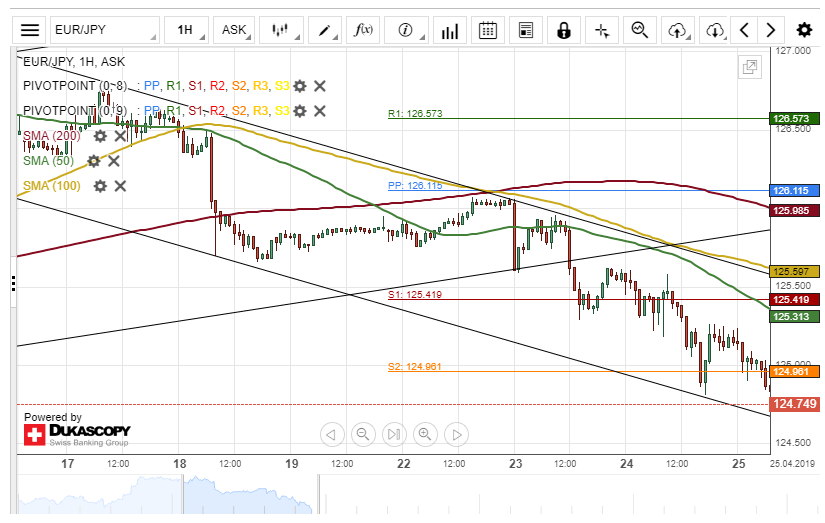
The common European currency has continued its decline against the Japanese Yen. The currency pair depreciated about 79 base points during Wednesday's trading session.
Given that the 50-, 100– and 200-hour SMAs are above the price level, most likely, the currency exchange rate will continue its decline within this session. The pair could aim for the weekly S3 at 124.26.
Although, it is expected that the EUR/JPY pair makes a pullback towards a resistance cluster formed by the 50-hour simple moving average and the weekly S1 at 125.41 today.
AUD/USD Set For Breakout
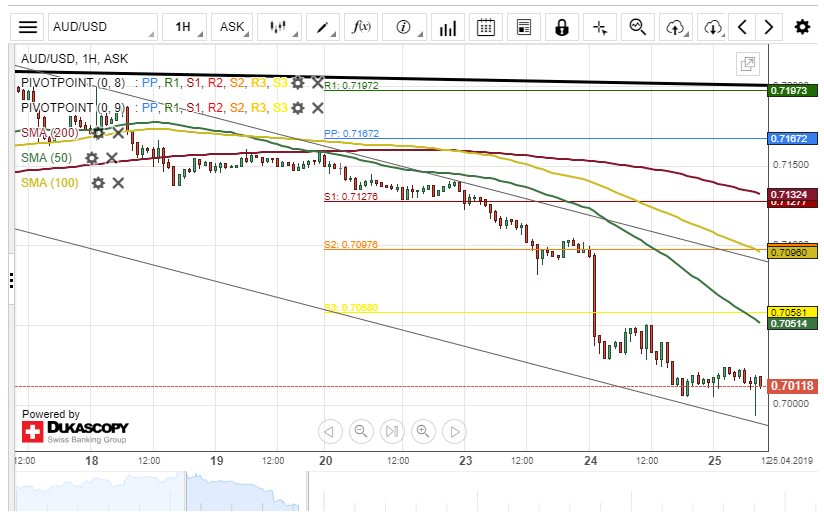
The decline of the Australian Dollar versus the US Dollar continued during Wednesday's trading session. The currency pair depreciated about 99 base points on Wednesday.
The exchange rate is currently trading near the lower boundary of a descending channel pattern at 0.7017 and could be set for a breakout.
If the breakout occurs, the AUD/USD pair will end this week's trading session on a bear market.
However, if the descending channel pattern holds, a surge towards a resistance cluster formed by the50-hour SMA and the weekly S3 at 0.7057 might follow.
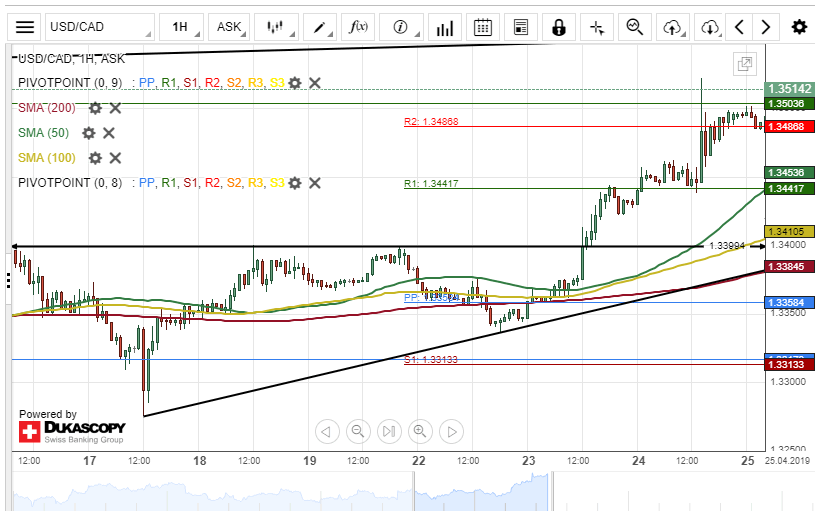
USD/CAD Surges On
The US Dollar continued its upside movement against the Canadian Dollar on Wednesday. The currency pair ended yesterday's trading session with a 98 base points gain.
The exchange rate was trading below the monthly resistance level at 1.3486 during the first part of Thursday's trading session.
If the monthly R3 at 1.3503 holds, a decline towards a support level at 1.3399 could be expected within this session.
On the other hand, if the pair passes the monthly R3, the next target for bullish traders will be at the upper boundary of a long-term ascending channel at 1.3532
NZD/USD Sell Signals Today
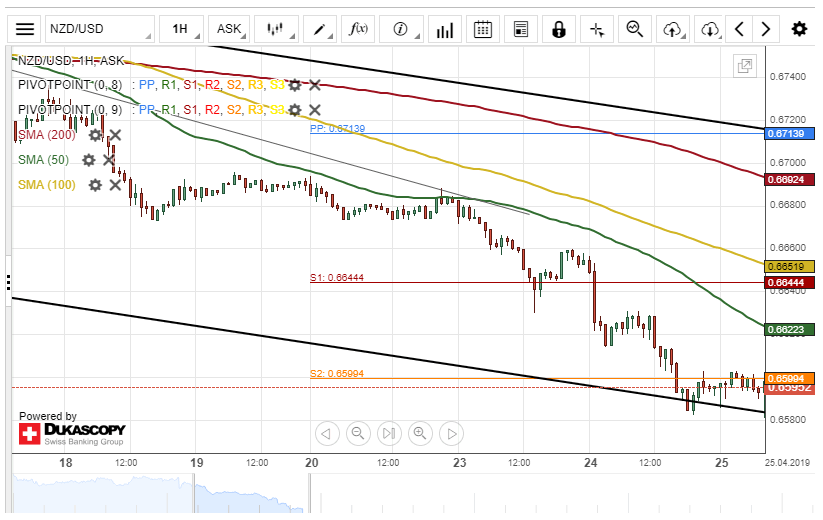
The 50-hour simple moving average pressured the New Zealand Dollar lower against the US Dollar on Wednesday. The currency pair depreciated about 75 base points during yesterday's trading session.
The Kiwi is currently trading near the lower band of a descending channel at 0.6592 and could be set for a breakout.
Technical indicators all pointed out that the currency exchange rate will continue its decline during the following trading session.
However, if the channel pattern holds, a surge towards the 50-hour SMA resistance level could be expected today.
EUR/USD Renewed 2018/2019 Minimum
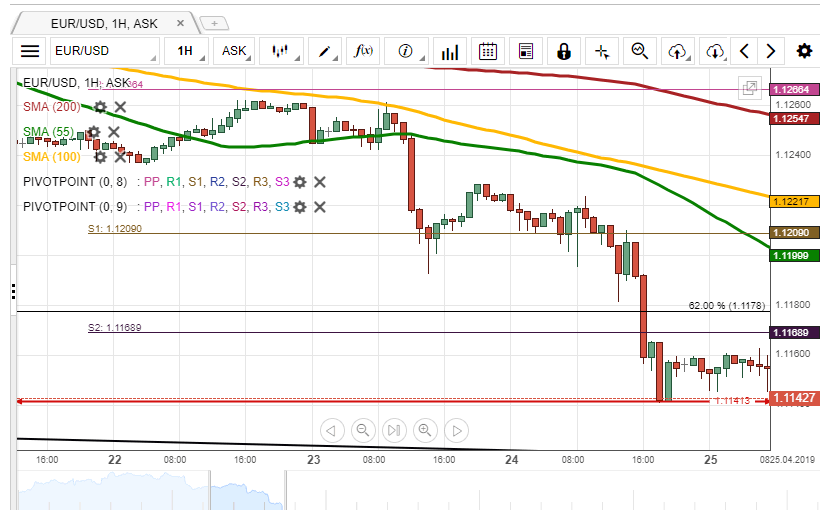
Yesterday, the EUR/USD currency pair renewed the 2018/2019 minimum located at 1.1141.
Given that the pair is still pressured by the 55– and 100-hour SMAs, currently located circa 1.1220, it is expected, that bears could continue to prevail in the market. The nearest downside target is the lower boundary of the medium-term channel located circa 1.1120.
However, if the given minimum holds, it is likely, that the exchange rate tries to reverse north. In this case, the rate would have to surpass the resistance level formed by the weekly S2 and the Fibonacci 62.00% retracement at 1.1178.
GBP/USD Could Maintain Its Decline
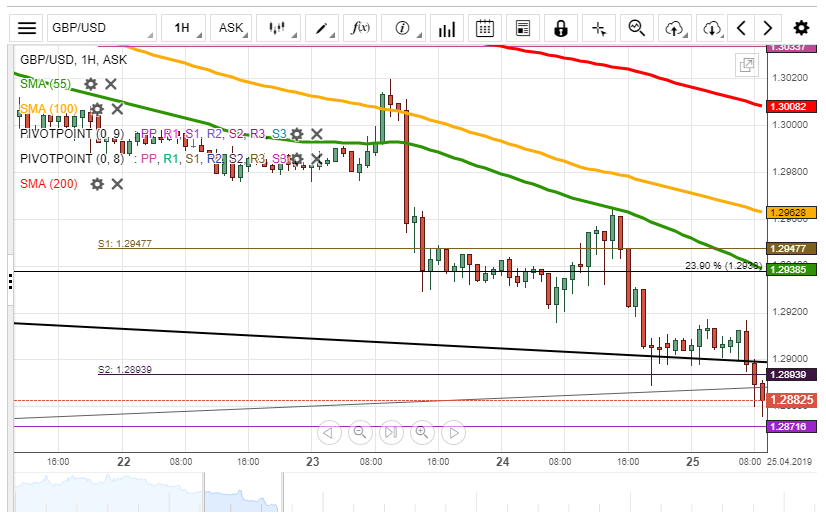
During previous trading session, the GBP/USD exchange rate declined to the weekly S2 at 1.2894. During Thursday's morning, the rate tried to surpass the given support.
If the given support holds, the currency pair reverses north. However, it is unlikely, that the pair could rise higher than the 1.2938/1.2964 range due to the resistance cluster formed by the 55– and 100-hour SMAs, as well the Fibo 23.90% and the weekly S1.
If the given support level does not hold, it is expected, that the rate maintains its decline. The nearest support might be the monthly S1 located at the 1.2872 mark.