Sample Category Title
EUR/USD Remains At Risk Of More Losses
Key Highlights
- The Euro declined this past week and broke the 1.1250 support against the US Dollar.
- EUR/USD is following a bearish trend line with resistance at 1.1235 on the 4-hours chart.
- The US Nonfarm Payrolls in March 2019 increased 196K, better than the 180K forecast.
- The US Factory Orders in Feb 2019 might decline around 0.6% (MoM).
EURUSD Technical Analysis
The Euro started a significant decline from well above the 1.1380 support against the US Dollar. The EUR/USD pair declined below the 1.1350 and 1.1250 support levels to move into a downtrend.
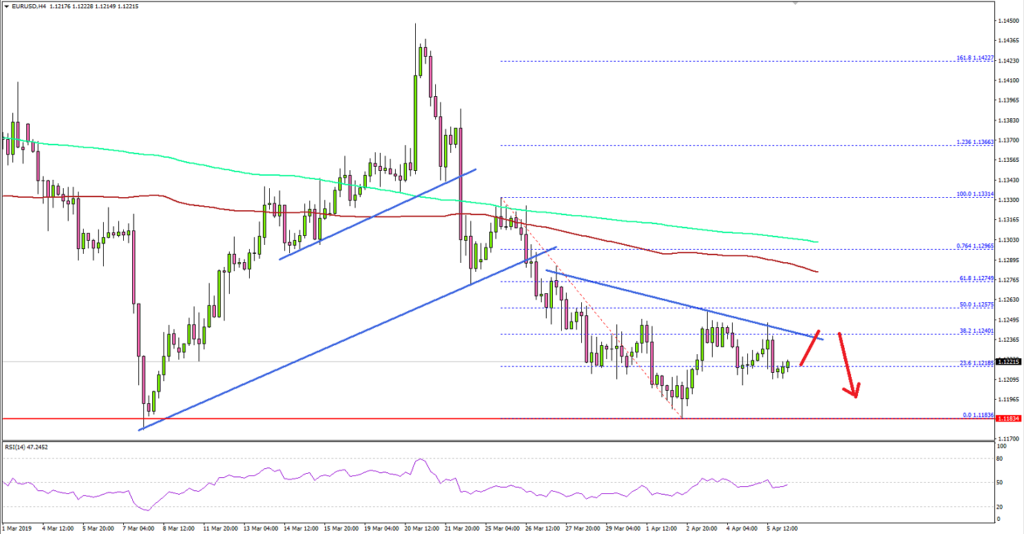
Looking at the 4-hours chart, the pair broke many supports recently near the 1.1300, 1.1250 and 1.1240 levels. There was even a close below the 1.1250 support, the 100 simple moving average (4-hours, red), and the 200 simple moving average (4-hours, green).
The pair traded close to the 1.1180 support and later started an upside correction. There was a break above the 23.6% Fib retracement level of the last decline from the 1.1331 high to 1.1183 low.
However, the recent rise faced a strong resistance near the 1.1250 level plus the 50% Fib retracement level of the last decline from the 1.1331 high to 1.1183 low. There is also a bearish trend line in place with resistance at 1.1235 on the same chart.
Therefore, a clear break above 1.1235 and 1.1250 is must for a decent recovery towards 1.1300 in the near term. If not, EUR/USD is likely to decline further towards 1.1180 or 1.1150.
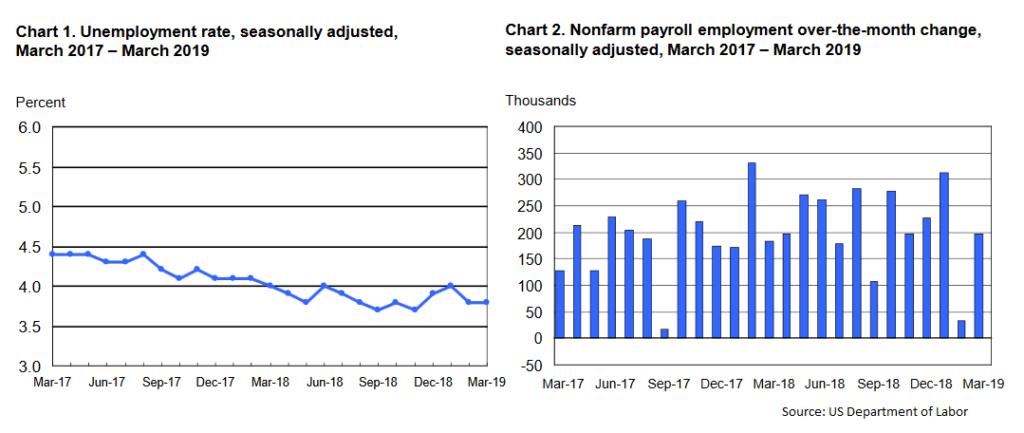
Fundamentally, the US Nonfarm Payrolls report for March 2019 was released by the US Department of Labor. The market was looking for a solid increase of 180K, a lot more than the last 20K.
The actual result was better than the forecast, as the total Nonfarm Payrolls employment increased by 196K in March 2019. Besides, the last reading was revised up from 20K to 32K. The US unemployment rate remained stable at 3.8%.
The report added:
The labor force participation rate, at 63.0 percent, was little changed over the month and has shown little movement on net over the past 12 months. The employment-population ratio was 60.6 percent in March and has been either 60.6 percent or 60.7 percent since October 2018.
Overall, EUR/USD and GBP/USD are trading in a bearish zone and remains at a risk of more losses if the US Dollar bulls remain in action in the near term.
Economic Releases to Watch Today
- Germany’s Trade Balance for Feb 2019 – Forecast €17.0B, versus €18.5B previous.
- US Factory Orders Feb 2019 (MoM) – Forecast -0.6%, versus +0.1% previous.
Forex Forecast And Cryptocurrencies Forecast
First, a review of last week's events:
EUR/USD. The vast majority of analysts (75%), supported by 100% of trend indicators and 90% of oscillators, said last week that if the pair overcomes the support level of 1.1200, it will be able to continue moving down. The closest goal is the low of 2018-19, recorded on March 7, 1.1175. At the same time, graphical analysis on D1 stated that the pair would not be able to overcome this support and would return to the horizon 1.1340.
This is what in fact happened. True, the amplitude of oscillations was less than expected: the weekly low was fixed at 1.1183, and the high at 1.1254. As a result, the pair demonstrated the classic sideways trend. Traders even ignored the positive US dollar report on the US labor market, released on Friday, April 5, and the pair completed the working week at 1.1215;
GBP/USD. The behavior of the pair is still dependent on the news of developing political and economic operation called Brexit. News from the “battlefield” - from the Parliament of Great Britain - initially pushed the pound up, since Teresa May promised to hold successful negotiations with the opposition leaders. Investors began to actively buy pounds, and, as predicted by graphical analysis, it quickly reached the center of the five-week side corridor 1.2960-1.3350 at the level of 1.3150. But the first round of negotiations ended in failure, and investment funds began to close positions on the pound. At the same time, the negative background was supplemented by the news from the European Parliament, which mockingly rubs its hands, watching the rift of the British colleagues. As a result, the trend for this pair changed every two days and, having experienced a series of ups and downs, it put the final point almost at the same place as a week ago, at around 1.3035;
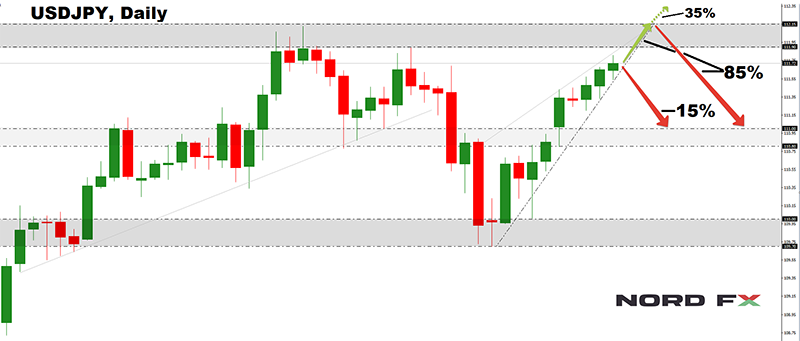
USD/JPY. Recall that at the beginning of the week the pair was practically in the center of the channel 109.70-112.15. And the question was whether it would go down or up. Although only 35% of the experts voted for its growth, declarations of Donald Trump on the successful course of the US and China trade negotiations, and the growth of the US stock market moved the pair up. Having reached a high at 111.80 on Friday, April 5, after a small pullback, the pair completed the five-day week 10 points lower;
Cryptocurrencies. Our forecast last week said that the bitcoin would be able to overcome the resistance of $4,200 and gain a foothold in the range of $4,200-4,280. But on Tuesday, April 2, the reference cryptocurrency made an unexpected jump and, soaring by 14.4%, broke the bar of $5,000. This movement was the strongest jump since the boom of the end of 2017.
Traders are wondering what is behind this surge, a variety of versions has been expressed. The version voiced by Oliver von Landsberg-Sadie, the head of the BCB Group, in an interview with Reuters, seems most likely. He said that the bitcoin price jump was caused by just one investor, who distributed bids for the purchase of BTC for $100 million on three major exchanges - Coinbase, Kraken and Bitstamp. The total volume of transactions then amounted to about 20.000 BTC, and the total capitalization of the crypto market exceeded $170 billion
As for the forecast for the coming week, summarizing the opinions of a number of analysts, as well as forecasts made on the basis of a variety of methods of technical and graphical analysis, we can say the following:
EUR/USD. On Wednesday, April 10, we are waiting for the next ECB interest rate decision. Most likely, it will remain unchanged. But it became known that the European regulator is actively discussing options for more aggressive stimulation of the economy. This can be either a reduction in rates or an increase in the QE quantitative easing program. This news contributes to the growth of investor interest in shares of European companies and to a fall in interest in the European currency. Also, on Wednesday the meeting of the US Federal Reserve Committee minutes will be published, which should shed light on the further monetary policy of the American regulator.
For the nearest future, the strongest factor putting pressure on the euro, of course, is the tiresome mess with Brexit. Perhaps that is why 60% of the experts, supported by 100% of the indicators and 80% of the oscillators on D1, have voted for a further decline of the pair. The immediate goal is the low of 07 March 2019, 1.1175, the next support was recorded in the summer of 2017. and is located 60 points lower. 40% of analysts preferred the bulls. Moreover, it is already 20% of oscillators on D1 that give signals the pair is oversold. In their opinion, having pushed off support in the 1.1200 zone, the pair will go up to resistance 1.1255 and, in case of a breakthrough, move to the height of 1.1300. The next resistance is 1.1345.
GBP/USD. Interestingly, if most experts believe that Brexit will continue to have a negative impact on the euro, the opinion on the pound is opposite. 65% of analysts expect the upcoming week to strengthen the British currency. Their forecast is based on the fact that the extraordinary meeting of the European Council on April 10 will support the extension of the Brexit procedure for a long time and that the UK's withdrawal from the EU without a deal on April 12 will not take place. the graphical analysis on D1 is also in solidarity with such a forecast, indicating that the pair is growing, first to the zone of 1.3120, and then to resistances of 1.3200 and 1.3265. A fall of the pair is expected by 35% of analysts and 90% of indicators. At the same time, 10% of oscillators are already signaling that the pair is oversold, which indicates the traders' doubts about the future of this pair. Support levels are 1.2975, 1.2900 and 1.2830;
USD/JPY. Over the past two weeks, the pair has gone from the bottom of the medium-term channel 109.70-112.15 almost to its upper limit, ending the week at 111.70. And 85% of experts are sure that it will definitely test the resistance of 112.15. But those who believe that the pair will be able to rise even higher and reach the level of 113.00, are only 35%. So, the probability that the pair will not go beyond the upper limit of this channel is large enough. 25% of oscillators on D1, which are already in the overbought zone, agree with this. The basic support is Pivot Point of the channel 110.80;
Cryptocurrencies. An unexpected bitcoin jump spawned a whole wave of all sorts of events and rumors. Thus, the mysterious creator of Bitcoin Satoshi Nakamoto has reappeared from oblivion. He has re-activated a Bitcointalk account that has been inactive for many years. Over the past 10 years, the identity of Satoshi has not been disclosed, although there are various assumptions about who may be hiding under this mask. Thus, a group of hackers who have hacked several large crypto-exchanges, believes that he is American entrepreneur, inventor and engineer Ilon Musk. In their opinion, the largest transactions with cryptocurrencies (possibly the last one for $100 million as well) were carried out from the Bel Air neighborhood in Los Angeles. And it is there that the legendary founder of SpaceX and Tesla has been living for many years.
As for the forecast, 70% of analysts believe that the main fluctuations of the BTC/USD pair in the coming week will occur in the range of $5,000-5,500. However, the remaining 30% are confident that a one-time purchase of bitcoins by one investor, even for $100 million, is not a sufficient reason to start a steady bull trend. And so the pair has a lot of chances to go below $4,800 horizon. In this case, the main level of resistance is the $5,100 horizon.
Daily Markets Broadcast
Wall Street extends gains on payrolls beat
The US economy added more jobs than expected in March, which helped push the US30 index to six month highs. Trump blamed the Fed for slowing the US economy, called for rate cuts. Oil supply concerns out of Libya pushed oil prices higher.
US30USD Daily Chart
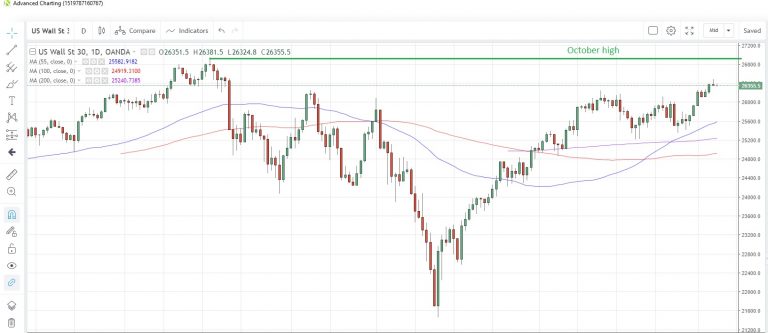
The US30 index pushed to its highest since October 10 on Friday after US payrolls came in above forecast
The next possible resistance point could be the October 2018 high of 26,940
March nonfarm payrolls rose by 196,000, beating economists estimates of a 180,000 gain. Unemployment held steady at 3.8% though average hourly earnings rose 3.2% y/y, less than expected. Today’s calendar only has February factory orders on tap, which are seen falling 0.6% m/m.
DE30EUR Daily Chart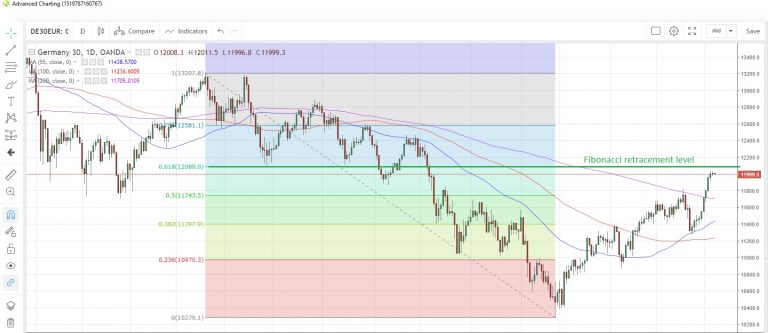
The Germany30 index climbed for a tenth consecutive day on Friday, buoyed by the enthusiasm on Wall Street
The index failed to match the six-month high seen on Thursday, but the 10-day rising streak was the longest since April-May 2013. The 61.8% Fibonacci retracement of the May-December drop is at 12,089
German trade data for February are due today, with the surplus seen narrowing to EUR17 billion from EUR18.5 billion in January, the latest survey shows.
WTICOUSD Daily Chart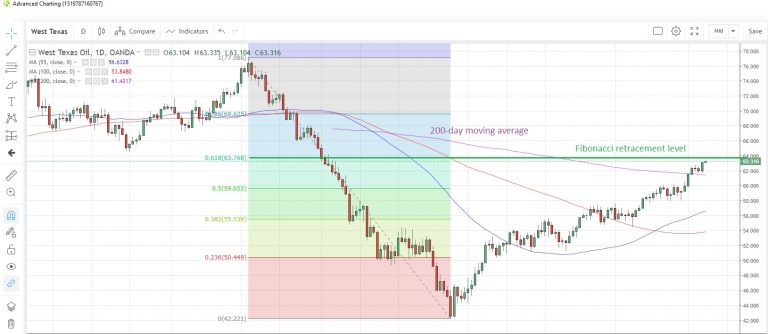
WTI snapped a two-day losing streak on Friday amid concerns about supply disruptions out of Libya. Prices have pushed higher this morning to hit the highest since November 6
Prices are nearing the Fibonacci resistance at 63.768, which is 61.8% retracement of the October-December drop. The 200-day moving average offers support at 61.422
The index measuring the number of US oil drilling rigs in production surged to 831 last week from 816 the previous week. That’s the first increase in seven weeks.
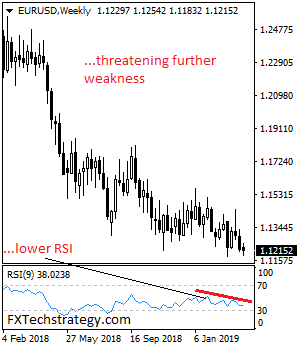
EURUSD Faces Further Bearishness Towards Key Support
EURUSD faces further bearishness towards its key support. Support comes in at the 1.1200 where a violation will turn risk to the 1.1150 level. A break below here will target the 1.1100 level. Further down, support sits at the 1.1050. Its weekly RSI is bearish and pointing lower suggesting more weakness. Conversely, on the upside, resistance resides at 1.1250 level with a break through there opening the door for further upside towards the 1.1.1300 level. Further up, resistance comes in at the 1.1350 level where a violation will expose the 1.1400 level. All in all, EURUSD faces further bearishness on price decline
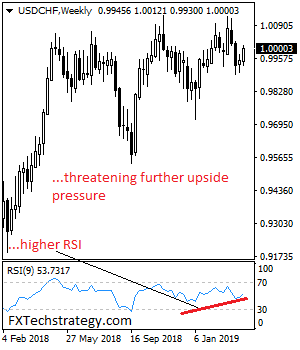
USDCHF Continues To Eye Higher Prices
USDCHF continues to eye higher prices following its bullish close the past week. Resistance stands at the 1.0050 level. A break of there will clear the way for a run at the 1.0100 level. Above here, resistance lies at the 1.0050 level and then the 1.0150 level. Its daily RSI is bullish and pointing higher suggesting further strength. On the downside, support is seen at the 0.9950 level. A turn below here will set the stage for more decline towards the 0.9900 level. And then the 0.9850 level. Further down, support resides at the 0.9800 level. All in all, USDCHF continues to eye higher prices as more gain is expected.
Eco Data 4/8/19
[php_everywhere instance="1"]
CFTC Commitments of Traders -Traders Turned More Bullish on USD as Other Currencies Fared Worse
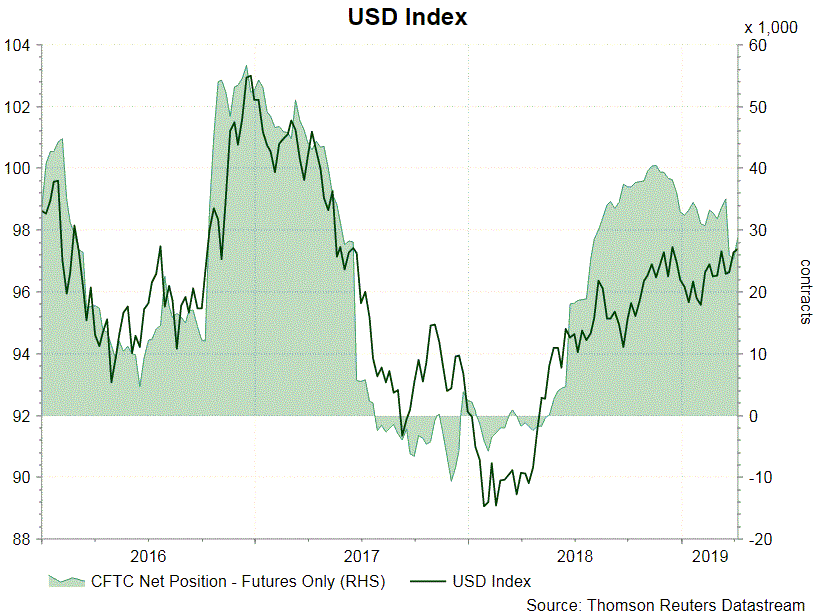
As suggested in the CFTC Commitments of Traders report in the week ended April 2, NET LENGTH in USD Index increased +3 563 contracts to 28 848. Both speculative long and short positions rose but the former outweighed the latter. All other major currencies stayed in NET SHORT positions. 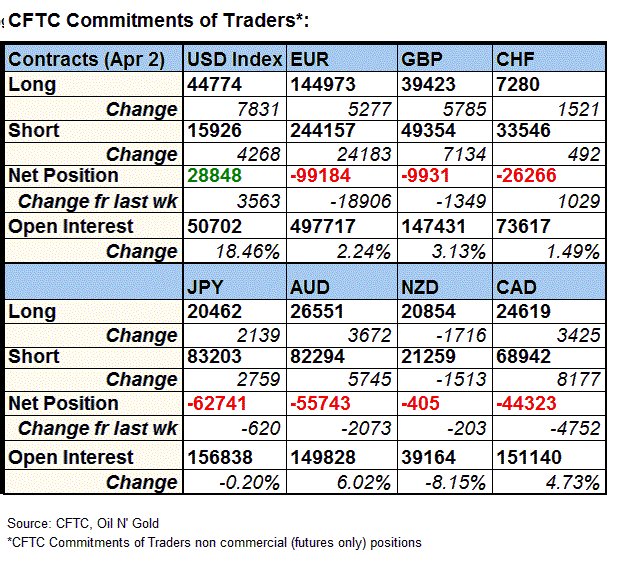
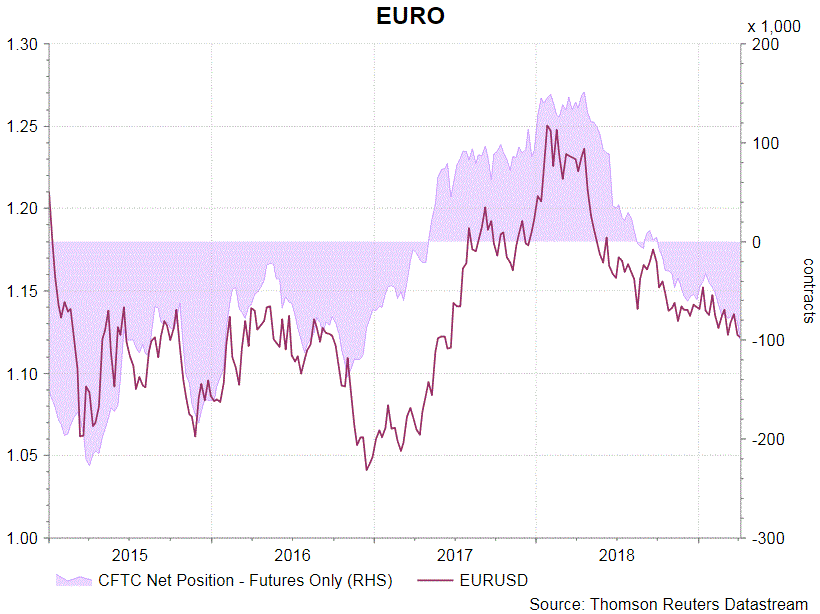
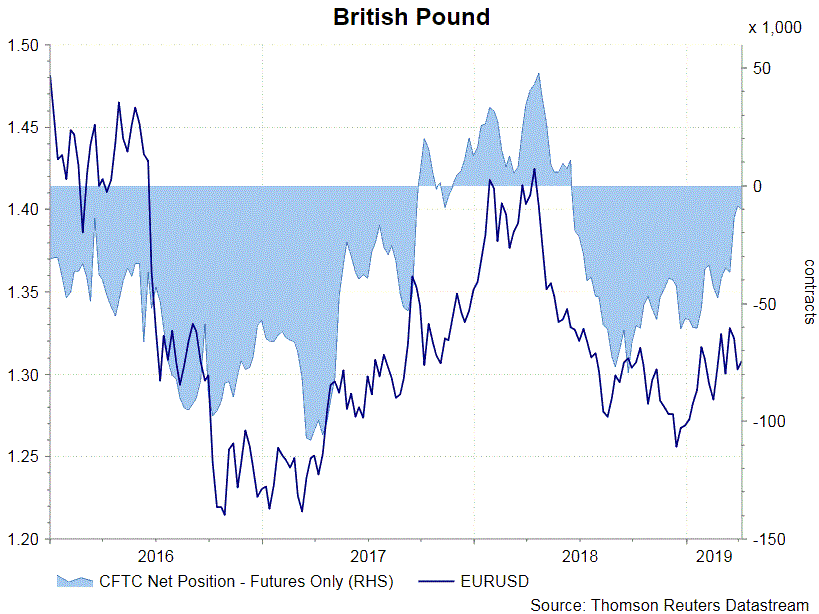
Concerning European currencies, NET SHORT for euro futures jumped +18 906 contracts to 99 184. Bets were increased in both sides but the gain in long bets outweigh that in shorts. NET SHORT for GBP futures rose +1 349 contracts to 9 931. Speculative long positions gained +5 785 contracts while speculative shorts sored +7 134 contracts for the week.
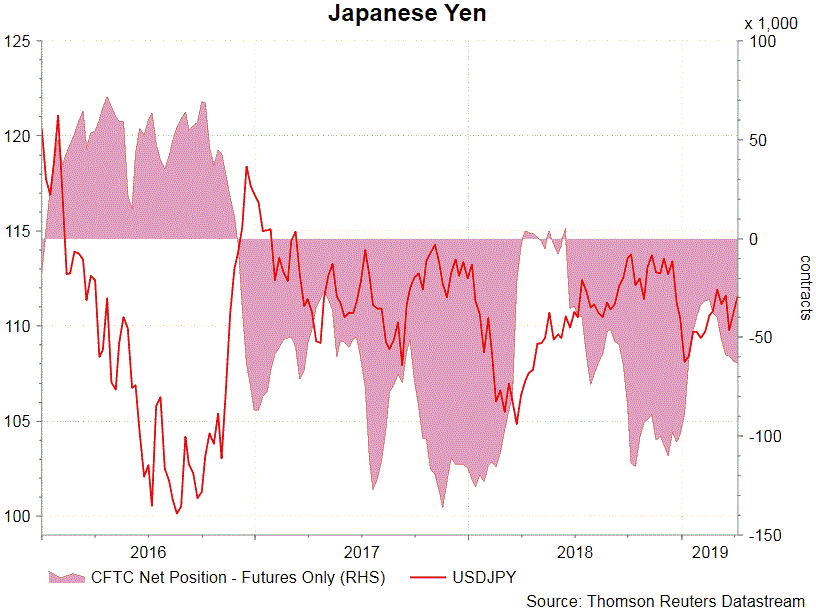
On safe-haven currencies, Net SHORT for CHF futures fell -1 029 contracts to 26 266. NET SHORT for JPY futures added +620 contracts to 62 741 during the week. Bets gained on both sides. 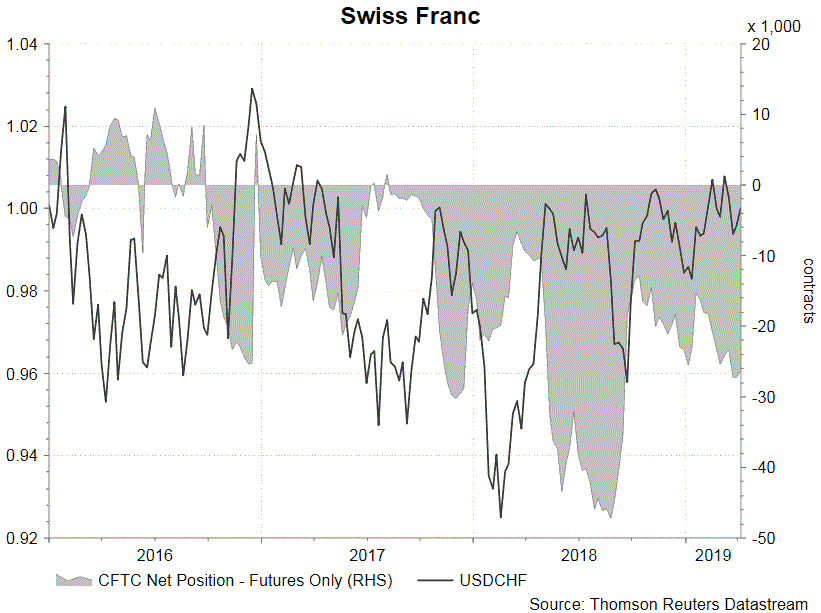
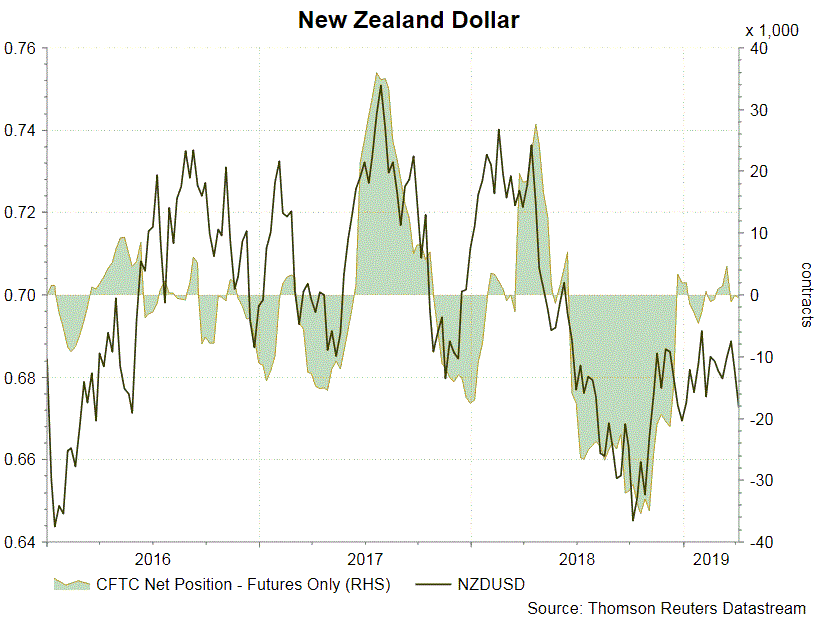
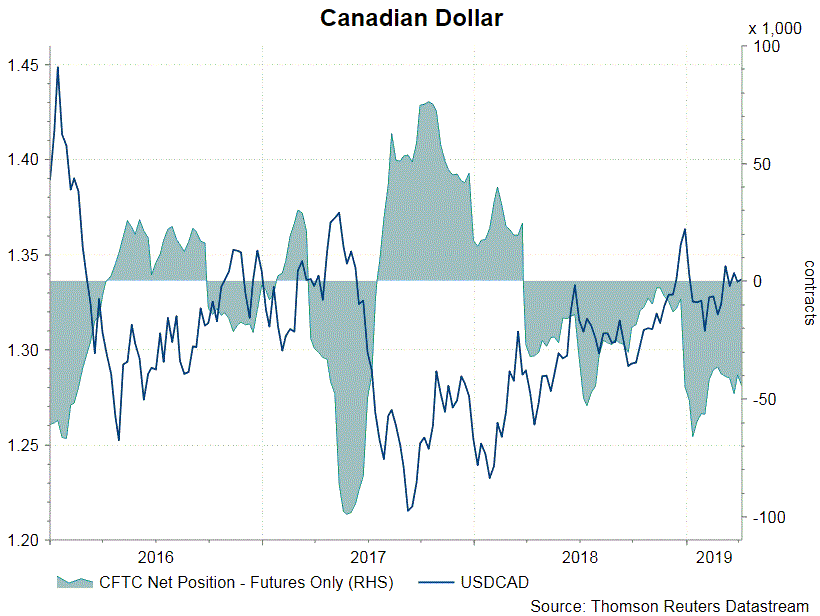
On commodity currencies . NET SHORT for AUD futures rose +2 073 contracts to 55 743. Speculative long positions added +3 672 contracts while shorts gained +5 745 contracts. NET SHORT for NZD increased +2 03 contracts last week, with both speculative long and shorts position decreased last week. NET SHORT for CAD futures rose +4 752 contracts to 44 323.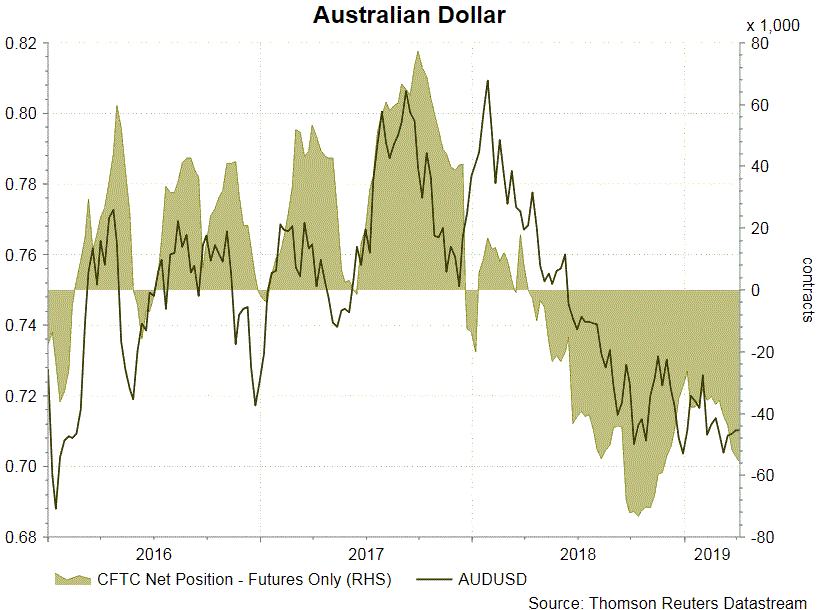
CFTC Commitments of Traders – Traders Increased Bets on Higher Crude Oil Prices, and Trimmed Long Bets for Gold
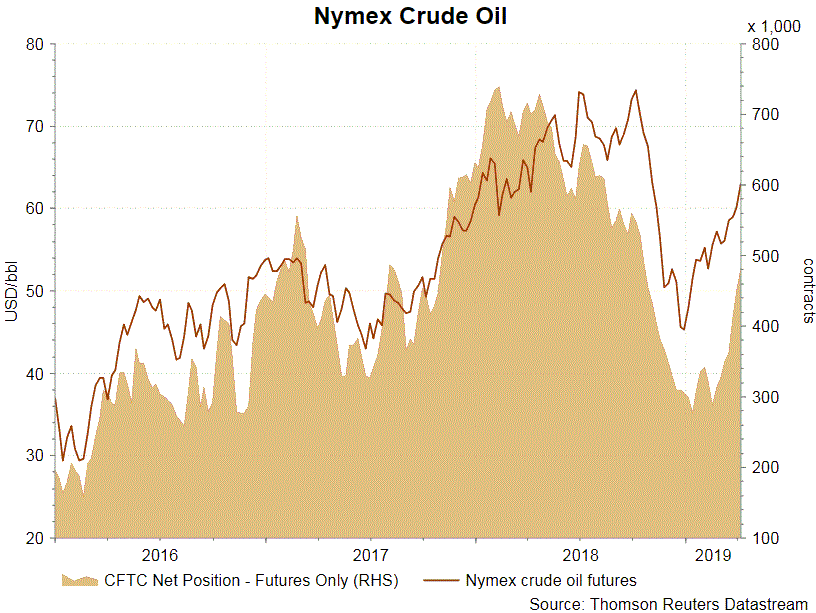
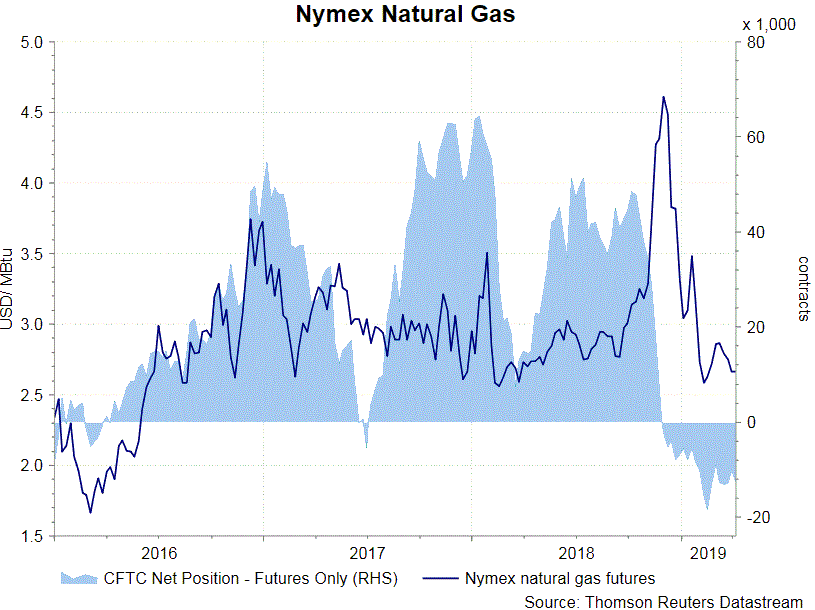
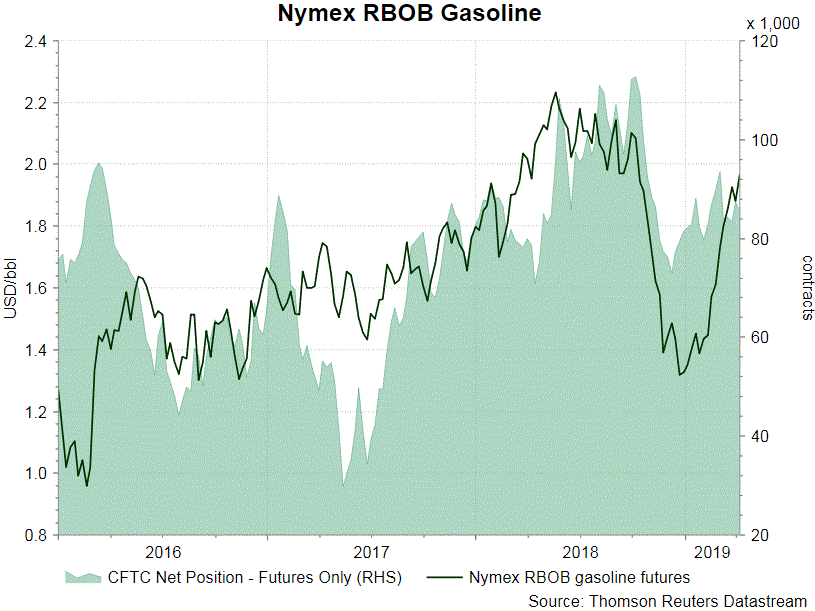
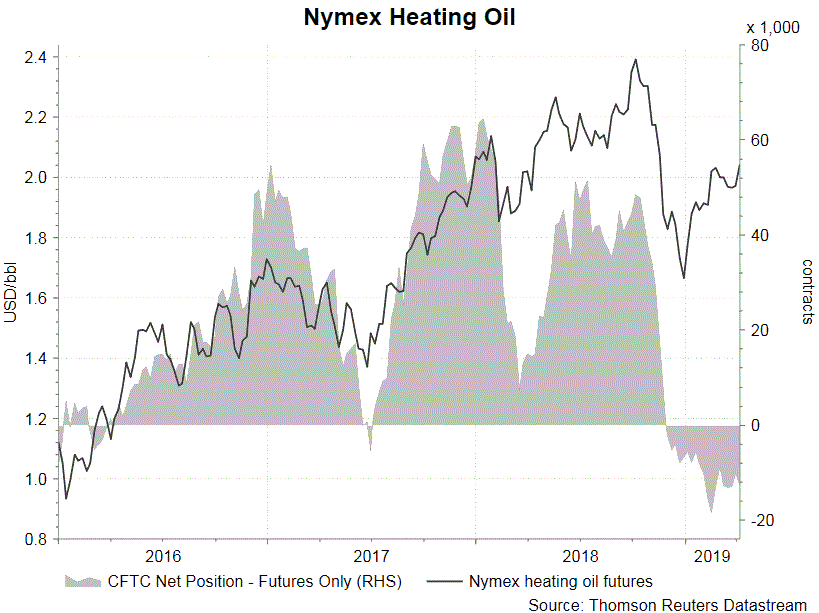
According to the CFTC Commitments of Traders report for the week ended April 2, NET LENGTH for crude oil futures jumped +32 742 contracts to 481 361 for the week. Speculative long positions rose +29 760 contracts while shorts dropped -2 982. Traders remained bullish as crude oil price extended the rally for another week. For refined oil products, NET LENGTH for gasoline declined -1 969 contracts to 85 430, while NET SHORT for heating oil increased +2 288 contracts to 12 490 contracts for the week. NET SHORT for natural gas futures fell -3 904 contracts to 19 042 contracts for the week.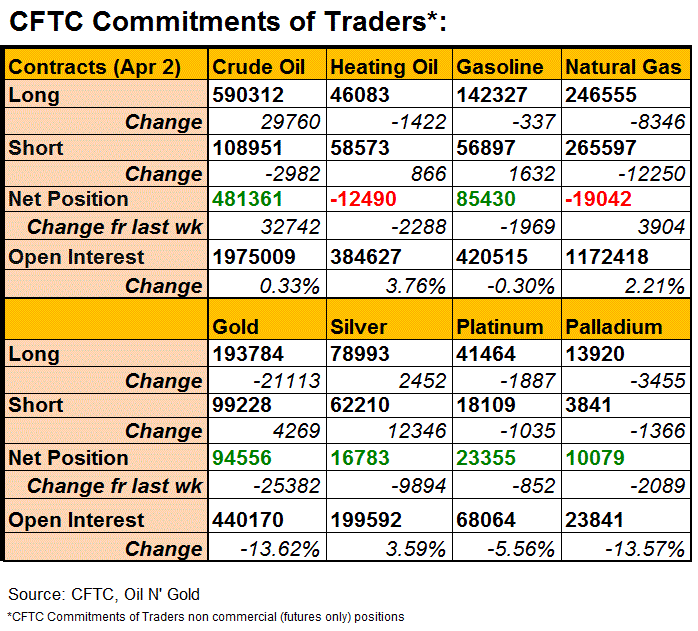
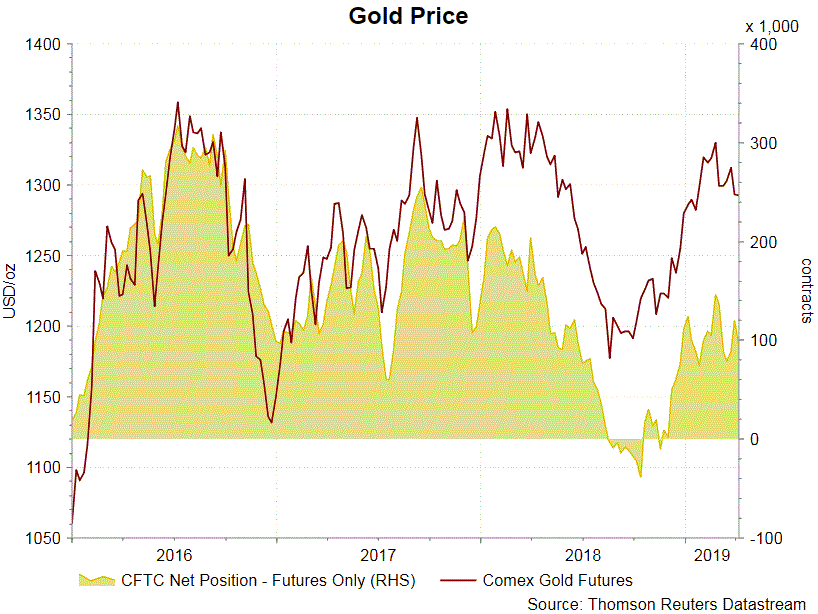
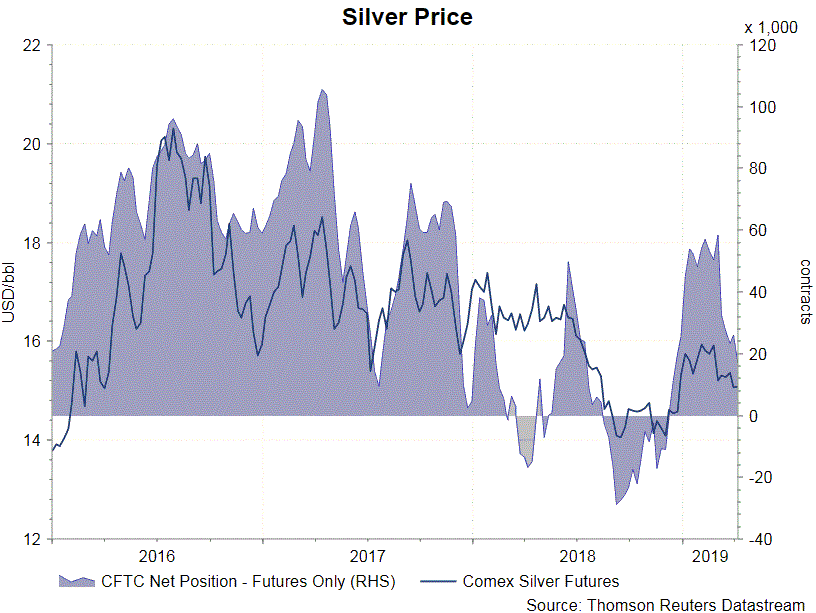
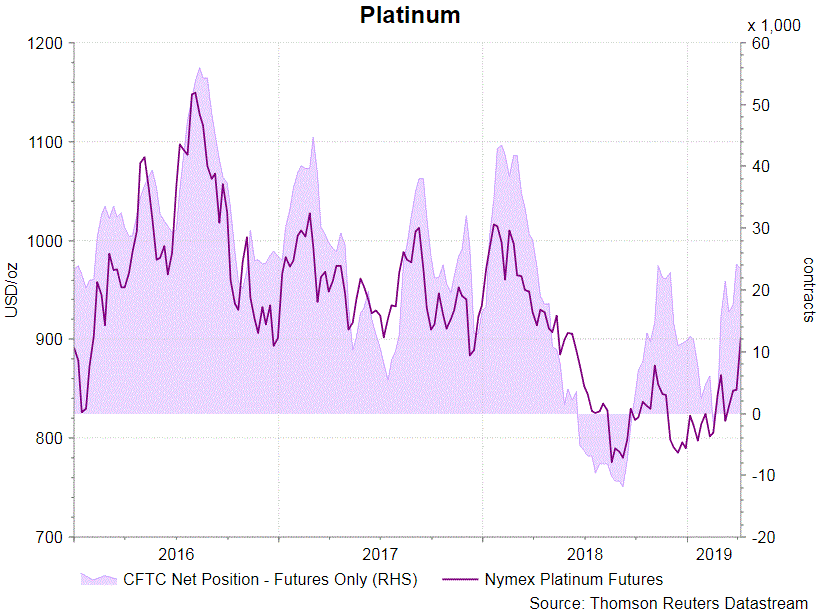
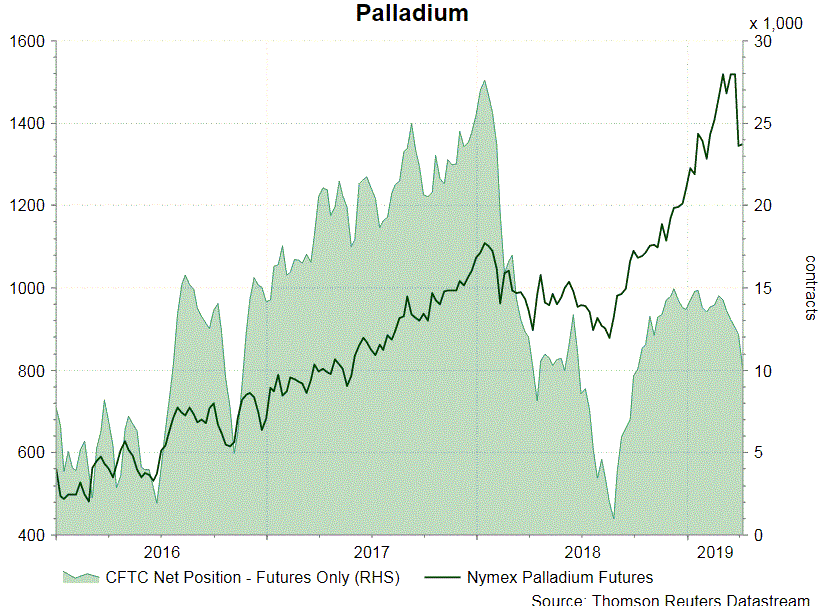
On the precious metal complex, NET LENGTH for gold futures fell -25 382 contracts, to 94 556 last week. Speculative long positions slumped -21 113 contracts, while shorts added +4 269, resulting in a decline in NET LENGTH. Gold price weakened during the week as US Treasury yields climbed higher and flattening of yield curve alleviate concerns over recession for now. For silver futures, speculative long positions added +2 452 contracts while shorts jumped +12 346. These resulted in a fall in NET LENGTH, by -9 894 contracts, to 16 783 contracts. For PGMs, NET LENGTH of Nymex platinum futures decreased -852 contracts to 23 355 while that for palladium declined -2 089 contracts to 10 078.
EUR/USD Weekly Outlook
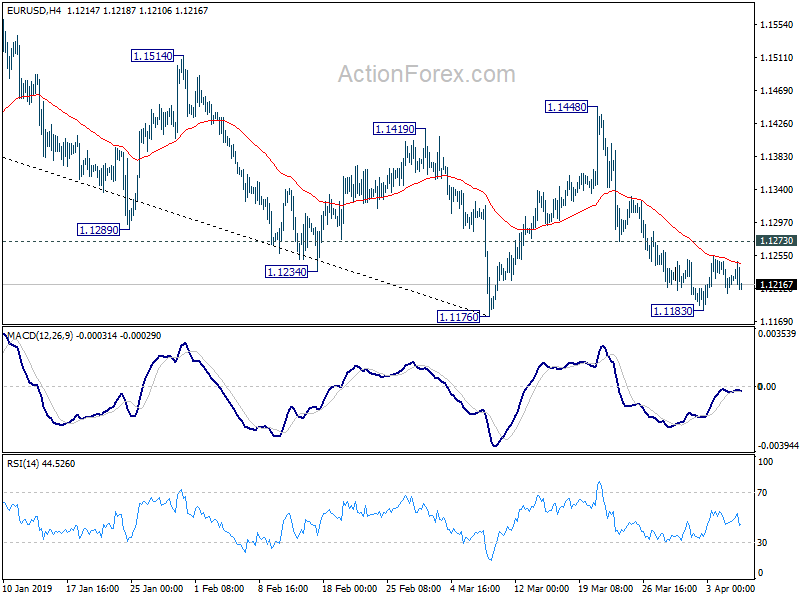
EUR/USD edged lower to 1.1183 but recovered ahead of 1.1176 low. Initial bias remains neutral this week for some more consolidation first. As long as 1.1273 minor resistance holds, further decline is in favor. On the downside, decisive break of 1.1176 will resume the down trend from 1.2555. On the upside, however, break of 1.1273 support turned resistance will indicate short term bottoming. Intraday bias will be turned back to the upside for 1.1448 resistance instead.
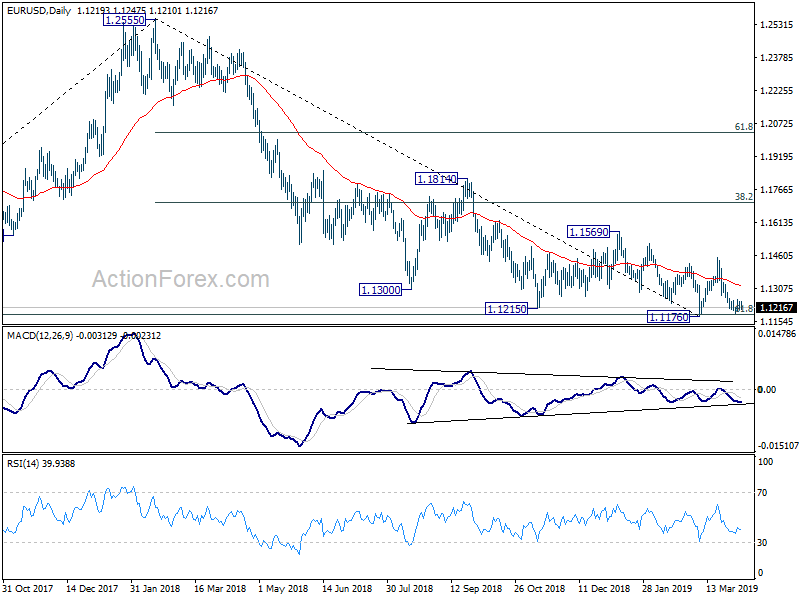
In the bigger picture, medium term weakness was revived as the weak rebound from 1.1176 was rejected well below 55 week EMA and failed to sustain above 55 day EMA. Focus is back on 1.1176 low, with 61.8% retracement of 1.0339 (2016 low) to 1.2555 (2018 high) at 1.1186. Decisive break there will resume whole down trend from 1.2555. Such decline target 1.0339 low next. On the upside, firm break of 1.1569 resistance is needed to be the first sign of medium term bottoming. Otherwise, downside breakout will be in favor.
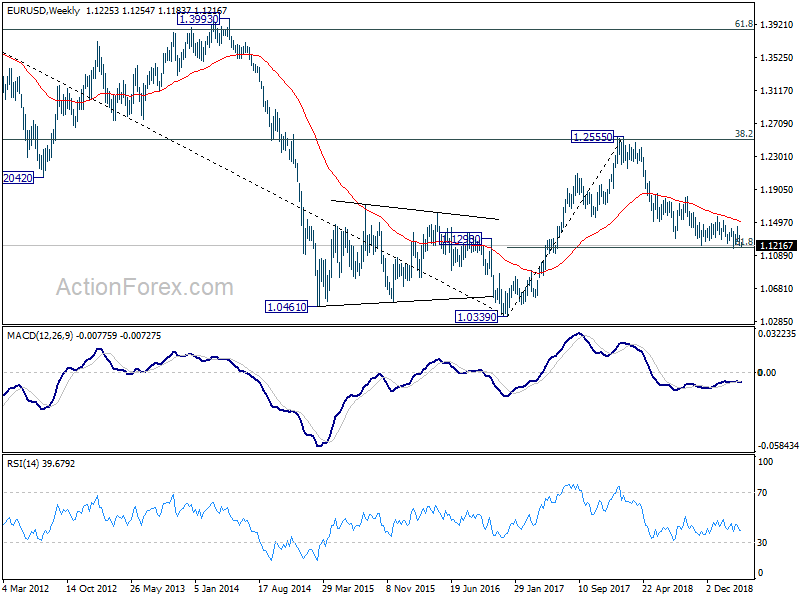
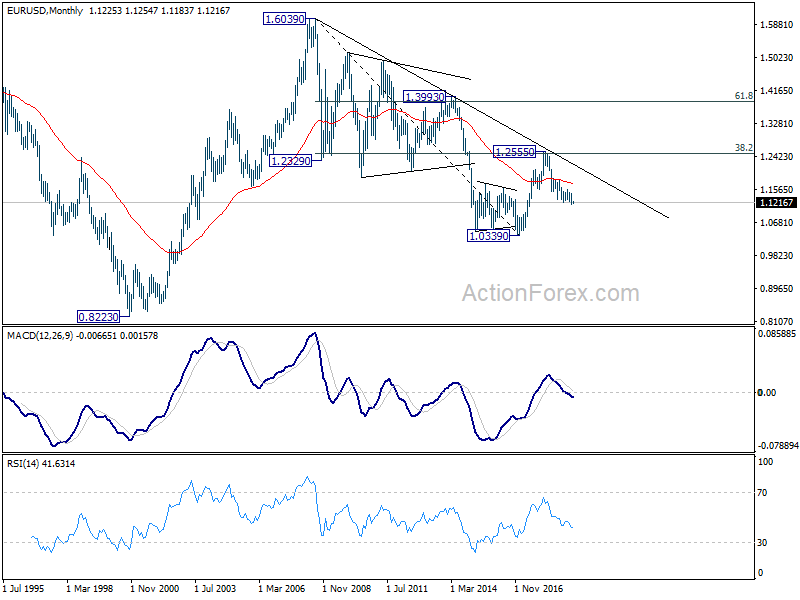
In the long term picture, the rejection from 38.2% retracement of 1.6039 to 1.0339 at 1.2516 argues that long term down trend from 1.6039 (2008 high) might not be over yet. EUR/USD is also held below decade long trend line resistance. Firm break of 61.8% retracement of 1.0339 to 1.2555 at 1.1186 should at least bring a retest on 1.0339 low. This will remain the favored case as long as 1.1569 resistance holds.
USD/JPY Weekly Outlook
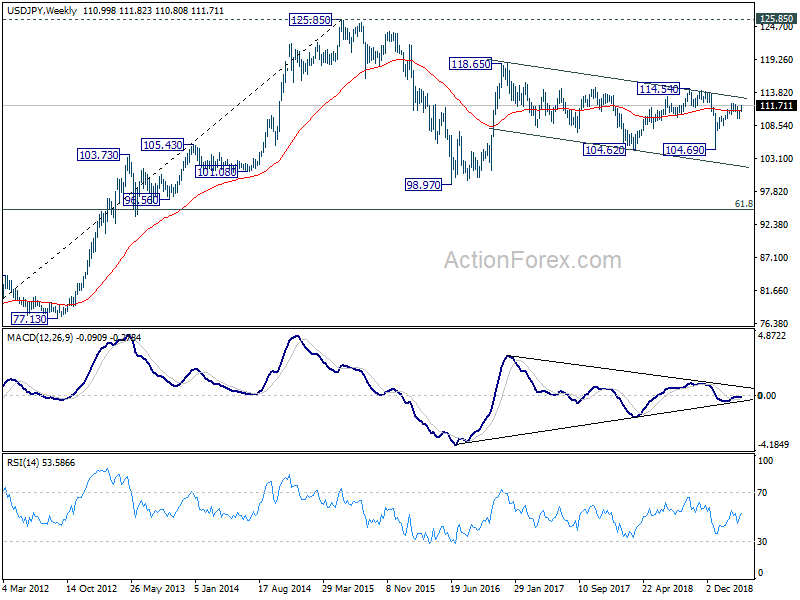
USD/JPY's rise from 109.71 extended higher last week and the development suggests that correction from 112.13 has completed. Initial bias stays on the upside this week first. Decisive break of 112.13 will resume whole rally from 104.69 and target 114.54 resistance next. However, on the downside, break of 111.18 will likely extend the consolidation from 112.13 with another fall to 109.71 and possibly below.
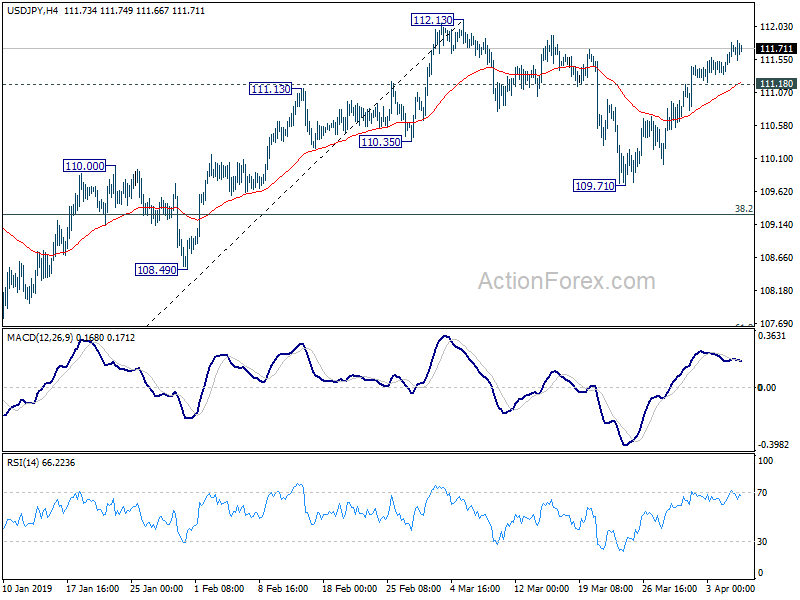
In the bigger picture, medium term outlook in USD/JPY remains a bit mixed as it's staying inside falling channel from 118.65, but there are signs of bullish reversal. On the upside, break of 114.54 resistance will revive the case the corrective fall from 118.65 has completed with three waves down to 104.69. And whole rise from 98.97 (2016 low) is resuming for 118.65 and above. But before that, outlook stays neutral first.
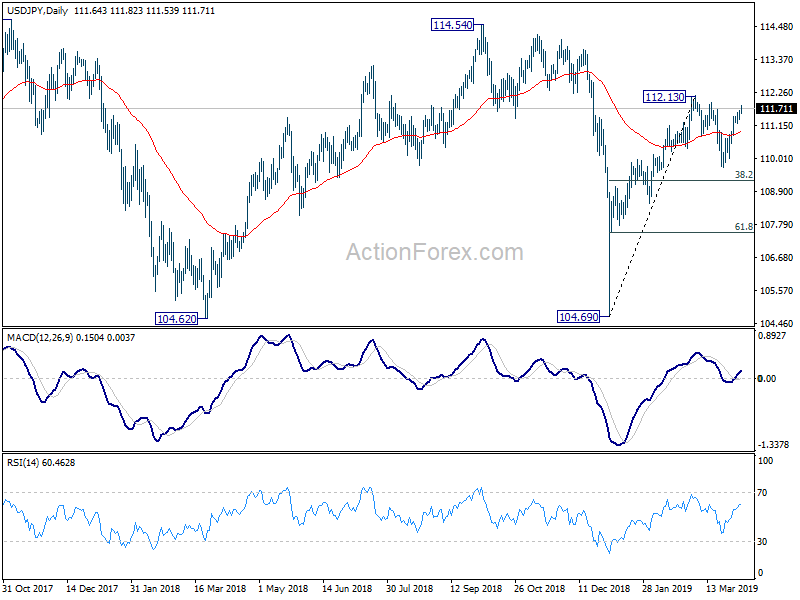
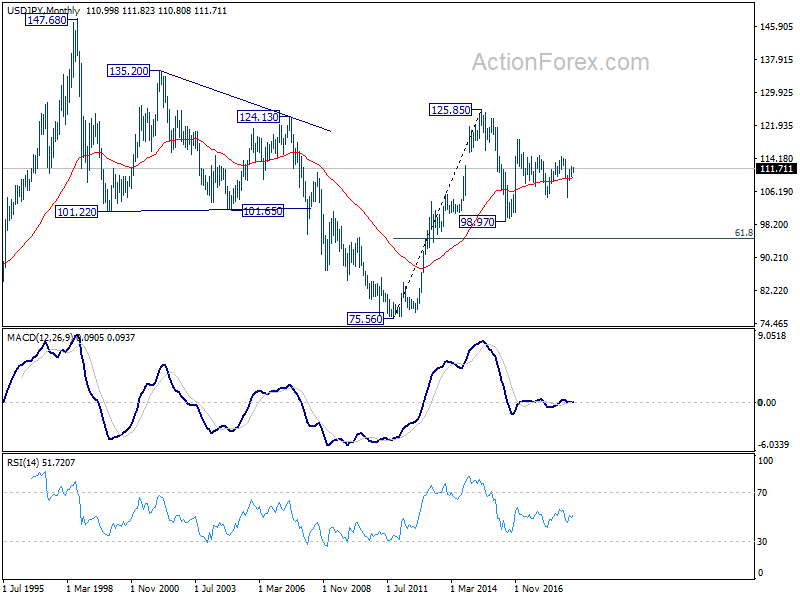
In the long term picture, the rise from 75.56 (2011 low) long term bottom to 125.85 (2015 high) is viewed as an impulsive move, no change in this view. Price actions from 125.85 are seen as a corrective move which could still extend. In case of deeper fall, downside should be contained by 61.8% retracement of 75.56 to 125.85 at 94.77. Up trend from 75.56 is expected to resume at a later stage for above 135.20/147.68 resistance zone.