Sample Category Title
Demand For Risky Assets Has Grown. The US Dollar Index Has Updated Local Lows
Demand for risky assets has resumed again amid the prospects for a truce between the US and China. According to the Financial Times, Washington and Beijing are very close to reaching the final trade deal. The US continues to publish weak economic releases, which put additional pressure on the greenback. Thus, the ADP nonfarm employment change increased by 129K in March instead of 184K. The ISM non-manufacturing PMI dropped to 56.1 in March, while investors expected 58.1. The dollar index (#DX) updated local lows and closed in the negative zone (-0.23%).
The British pound has become stable after a significant rally the day before. Investors continue to assess the situation concerning Brexit. British Prime Minister Theresa May intends to meet with opposition leader Jeremy Corbyn to try to find a way out of the Brexit situation. The opposition Labour Party wants the kingdom to remain in the customs union with the EU. The pound is under pressure due to weak economic data. Thus, UK services PMI fell to 48.9 in March, while experts forecasted 51.0.
The "black gold" prices are testing annual highs. At the moment, futures for the WTI crude oil are consolidating near $62.30 per barrel.
Market Indicators
- Yesterday, the bullish sentiment was observed in the US stock market: #SPY (+0.16%), #DIA (+0.12%), #QQQ (+0.57%).
- The 10-year US government bonds yield is at the level of 2.50-2.51%.
The news feed on 04.04.2019:
- ECB monetary policy meeting account at 14:30 (GMT+3:00);
- Initial jobless claims in the US at 14:30 (GMT+3:00);
- Canada Ivey PMI at 17:00 (GMT+3:00).
NZDUSD Weakens Momentum, Lacks Clear Direction
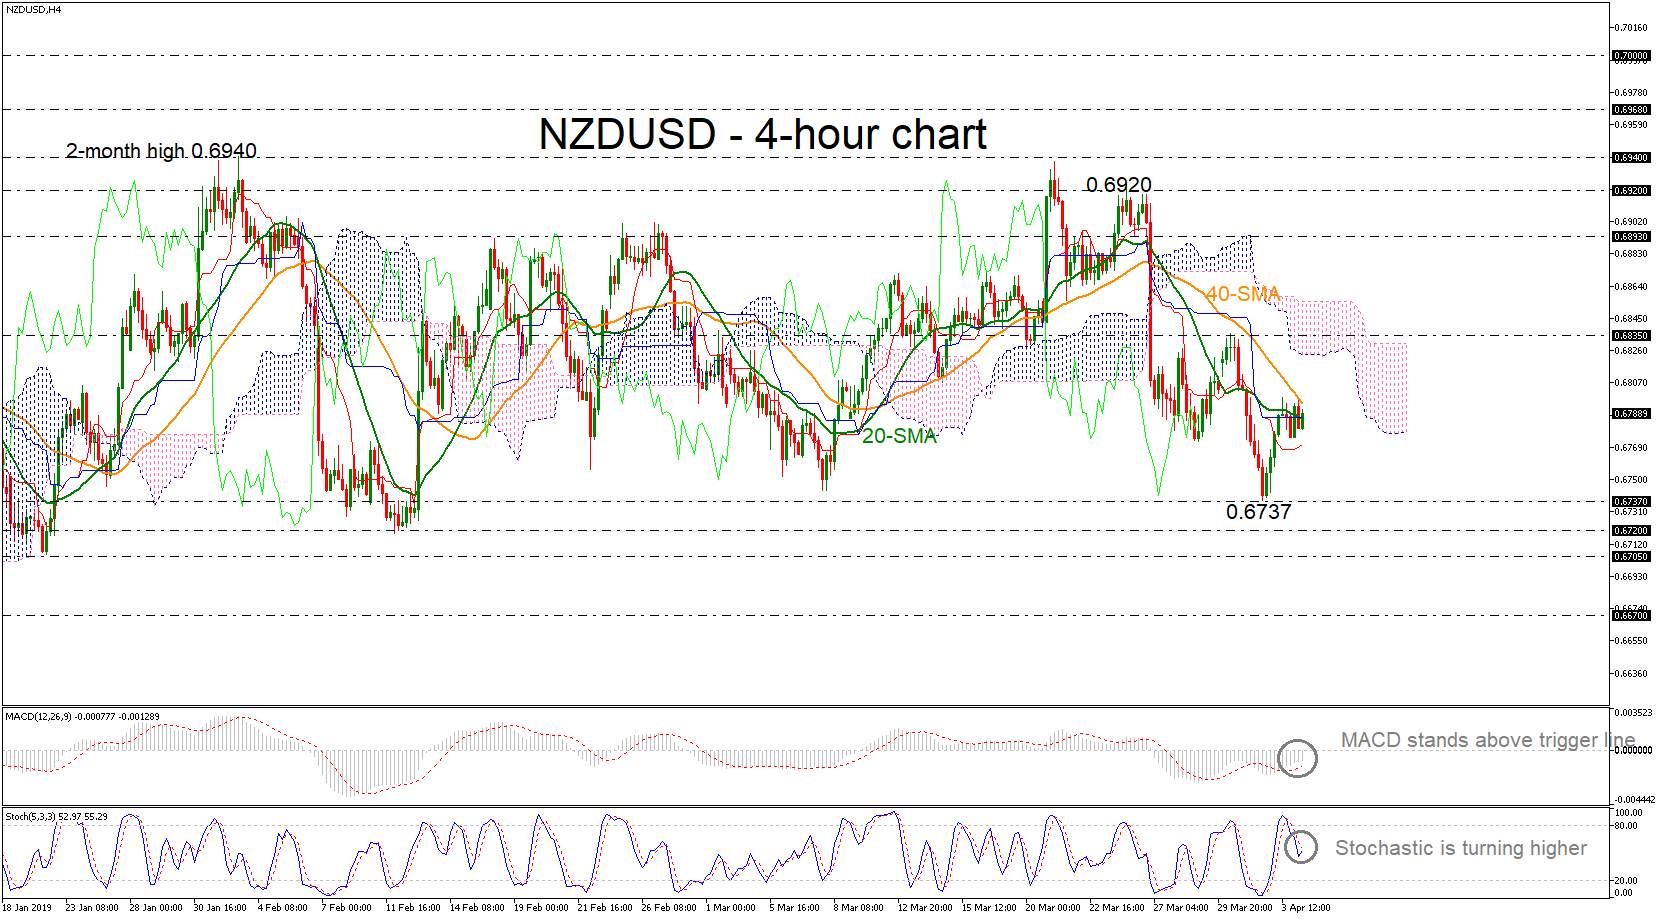
NZDUSD found strong obstacle at the short-term simple moving averages, driving the price beneath them. However, the pair is gaining some momentum, with the Stochastics returning to the upside and the MACD heading above the trigger line but still below the zero line, though less aggressively than in previous days, giving some signs of weakness.
In case prices advance beyond the SMAs, the way could open towards the 0.6835 resistance, taken from the latest highs, and into the Ichimoku cloud. Slightly higher, the upper band of the cloud around 0.6855 could come in focus, which if it fails to hold, further gains could follow, probably until 0.6993, identified by the inside swing bottom on March 26.
On the downside and under the red Tenkan-sen line, the bearish action could pause first near 0.6737, where the price has failed to stop below it since February 12. If the line appears easy to break, the 0.6720 and the 0.6705 could be next barriers to look for.
Meanwhile in the medium-term picture, NZDUSD is trading within the 0.6940 – 0.6737 range. Chances for a bull market seem to be improving as the 50-day MA keeps increasing distance above the 200-day MA, but slowly so.
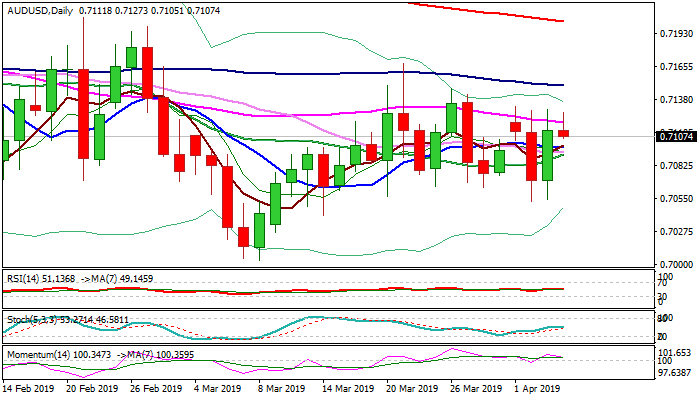
AUD/USD Outlook: Recovery Fails Again At 55SMA
The Aussie dollar eases to 0.7100 zone following little benefit from renewed risk mode on signs of progress of US/China trade talks, as upside attempts were capped for the third consecutive day at 0.7130 zone and repeatedly failed to clearly break above 55SMA (0.7119).
Conflicting daily studies add to mixed signals.
Bullish bias expected to remain above a cluster of daily MA’s between 0.7092 and 0.7098 (converged 10;20;30 SMA’s), but repeated failures at 55SMA would keep the downside vulnerable.
Bullish scenario includes sustained break above 55SMA that would expose pivotal barriers at 0.7150/56 (100SMA / daily cloud top) and signal bullish continuation on break.
Near-term structure would weaken on close below 0.7092 (20SMA).
Res: 0.7119, 0.7149, 0.7156, 0.7203
Sup: 0.7100, 0.7092, 0.7066, 0.7054
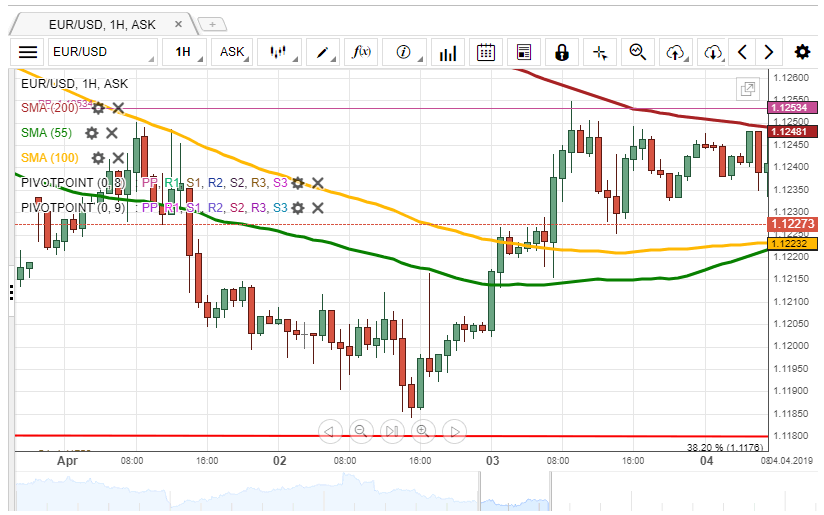
EUR/USD Will Move Sideways
During Wednesday's session, the European Single Currency was retraced by the 200-hour simple moving average to end the session at 1.1240. On Thursday, the rate depreciated to the 1.1233 mark.
It is expected, that the rate will continue to move sideways to be located between the 200-hour SMA at the 1.1248 mark and the 100-hour SMA at the 1.1223 mark.
Moreover, the currency exchange rate could depreciate to the 1.1225 level to be retraced by the 55-hour and the 100-hour simple moving averages.
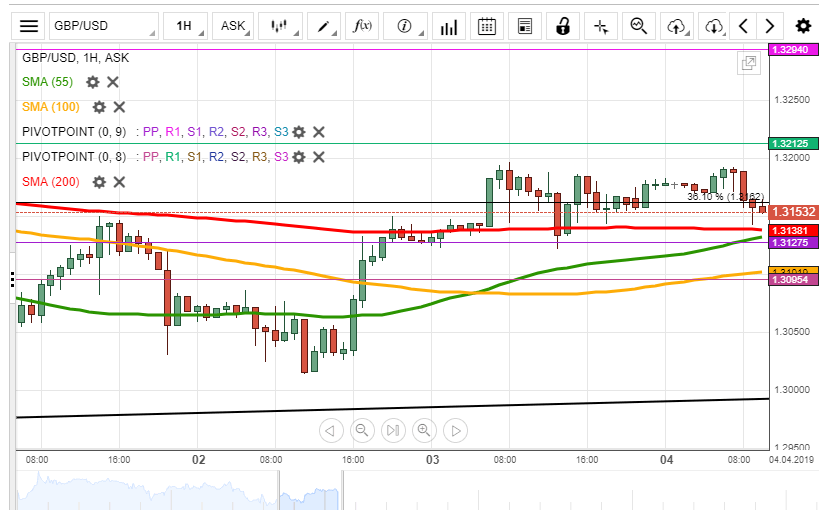
GBP/USD Will Break 36.10% Fibo
During Wednesday's trading session, the British Pound was supported by the 200-hour SMA to break the resistance level of the 36.10% Fibo at 1.3162. Today, the currency exchange rate was located below the 36.10% Fibo at the 1.3159 mark.
Most likely, the 200-hour and the 55-hour simple moving averages will support the rate to break the 36.10% Fibonacci retracement level at the 1.3162 mark.
In addition, most likely, the British Pound will end the trading day at the 1.3150 level.
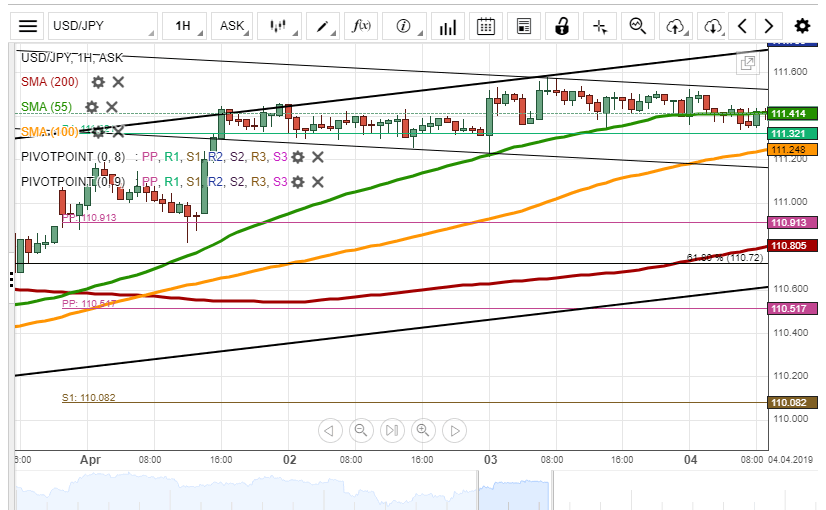
USD/JPY Stays Above Weekly R1
During Wednesday's trading session, the currency exchange rate broke the previously drawn pattern to end the day at 111.30. On Thursday, the rate passed through the support level of the 55-hour SMA to trade at the 111.40 mark.
In regards to the near-term future, most likely, the 100-hour SMA and the support level of the weekly R1 at 111.32 mark will support the USD/JPY to trade sideways at the 111.20 level.
Note, the chart was reviewed to make changes to the previously drawn patterns.
XAU/USD Is At 1,290.00
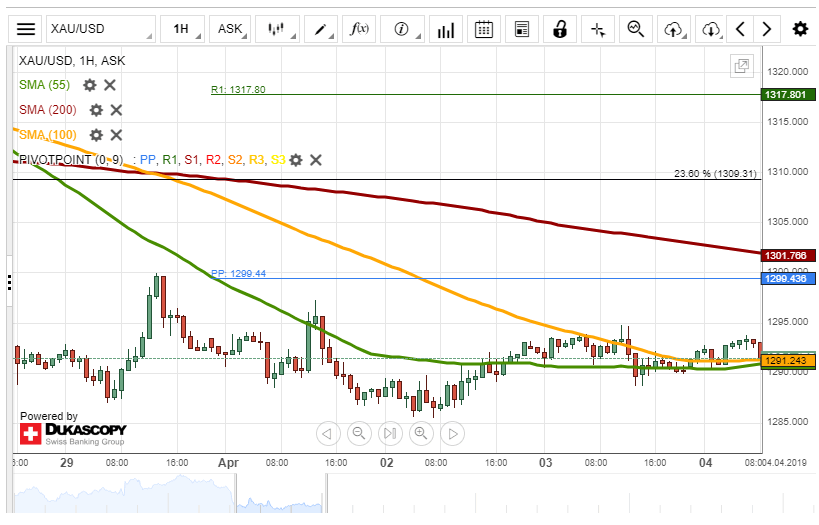
During Wednesday's session, the yellow metal was supported by the 55-hour simple moving average to end the day at 1,290.00. On Thursday, the 55-hour and the 100-hour SMAs supported the rate to the 1,292.07 mark.
Most likely, the currency exchange rate will be trading sideways during the day. It is expected that the rate will stay at the 1,285.00 level.
On the other hand, the support levels of the 100-hour and the 55-hour simple moving averages might push the rate to the 1,295.00 level.
WTI Oil: Near 30% Rally In Oil So Far This Year Unjustifiable
The near 30% rally in WTI Oil during the first quarter of 2019 is difficult to justify when taking into account the progressive concerns that are mounting regarding a global economic downturn. The rally has been supported by improved market confidence that efforts from OPEC+ have tightened the supply in the market, but whether this encouraging sentiment can continue would likely depend on whether Russia continues to support production cuts.
As such, a result to an unprecedented 30% rally over the last quarter, the commodity is going to enter the new quarter as a prime contender to suffer from a market correction. The probability is high that fears over a deceleration in world economic momentum will only get louder as the year progresses, meaning Oil investors will need to re-assess into expectations what impact a global slowdown will have on future demand. A plethora of evidence through data releases from different economies across the globe has already pointed out that a downturn in growth is impending – if the slowdown hasn’t already arrived.
Market perception is that OPEC cuts areworking but demand outlook at risk
One of the major risks for the price of Oil in the second quarter is the increased probability that world economic forecasts for 2019 will be revised lower. While a great volume of noise in the Oil atmosphere is created around headlines involving production, OPEC or even more recently OPEC+, it often gets underlooked just how important Oil demand is for its valuation. Reduced demand is a negative for Oil price and the prospect of further lower demand on global economic health fears will risk re-igniting oversupply concerns that have dominated headlines since the spectacular price crash first occurred in 2014, despite repeated measures and attempts by OPEC and co to rebalance the market.
Iran waivers a wildcard, Saudi Arabia to remain committed to output cuts
If you were to take the contrarian view, there are a few reasons to remain optimistic that Oil can resume its price rebound in Q2. This would however, include some unpredictable risk elements around politics for a commodity that has historically behaved with an extreme level of sensitivity to politics.
Waivers on Iranian sanctions are set to expire over the coming months and if President Trump adopts a hardline approach that results in the taps for Iranian Oil supply being turned off, the subsequent change in the production outlook would prove tempting for potential buyers. Venezuela is another market that has come under the threat of sanctions following recent domestic unrest, while suspicions remain that Saudi Arabia will maintain its underlying commitment towards tightening the available supply of Oil to achieve stronger valuations to help the Kingdom achieve its fiscal targets.
Do not underestimate risk Trump speaking against Oil rally will have on future outlook
Another factor that needs to be taken into account when factoring in potential risks that can swing the hammer of the Oil price in either direction is President Trump.
The President of the United States has made it perfectly clear on numerous occasions that his desire is for Oil prices to return to lower levels for a prolonged period. He has already commented via social media feeds that the Oil price is too high and while he might not be President of a nation that is either a traditional member of OPEC nor OPEC+, he carries the ability to influence world financial markets. When it comes to President Trump’s influence on financial markets it is never an occasion that investors can prepare for when it will happen, but Trump has proven in office that he has a tendency of getting his way in the end, and I would personally not want to be on the wrong side of the trade when the President of the United States is demanding for lower Oil valuations.
WTI knocking on the door at $60, but is anyone home?
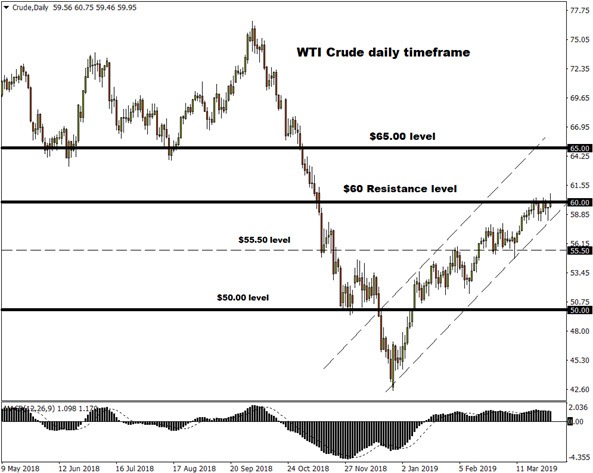
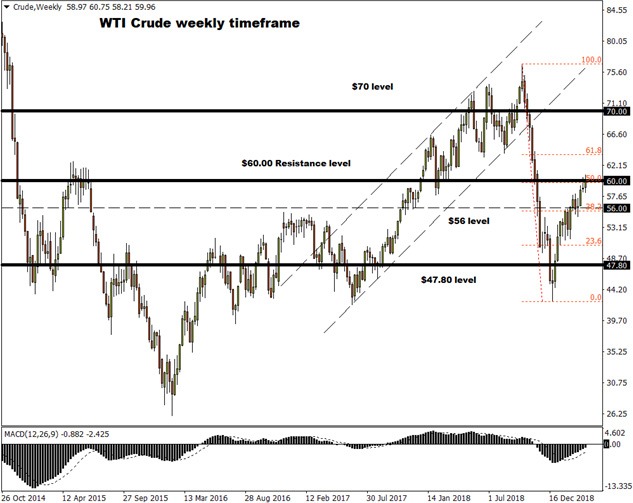
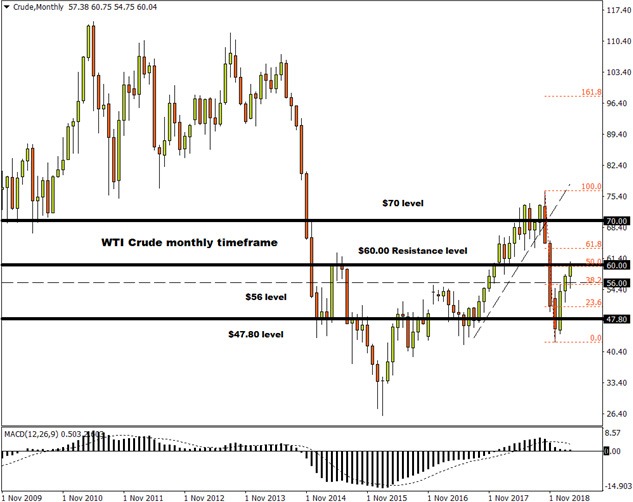
Focusing on the technical picture, WTI Crude has reached tough resistance on the monthly charts with $60 acting as a barrier for bulls preventing prices by being pushed higher. The $60 level ironically also reflects the 50% Fibonacci retracement level of the October -December 2018 downtrend, which helps explain why we are noticing a trend of selling pressure jumping back in the market close to $60.
Until Oil is able to secure a decisive monthly close above $60, it looks like a ceiling is in place for Oil bulls and selling rallies below this level is going to remain as a tempting strategy for bearish investors. A weekly close below $56 will act as a signal for further downside with $52, $50 and $47.80 acting as key points of interest.
If prices are able to conquer $60, Oil has scope to challenge $65
Gold: Set To Glimmer As Investors Seek Refuge In Safe-Havens
Gold is positioned to becomea likely prime destination for safety inthe second quarter of 2019 amid deteriorating global macroeconomic conditions and rising geopolitical risks.
The yellow metal swerved back and forth in Q1, gaining roughly 0.86% due to conflicting fundamental themes. But with the narrative around slowing global growth dampening appetite for risk and the Federal Reserve solidifying its dovish policy U-turn, the outlook for Gold is looking increasingly bright.
Gold to remain heavily influenced by Dollar in the near-term
There is an expectation that the metal’s near-term performance will be heavily influenced by risk sentiment and the Dollar’s valuation. Investor risk sentiment remains strained by ongoing US-China trade developments and Brexit drama, while Dollar bulls appear to be running out of steam. Although the Greenback held up remarkably well during the first quarter of 2019 despite a dovish Fed, there is a strong suspicion that the currency is running on borrowed time. With speculation over the Fed potentially cutting rates in the future seen to be threatening the Dollar’s competitive advantage, Gold may have another valid reason to push higher.
Global growth fears poised to accelerate the flight to safety
Heightened concerns surrounding the health of the US economy have not only pressured the Dollar but rattled its status as a safe-haven asset. Warning lights are flashing amber over the largest economy in the world entering a possible recession after the US Treasury Yield curve inverted for the first time since 2007. Naturally, this is a welcome development for Gold, which has the opportunity to snatch back safe-haven flows from king Dollar.
It is not only the United States that is facing headwinds; growth in Europeis showing risks of crumbling, China is resuming a gradual slowdown while the pace of UK economic expansion remains lacklustre. The fact that global macroeocnomic conditions are painting a gloomy picture will likely encourage the flight to safety – presenting a compelling argument for investors to monitor the Gold price.
Will rising equity markets weaken Gold’s allure?
A valid argument for the precious metal to depreciate in the coming months is likely based around the fact that global equity markets have performed relatively well year-to-date, despite ongoing growth concerns. However, the stock market rally seemsto be running out of steam with uncertainty over US-China trade talks, Brexit and even developments in Europe potentially sparking a heavy selloff.
Longer term outlook influenced by yields and EM
In the longer term, Gold is likely to remain supported by lower yields as growth fears result in falling interest rates across the globe. Demand in emerging markets is another factor that will impact the metal’s trajectory. If emerging markets are able to exploit the likely period of Dollar weakness to rise higher, physical demand for Gold could jump which will support upside gains.
While Gold bulls remain in a position of power fundamentally, control can still be easily wrestled away if global risk sentiment is boosted by a breakthrough in US-China trade talks or signs of global growth recovering.
Gold bulls wait for perfect moment to attack
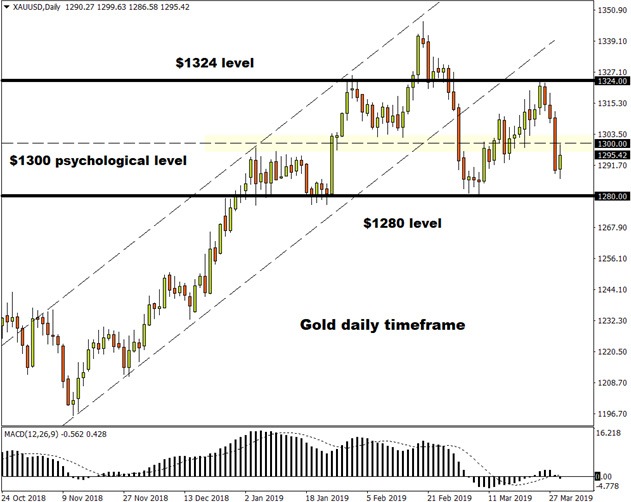
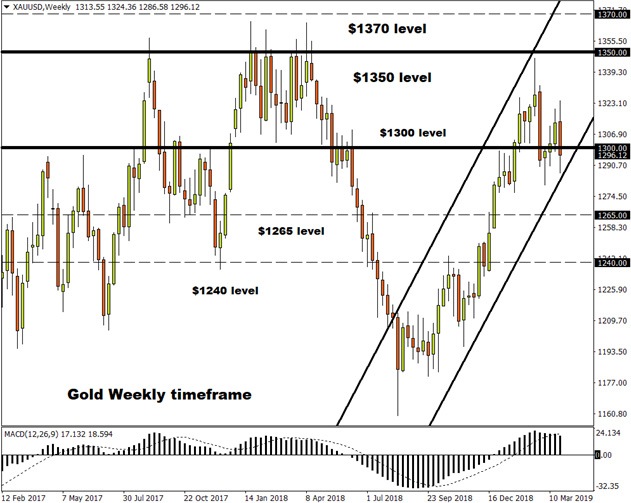
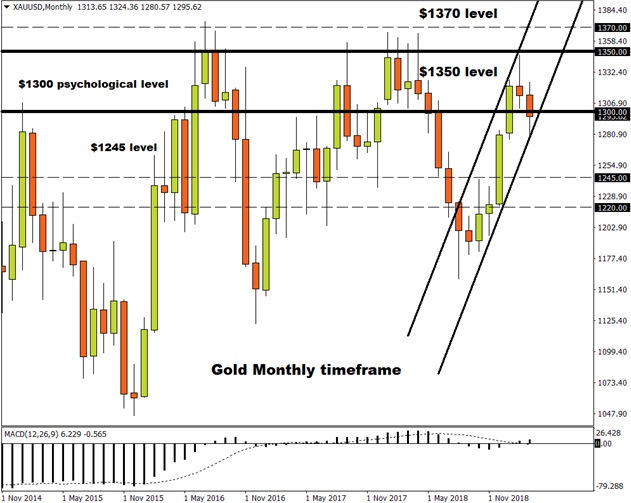
Focusing on the technical picture, Gold is experiencing a technical correction on the monthly charts. Although prices are trading below the $1300 phychological level, the trend still remains above the 20 Simple Moving Average. A technical rebound around the $1280-70 regions is on the cards which should push prices back towards $1300. A monthly close above this level should inspire bulls with enough inspiration to challenge $1324, $1350, $1370respectively. Alternatively, sustained weakness below $1265 threatens the bullish setup with prices likely to sink further towards $1245 and $1220.
Q2 Outlook – AUD/USD: Range-Bound Amid Eventful Q2
It's going to be a busy second quarter for the Australian Dollar.
April kicks off with the budget announcement, which should pave the way for Australia's federal elections in May. This adds another layer of domestic risk to the Aussie's outlook, with policy continuity being a major talking point for domestic and foreign investors. AUDUSD has gained by more than 0.5 percent in the first three months of 2019, and the near-term outlook on what is next for the Australian Dollar should become clearer once the elections are over.
Macroeconomic conditions paint a confusing picture
In the meantime, the domestic outlook remains compounded by puzzling economic indicators.
The Reserve Bank of Australia (RBA) paints a hopeful picture of steady growth, with a 2.8 percent increase across 2019 and 2020. However, consumer sentiment has been dampened by falling house prices, while business sentiment has also been in a broad decline.
In contrast, the jobs market is proving to be robust, where unemployment has fallen to an eight-year low. Yet, wage growth has been flat, coupled with weak household spending, which means that domestic consumption isn't firing on all cylinders.
Such juxtapositions likely warrant the RBA leaving the benchmark interest rate untouched through Q2, having been kept at a record-low of 1.5 percent since mid-2016. However, the RBA might strike a downbeat tone and hint that an interest rate cut will be warranted, should downside offshore risks become more pronounced.
External factors will influence the Australian Dollar
Looking at the external front, the second quarter of 2019 is expected to bring about the long-awaited US-China trade deal, which may present something of a double-edged sword for Australia. A concrete trade agreement, one that lifts US tariffs on Chinese imports, could boost AUD along with other Asian currencies as risk-on sentiment gets a shot in the arm. However, a trade deal that forces China to import more from America could erode Australian shipments and is likely to be negative for the domestic economy.
It must also be kept in mind that, among all developed economies, Australia is the most dependent on China. With the Australian Dollar serving as a proxy to the Chinese economy, a steeper slowdown in the world's second largest economy is expected to feed negatively into AUD.
What role will China play in Australia's outlook?
We note that Beijing has already announced stimulus measures to boost domestic consumption, but it will take time before the proposed tax cuts and boosted lending arereflected in China's economic data. Such hopes are perhaps best kept for the second half of 2019. Hence, for the April-June period, expect AUD traders to continue biting the bullet in the likelihood of continued external market risks, until China shows material signs of stabilizing growth, which would in turn be supportive of the Aussie.
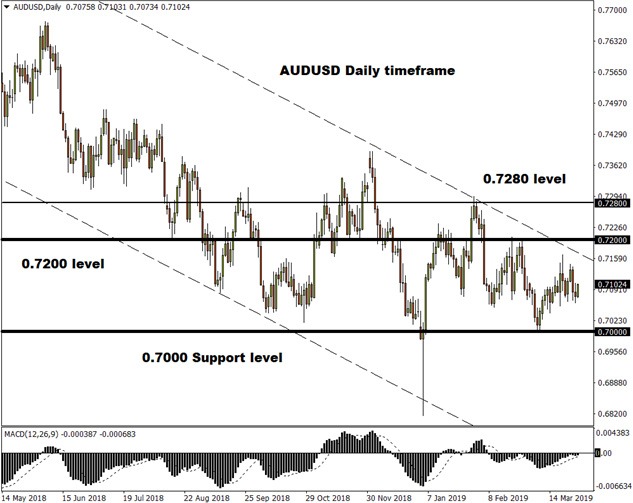
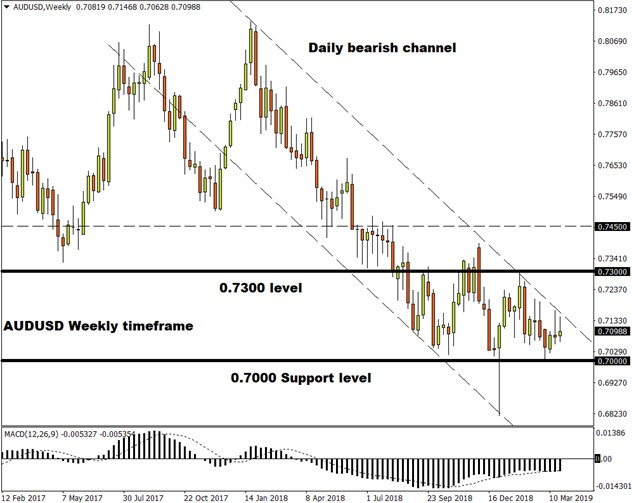
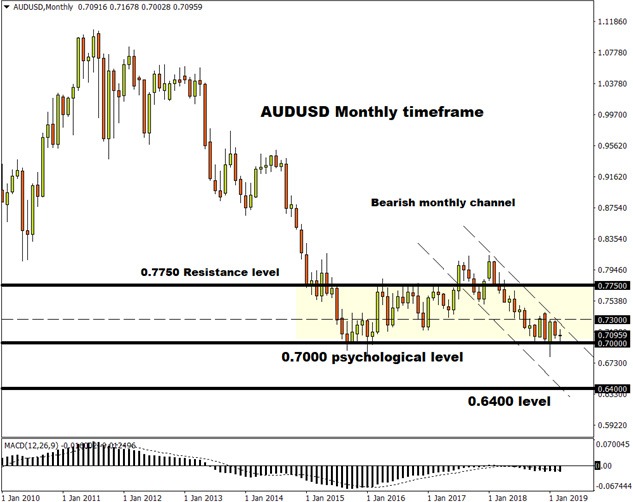
Will 0.700 prove to be a reliable support?
Looking at the technical picture, the Australian Dollar's bearish trend in 2018 appears to have flattened out in the first quarter of the year, finding support at the psychologically-important 0.70 mark. However, given the confluence of external and domestic risks highlighted above, AUDUSD may struggle to find near-term catalysts for more upside to materialize.
Resistance may arrive at its 200-day simple moving average of 0.72, with stronger resistance at its near 0.73 year-to-date high.